

Comparative Analysis Reveals Novel Changes in Plasma Metabolites and Metabolomic Networks of Infants With Retinopathy of Prematurity
- PMID: 35060995
- PMCID: PMC8787637
- DOI: 10.1167/iovs.63.1.28
Comparative Analysis Reveals Novel Changes in Plasma Metabolites and Metabolomic Networks of Infants With Retinopathy of Prematurity
Abstract
Purpose: Advances in mass spectrometry have provided new insights into the role of metabolomics in the etiology of several diseases. Studies on retinopathy of prematurity (ROP), for example, overlooked the role of metabolic alterations in disease development. We employed comprehensive metabolic profiling and gold-standard metabolic analysis to explore major metabolites and metabolic pathways, which were significantly affected in early stages of pathogenesis toward ROP.
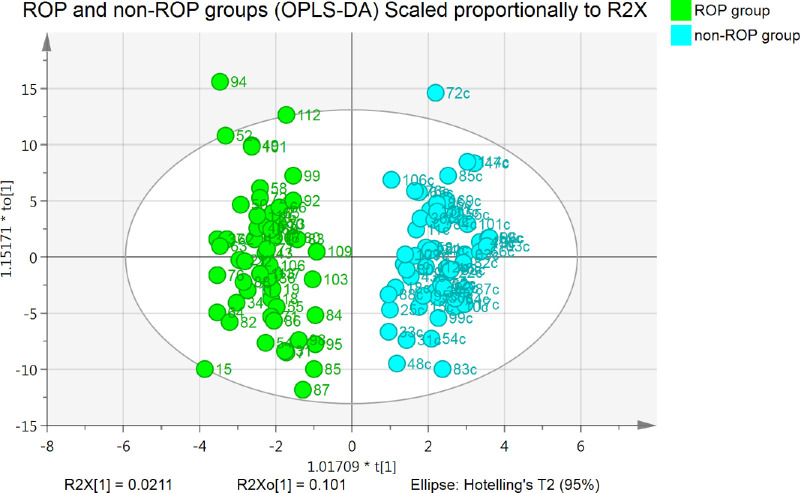
Methods: This was a multicenter, retrospective, matched-pair, case-control study. We collected plasma from 57 ROP cases and 57 strictly matched non-ROP controls. Non-targeted ultra-high-performance liquid chromatography-tandem mass spectroscopy (UPLC-MS/MS) was used to detect the metabolites. Machine learning was employed to reveal the most affected metabolites and pathways in ROP development.
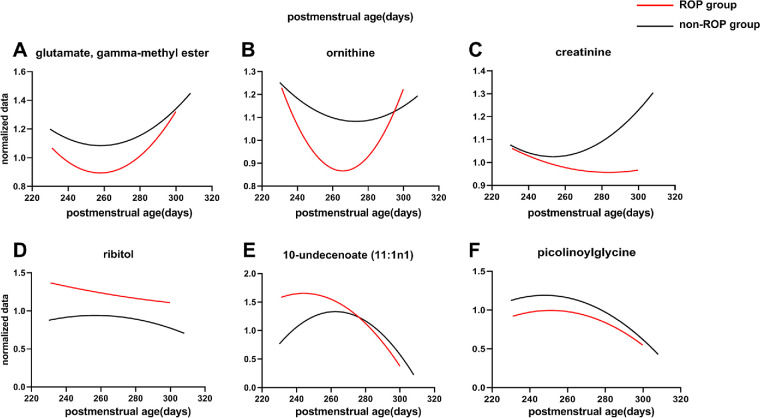
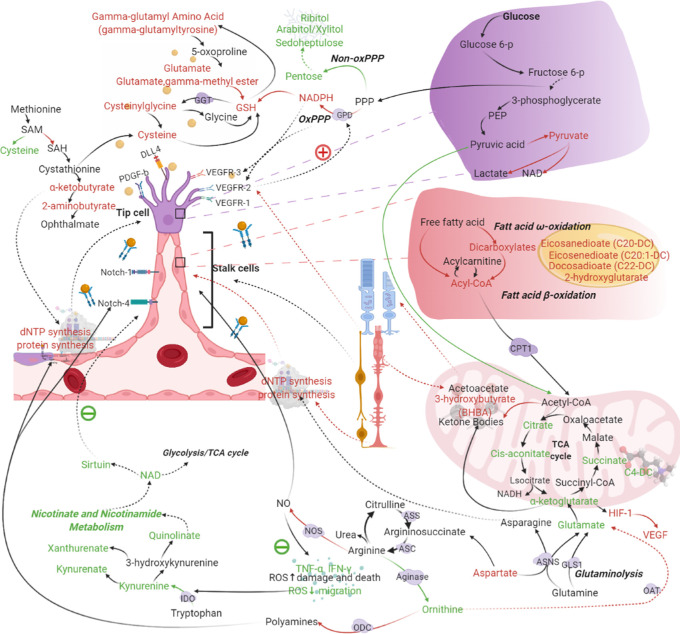
Results: Compared with non-ROP controls, we found a significant metabolic perturbation in the plasma of ROP cases, which featured an increase in the levels of lipids, nucleotides, and carbohydrate metabolites and lower levels of peptides. Machine leaning enabled us to distinguish a cluster of metabolic pathways (glycometabolism, redox homeostasis, lipid metabolism, and arginine pathway) were strongly correlated with the development of ROP. Moreover, the severity of ROP was associated with the levels of creatinine and ribitol; also, overactivity of aerobic glycolysis and lipid metabolism was noted in the metabolic profile of ROP.
Conclusions: The results suggest a strong correlation between metabolic profiling and retinal neovascularization in ROP pathogenesis. These findings provide an insight into the identification of novel metabolic biomarkers for the diagnosis and prevention of ROP, but the clinical significance requires further validation.
Conflict of interest statement
Disclosure:
Figures


Similar articles
-
Plasma metabolites in treatment-requiring retinopathy of prematurity: Potential biomarkers identified by metabolomics.Exp Eye Res. 2020 Oct;199:108198. doi: 10.1016/j.exer.2020.108198. Epub 2020 Aug 21. Exp Eye Res. 2020. PMID: 32828955
-
Targeted Blood Metabolomic Study on Retinopathy of Prematurity.Invest Ophthalmol Vis Sci. 2020 Feb 7;61(2):12. doi: 10.1167/iovs.61.2.12. Invest Ophthalmol Vis Sci. 2020. PMID: 32049343 Free PMC article.
-
Plasma levels of amino acids and derivatives in retinopathy of prematurity.Int J Med Sci. 2021 Aug 27;18(15):3581-3587. doi: 10.7150/ijms.63603. eCollection 2021. Int J Med Sci. 2021. PMID: 34522185 Free PMC article.
-
[Blood metabolites in preterm infants with retinopathy of prematurity based on tandem mass spectrometry: a preliminary study].Zhongguo Dang Dai Er Ke Za Zhi. 2023 Feb 15;25(2):140-146. doi: 10.7499/j.issn.1008-8830.2209142. Zhongguo Dang Dai Er Ke Za Zhi. 2023. PMID: 36854689 Free PMC article. Chinese.
-
Amino Acids Metabolism in Retinopathy: From Clinical and Basic Research Perspective.Metabolites. 2022 Dec 9;12(12):1244. doi: 10.3390/metabo12121244. Metabolites. 2022. PMID: 36557282 Free PMC article. Review.
Cited by
-
A fundus image dataset for intelligent retinopathy of prematurity system.Sci Data. 2024 May 27;11(1):543. doi: 10.1038/s41597-024-03362-5. Sci Data. 2024. PMID: 38802420 Free PMC article.
-
Identification of serum metabolite biomarkers in premature infants with bronchopulmonary dysplasia: protocol for a multicentre prospective observational cohort study.BMJ Open. 2025 Jan 15;15(1):e089064. doi: 10.1136/bmjopen-2024-089064. BMJ Open. 2025. PMID: 39819932 Free PMC article.
-
Metabolic correlations between kidney and eye in a mouse model of oxygen-induced retinopathy and retinopathy of prematurity.BMJ Open Ophthalmol. 2025 May 1;10(1):e001955. doi: 10.1136/bmjophth-2024-001955. BMJ Open Ophthalmol. 2025. PMID: 40312111 Free PMC article.
-
Serine supplementation suppresses hypoxia-induced pathological retinal angiogenesis.Theranostics. 2025 Apr 9;15(11):5087-5105. doi: 10.7150/thno.105299. eCollection 2025. Theranostics. 2025. PMID: 40303351 Free PMC article.
-
Retinopathy of prematurity: Metabolic risk factors.Elife. 2022 Nov 24;11:e80550. doi: 10.7554/eLife.80550. Elife. 2022. PMID: 36420952 Free PMC article.
References
-
- Dhingra D, Katoch D, Dutta S, et al. .. Change in the incidence and severity of retinopathy of prematurity (ROP) in a neonatal intensive care unit in Northern India after 20 years: comparison of two similar prospective cohort studies. Ophthalmic Epidemiol. 2019; 26(3): 169–174. - PubMed
Publication types
MeSH terms
Substances
LinkOut - more resources
Full Text Sources
