. 2022 Mar 7;219(3):e20211777.
doi: 10.1084/jem.20211777. Epub 2022 Jan 21.

Single-cell immune profiling reveals functional diversity of T cells in tuberculous pleural effusion

Affiliations

Single-cell immune profiling reveals functional diversity of T cells in tuberculous pleural effusion

Yi Cai et al. J Exp Med. .

Abstract

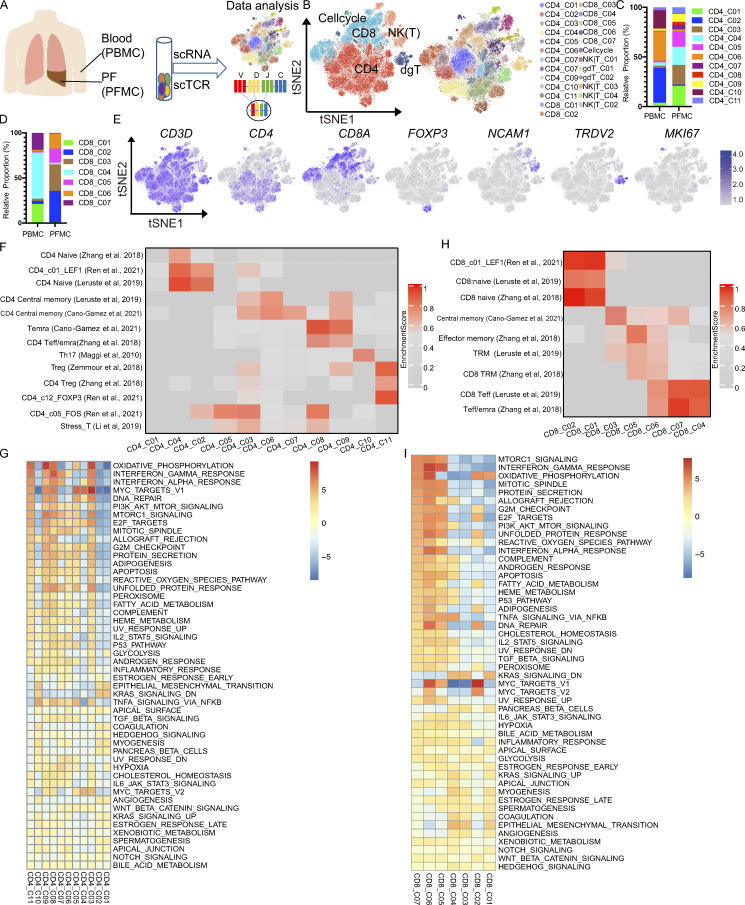
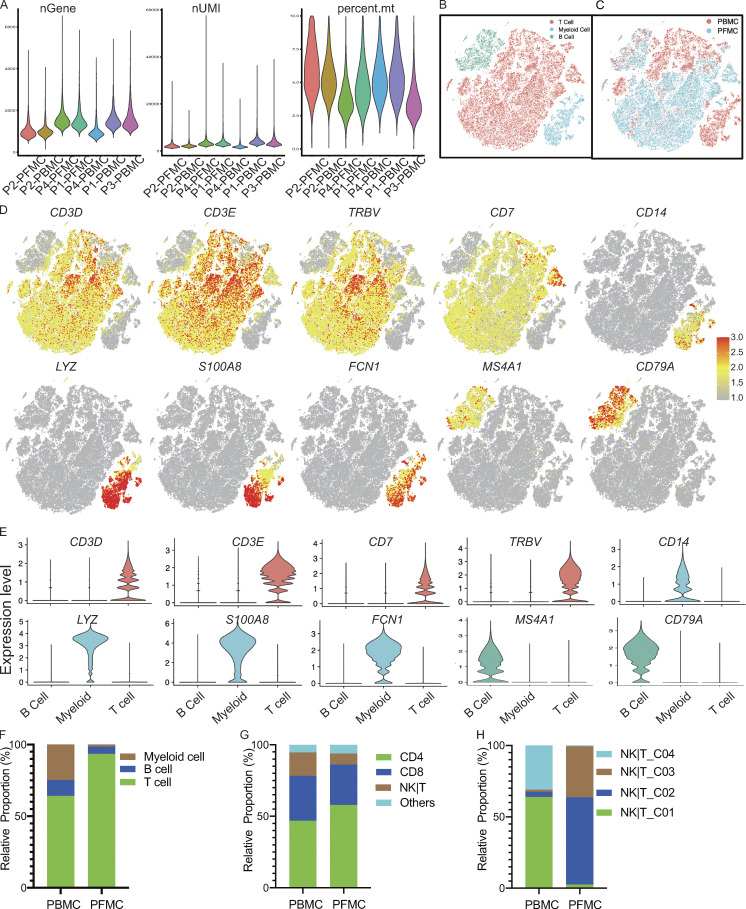
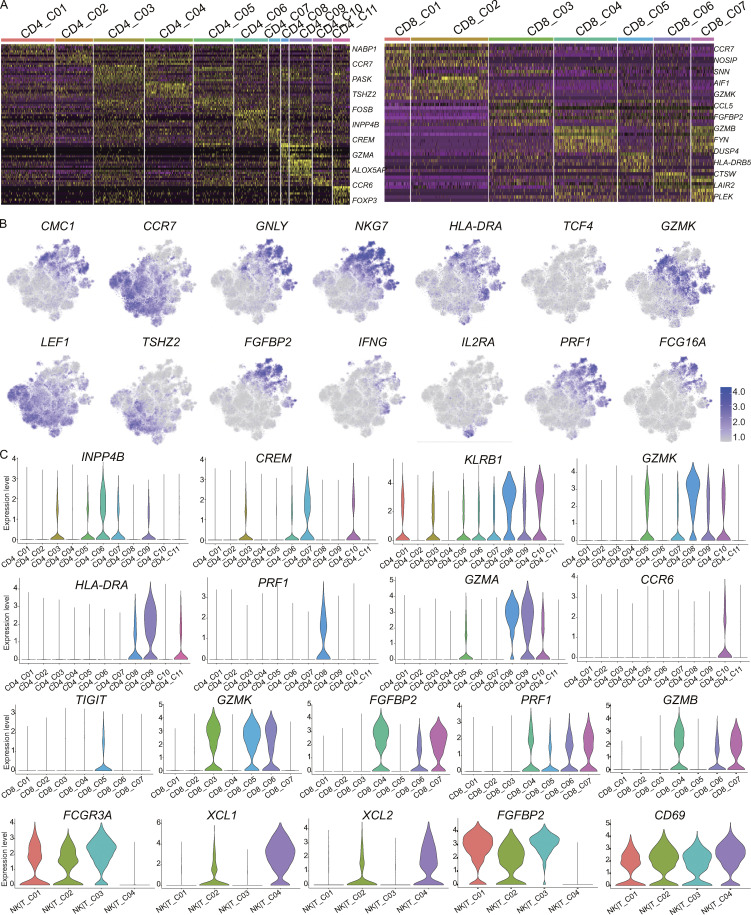
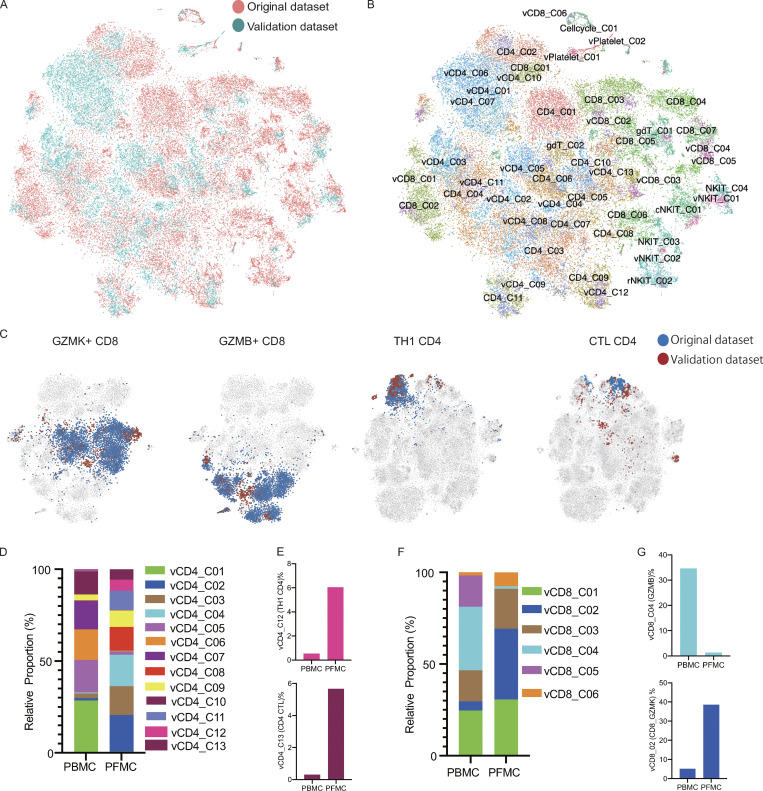
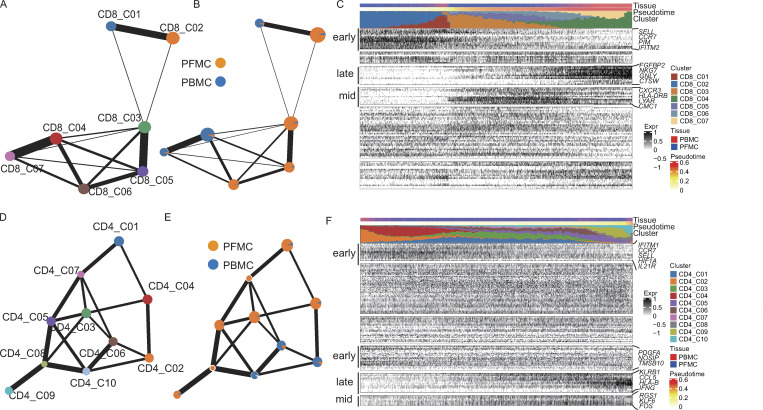
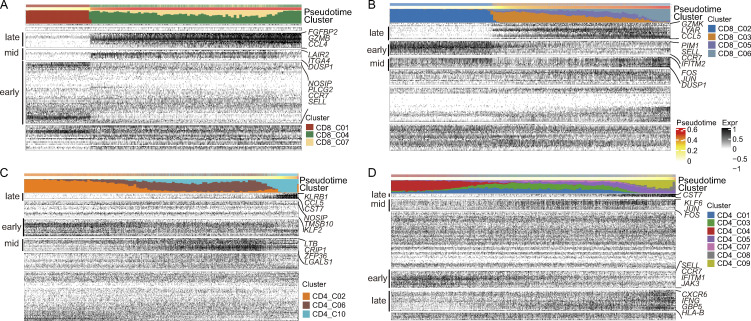
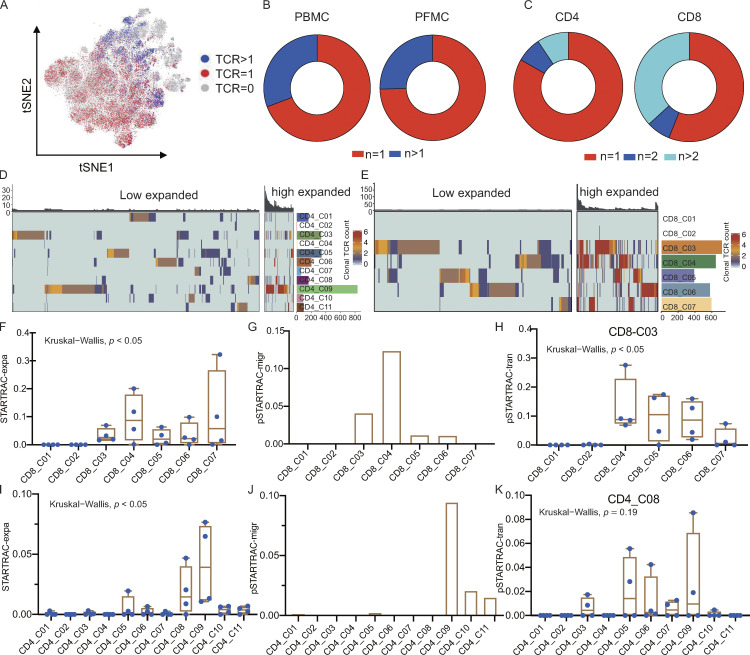
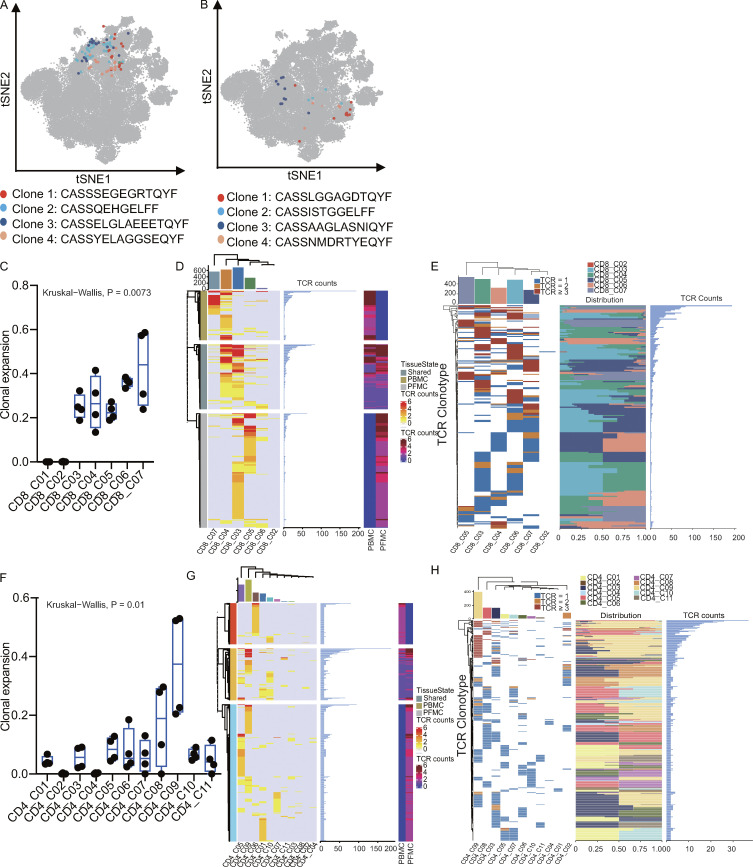
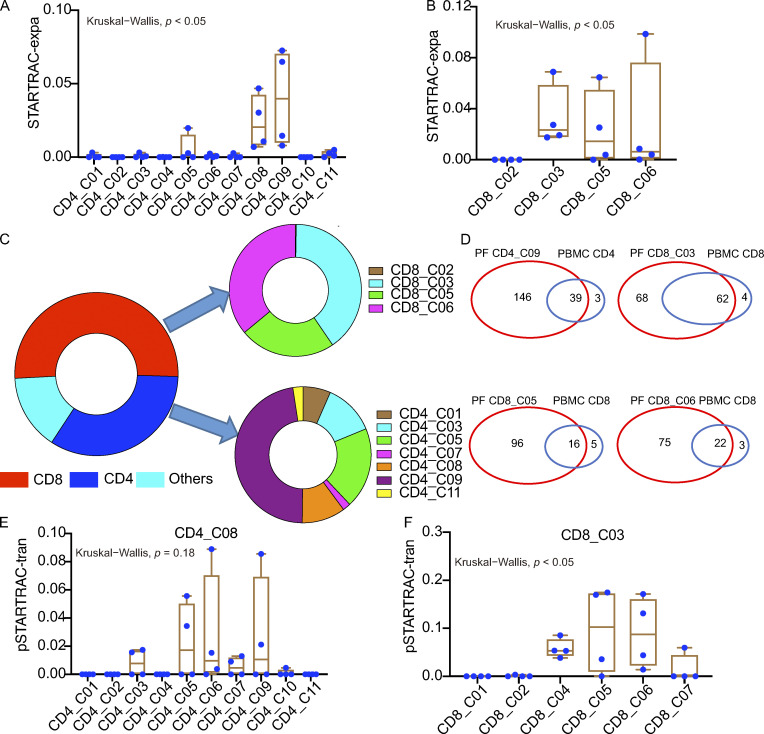
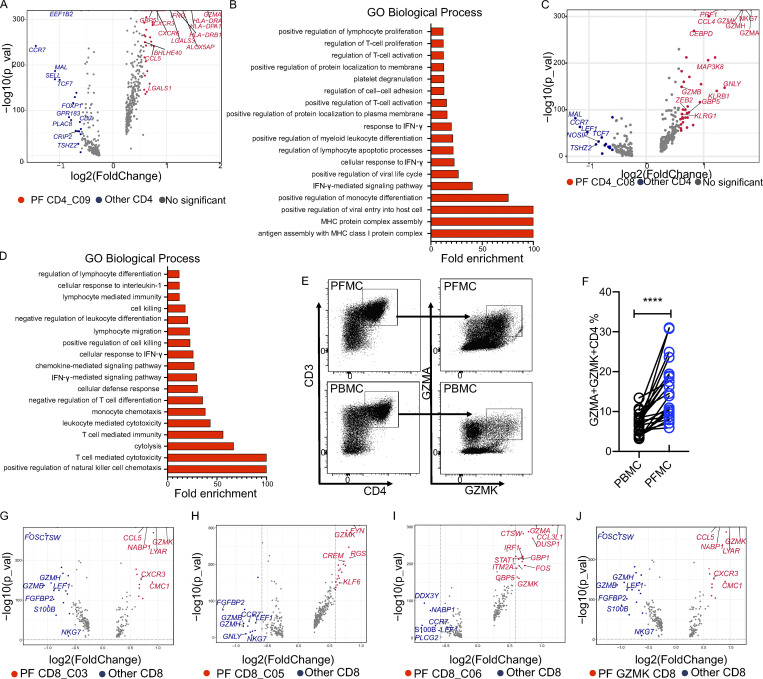
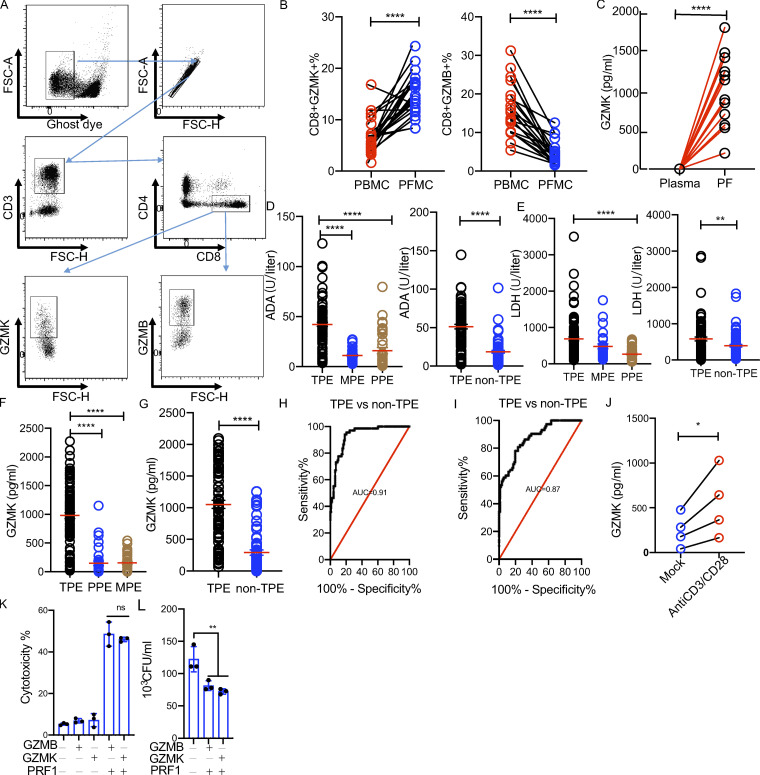
Orchestration of an effective T lymphocyte response at infection sites is critical for protection against Mycobacterium tuberculosis (Mtb) infection. However, the local T cell immunity landscape in human tuberculosis is poorly defined. Tuberculous pleural effusion (TPE), caused by Mtb, is characterized by an influx of leukocytes to the pleural space, providing a platform suitable for delineating complex tissue responses to Mtb infection. Using single-cell transcriptomics and T cell receptor sequencing, we analyzed mononuclear cell populations in paired pleural fluid and peripheral blood of TPE patients. While all major cell clusters were present in both tissues, their relative proportions varied significantly by anatomic location. Lineage tracking analysis revealed subsets of CD8 and CD4 T cell populations with distinct effector functions specifically expanded at pleural sites. Granzyme K-expressing CD8 T cells were preferentially enriched and clonally expanded in pleural fluid from TPE, suggesting that they are involved in the pathogenesis of the disease. The findings collectively reveal the landscape of local T cell immunity in tuberculosis.


Conflict of interest statement

Disclosures: The authors declare no competing interests exist.

Figures

Figure 1.
Figure 1.
Single-cell immune profiling of T cell heterogeneity in TPE. (A) The experimental workflow for defining and comparing T cells between the blood and PF in TPE. (B) tSNE of the T cell profile, with each cell color-coded for the main cell types and associated cell subsets from four TPE patients (PBMC, n = 3; PFMC n = 4). (C) The fraction of cells for CD4 T cell subsets in blood and PF from four TPE patients. (D) The fraction of cells for CD8 T cell subsets in blood and PF from four TPE patients. (E) tSNE plot of expression levels of selected genes in different clusters indicated by the colored oval. (F and G) Individual cell enrichment of indicated selected signatures or marker genes from published dataset; the enrichment scores are shown in the heatmap. (F) CD4 subsets. (G) CD8 subsets. Temra, effector memory or effector; Teff, effector; Trm, tissue resident memory. (H) Differences in pathway activities scored per cell by GSEA between the different CD4 T clusters from four TPE patients. (I) Differences in pathway activities scored per cell by GSVA between the different CD8 T clusters from four TPE patients.
Figure S1.
Figure S1.
scRNA-seq of cells from TPE. (A) Consistency of cell capture and identification in scRNA-seq. Number of UMIs (nUMIs) and genes (nGene) identified and fraction of reads mapped to mitochondrial (mt) genes across all samples (n = 4). (B) All samples merged single cells with the associated main cell types. (C) All samples merged single cells with the corresponding tissues (PBMCs and PFMCs). (D) tSNE plot of expression levels of selected genes in different cell types indicated by the colored ovals. (E) Violin plot of expression levels of selected genes in different cell types. (F) The relative proportion of cells for main cell types in blood and PF from TPE (n = 4). (G) The relative proportion of cells for T cell subsets in the T cell fraction in blood and PF from TPE (n = 4). (H) The relative proportion of cells for NK|T subsets in blood and PF from TPE (n = 4).
Figure S2.
Figure S2.
Expression of marker genes for T cell subsets. (A) Differential expression analysis comparing CD4 subsets (left) and CD8 subsets (right) from the blood and PF. Heatmaps indicate the up- and down-regulated genes in CD4 T cell and CD8 T cell subsets, respectively. (B) tSNE plot of expression levels of selected genes in different cell subsets. (C) Violin plot of expression levels of selected genes in different cell subsets.
Figure S3.
Figure S3.
Analysis of the validation dataset. (A and B) tSNE of the combined original (n = 4) and validation (n = 2) data with each cell color-coded for the different datasets (A) or associated cell subsets (B). For integrating two datasets, the datasets were normalized to find variable features using the R package Seurat (v3.2.0) with default parameters, and 30 PCs were selected for the tSNE analysis, with default parameters. CD4/CD8 from the original dataset; vCD4/vCD8 from the validation dataset. (C) tSNE of the GZMK-expressing CD8, GZMB-expressing CD8, Th1 CD4, and CTL CD4 T cells from the original and validation datasets. (D) The relative proportion of cells of the CD4-cell subsets in the T cell fraction of the validation dataset (n = 2). (E) The fraction of cells for Th1 CD4 and CTL CD4 in CD4 T cells from blood and PF in the validation dataset (n = 2). (F) The relative proportion of cells of the CD8 T cells subsets in the T cell fraction of the validation dataset (n = 2). (G) The fraction of cells of the GZMB-expressing CD8 and GZMK-expressing CD8 T cells in CD8 T cell from blood and PF in the validation dataset (n = 2).
Figure 2.
Figure 2.
Pseudo-time analysis reveals distinct CD4 and CD8 T cell differentiation trajectories in PBMCs and PFMCs. (A and B) PAGA analysis of CD8 T cell pseudo-time: the associated cell type (A) and the corresponding status (PBMC, n = 3; and PFMC, n = 4; B) are shown. (C) Reconstructed PAGA paths for the differentiation of the identified CD8 T cells from TPE. (D and E) PAGA analysis of CD8 T cell pseudo-time: the associated cell type (D) and the corresponding status (PBMC and PFMC; E) are shown. (F) Reconstructed PAGA paths for the differentiation of the identified CD4 T cells from TPE.
Figure S4.
Figure S4.
Pseudo-time analysis of CD4 and CD8 differentiation trajectories in PBMCs and PFMCs. (A) Reconstructed PAGA paths for differentiation of the identified CD8 T cells from blood (n = 3). (B) Reconstructed PAGA paths for differentiation of the identified CD8 T cells from PF (n = 4). (C) Reconstructed PAGA paths for differentiation of the identified CD4 T cells from blood (n = 3). (D) Reconstructed PAGA paths for differentiation of the identified CD8 T cells from PF (n = 4).
Figure 3.
Figure 3.
TCR distribution and clonality analysis. (A) The TCR distribution of T cells. Gray (n = 0), red (n = 1), and blue (n > 1). (B and C) TCR distribution in different tissue types (B) and cell types (C). (D and E) Phenotypic analysis of low expanded (TCR <5) and high expanded (TCR ≥5) clonotypes in CD4 and CD8 T cell subsets. Individual T cells are grouped by TCR sequence; each bar above the heatmaps represents a distinct TCR sequence. (F) Clonal expansion levels of CD8 T cell clusters quantified by STARTRAC-expa for each patient (n = 4); Kruskal–Wallis H tests were performed to analyze differences in the STARTRAC results. (G) Migration potentials of CD8 subsets by pSTARTRAC-migr indices between blood and PF. The shared clonotypes in each CD8 subset (all patients combined) between blood and PF was analyzed by pSTARTRAC-migr. (H) Developmental transition of CD8_C03 cells with other CD8 cells, quantified by pSTARTRAC-tran indices for each patient (n = 4); Kruskal–Wallis H tests were performed to analyze differences. (I) Clonal expansion levels of CD4 T cell clusters quantified by STARTRAC-expa for each patient (n = 4); Kruskal–Wallis H tests were performed to analyze differences. (J) Migration potentials of CD4 subsets by pSTARTRAC-migr indices between blood and PF. The shared clonotypes in each CD4 subset (all patients combined) between blood and PF was analyzed by pSTARTRAC-migr. (K) Developmental transition of CD4_C08 cells with other CD4 cells quantified by pairwise STARTRAC-tran indices for each patient (n = 4). Kruskal–Wallis H tests were performed to analyze differences.
Figure S5.
Figure S5.
Analysis of TCR expansion and sharing status between subsets or tissues. (A) The spatial distribution of cells, showing only those CD8 T cells sharing the same TCRs in colors. (B) The spatial distribution of cells, showing only those CD4 T cells sharing the same TCRs in colors. Four different clonotypes are shown, with different colors. (C) The percentage of clonal expansion in CD8 T cell clusters. Clonal expansion rate = total of cells in expansion clonotypes (TCR > 1) cells ÷ total of cells with TCR. (D) Analysis of shared clonotypes in CD8 T cells between PBMCs and PFMCs. Left: PBMC specific TCRs (top), shared PBMC and PFMC TCRs (middle), and PFMC-specific TCRs (bottom) in CD8 T cell subsets. Middle: The number of cells with identical TCRs for each clonotype from the left panel. Right: The distribution of different clonotypes in PBMCs and PFMCs (PBMC, n = 3, PFMC, n = 4). (E) Analysis of shared clonotypes in CD8 subsets. Left: TCR sequences are grouped by CD8 subsets; each bar in the heatmaps represents a distinct TCR sequence. Middle: The distribution of cells with identical TCRs in CD8 T cell subsets. Right: The number of cells with identical TCRs for each clonotype from left panel. (F) The percentage of clonal expansion in CD4 T cell clusters. (G) Analysis of shared clonotypes in CD4 T cell between PBMCs and PFMCs. Left: PBMC-specific TCRs (top), shared PBMC and PFMC TCRs (middle), and PFMC-specific TCRs (bottom) in CD4 T cell subsets. Middle: The number of cells with identical TCRs for each clonotype from the left panel. Right: The distribution of different clonotypes in PBMCs and PFMCs. (H) Analysis of shared clonotypes in CD4 subsets. Left: TCR sequences are grouped by CD4 subsets; each bar in the heatmaps represents a distinct TCR sequence. Middle: The distribution of cells with identical TCRs in CD4 T cell subsets. Right: The number of cells with identical TCRs for each clonotype from the left panel.
Figure 4.
Figure 4.
STARTRAC analysis of PF-enriched T cell clonal expansion and developmental transition. (A) Clonal expansion levels of CD4 T cells from PF quantified by STARTRAC-expa for each patient (n = 4); Kruskal–Wallis H tests were performed to analyze differences in the STARTRAC results. (B) Clonal expansion levels of CD8 T cells from PF quantified by STARTRAC-expa for each patient (n = 4). (C) Highly expanded clonotype (TCR ≥5) distribution in cell types in PF. (D) Shared expanded clonotypes in PF-enrich CD4 and CD8 subsets between PF and blood. (E) Developmental transition of PF CD4_C08 cells with other PF-infiltrating CD4 cells quantified by pSTARTRAC-tran indices for each patient (n = 4). (F) Developmental transition of PF CD8_C03 cells with other PF-infiltrating CD8 cells quantified by pSTARTRAC-tran indices for each patient (n = 4).
Figure 5.
Figure 5.
Gene expression characterization associated with PF-infiltrating T cells. (A) Volcano plot showing DEGs in PF CD4_C09 versus other CD4 T cells (n = 4). Each red dot denotes an individual gene passing P value (val) and fold-difference (P < 0.01; average fold-change >1.5) thresholds. (B) GO analysis of genes positively expressed in PF CD4_C09. (C) Volcano plot showing DEGs in PF CD4_C08 versus other CD4 T cells (n = 4). Each red dot denotes an individual gene passing P value and fold-difference thresholds. (D) GO analysis of genes positively expressed in PF CD4_C08. (E) Gating strategy for GZMK+GZMA+ CD4 T cells by flow cytometry. (F) The frequency of GZMK+GZMA+ CD4 T cells in paired PBMCs and PFMCs from TPE patients (n = 22). A paired t test was used to analyze differences in paired samples; ****, P < 0.0001. (G–J) Volcano plot showing DEGs in CD8_C03 (G), CD8_C05 (H), CD8_C06 (I), and GZMK-expressing CD8 (J). Each red or blue dot denotes an individual gene passing P value and fold-difference thresholds (P < 0.01; average fold-change >1.5).
Figure 6.
Figure 6.
GZMK is produced in PF of TPE patients and is inducible in CD8 T cells upon activation in vitro. (A) Gating strategy of GZMK+ or GZMB+ CD8 T cells by flow cytometry. FSC, forward scatter. (B) The frequency of GZMK+ CD8 or GZMB+ CD8 T cells in paired PBMCs and PFMCs from TPE patients (n = 22). A paired t test was used to analyze differences in paired samples; ****, P < 0.0001. (C) The level of GZMK protein expression in paired plasma and PF samples (n = 12); A paired t test was used to analyze differences in paired samples; ****, P < 0.0001. (D) The level of ADA in the PF from TPE, PPE, MPE, and non-TPE patients. Left: Cohort III (TPE, n = 98; PPE n = 36; and MPE n = 31). Right: Cohort IV (TPE, n = 88; and non-TPE, n = 73); One-way ANOVA Newman–Keuls multiple comparison test was used to compare differences among multiple groups; ****, P < 0.0001; unpaired t test was used to analyze differences between two groups; ****, P < 0.0001. (E) The level of ADA in the PF from TPE, PPE, MPE, and non-TPE patients. Left: Cohort III. Right: Cohort IV. One-way ANOVA Newman–Keuls multiple comparison test was used to compare differences among multiple groups; ****, P < 0.0001; unpaired t test was used to analyze differences between two groups; **, P < 0.01. (F) The level of GZMK protein in the PF from TPE, PPE, and MPE patients in cohort III. (G) The level of GZMK protein in the PF from TPE and non-MPE patients in cohort IV. One-way ANOVA Newman–Keuls multiple comparison test was used to compare differences among multiple groups; ****, P < 0.0001; unpaired t test was used to analyze differences between two groups; ****, P < 0.0001. (H) Receiver operater characteristic curve for GZMK to separate TPE from non-TPE in cohort III. (I) Receiver operater characteristic curve for GZMK to separate TPE from non-TPE in cohort IV. (J) The level of GZMK protein in CD8 from PFMCs (n = 4) with or without anti-CD3/CD28 stimulation; unpaired t test was used to analyze differences between two groups; *, P < 0.05. (K) The cytotoxicity of GZMK and GZMB with or without perforin in THP-1–derived macrophages. Purified GZMK (10 µg/ml) and GZMB (10 µg/ml) with or without Perforin 1 were added to THP-1–derived macrophages. Cytotoxicity was determined by WST-1 assays; one-way ANOVA Newman–Keuls multiple comparison test was used to compare differences among multiple groups; ns, P > 0.05. (L) The bactericidal activity of GZMK and GZMB in Mtb-infected THP-1–derived macrophages. Purified GZMK (10 µg/ml) and GZMB (10 µg/ml) with or without perforin 1 were added to Mtb-infected macrophages. CFUs were determined in 24 h. The experiments were replicated three times. One-way ANOVA Newman–Keuls multiple comparison test was used to compare differences among multiple groups; **, P < 0.01. The data represent means ± SEM.

References

    1. Appay, V., Zaunders J.J., Papagno L., Sutton J., Jaramillo A., Waters A., Easterbrook P., Grey P., Smith D., McMichael A.J., et al. . 2002. Characterization of CD4(+) CTLs ex vivo. J. Immunol. 168:5954–5958. 10.4049/jimmunol.168.11.5954 - DOI - PubMed
    1. Berry, M.P., Graham C.M., McNab F.W., Xu Z., Bloch S.A., Oni T., Wilkinson K.A., Banchereau R., Skinner J., Wilkinson R.J., et al. . 2010. An interferon-inducible neutrophil-driven blood transcriptional signature in human tuberculosis. Nature. 466:973–977. 10.1038/nature09247 - DOI - PMC - PubMed
    1. Bhatt, D., Kang B., Sawant D., Zheng L., Perez K., Huang Z., Sekirov L., Wolak D., Huang J.Y., Liu X., et al. . 2021. STARTRAC analyses of scRNAseq data from tumor models reveal T cell dynamics and therapeutic targets. J. Exp. Med. 218:e20201329. 10.1084/jem.20201329 - DOI - PMC - PubMed
    1. Bold, T.D., and Ernst J.D.. 2012. CD4+ T cell-dependent IFN-γ production by CD8+ effector T cells in Mycobacterium tuberculosis infection. J. Immunol. 189:2530–2536. 10.4049/jimmunol.1200994 - DOI - PMC - PubMed
    1. Brown, D.M., Dilzer A.M., Meents D.L., and Swain S.L.. 2006. CD4 T cell-mediated protection from lethal influenza: perforin and antibody-mediated mechanisms give a one-two punch. J. Immunol. 177:2888–2898. 10.4049/jimmunol.177.5.2888 - DOI - PubMed

Publication types

MeSH terms