. 2022 Apr 26;145(17):1339-1355.
doi: 10.1161/CIRCULATIONAHA.121.057641. Epub 2022 Jan 21.

Transient Cell Cycle Induction in Cardiomyocytes to Treat Subacute Ischemic Heart Failure

Affiliations

Transient Cell Cycle Induction in Cardiomyocytes to Treat Subacute Ischemic Heart Failure

Riham R E Abouleisa et al. Circulation. .

Abstract

Background: The regenerative capacity of the heart after myocardial infarction is limited. Our previous study showed that ectopic introduction of 4 cell cycle factors (4F; CDK1 [cyclin-dependent kinase 1], CDK4 [cyclin-dependent kinase 4], CCNB [cyclin B1], and CCND [cyclin D1]) promotes cardiomyocyte proliferation in 15% to 20% of infected cardiomyocytes in vitro and in vivo and improves cardiac function after myocardial infarction in mice.

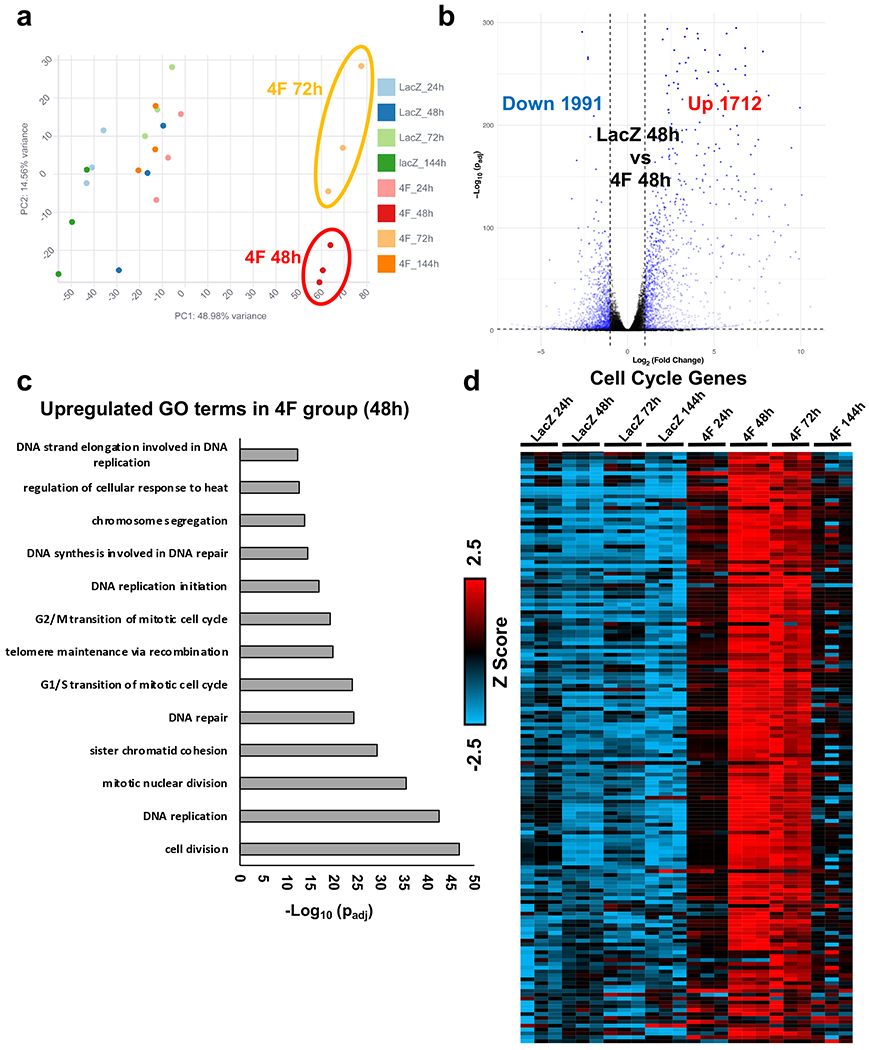
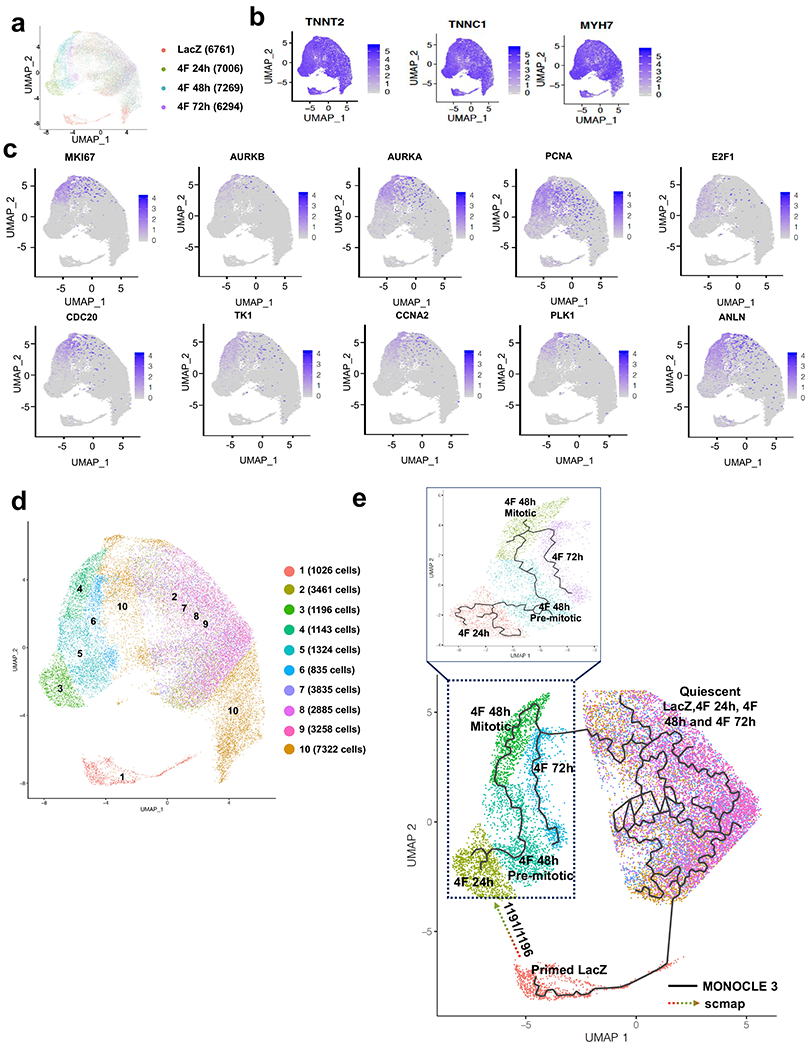
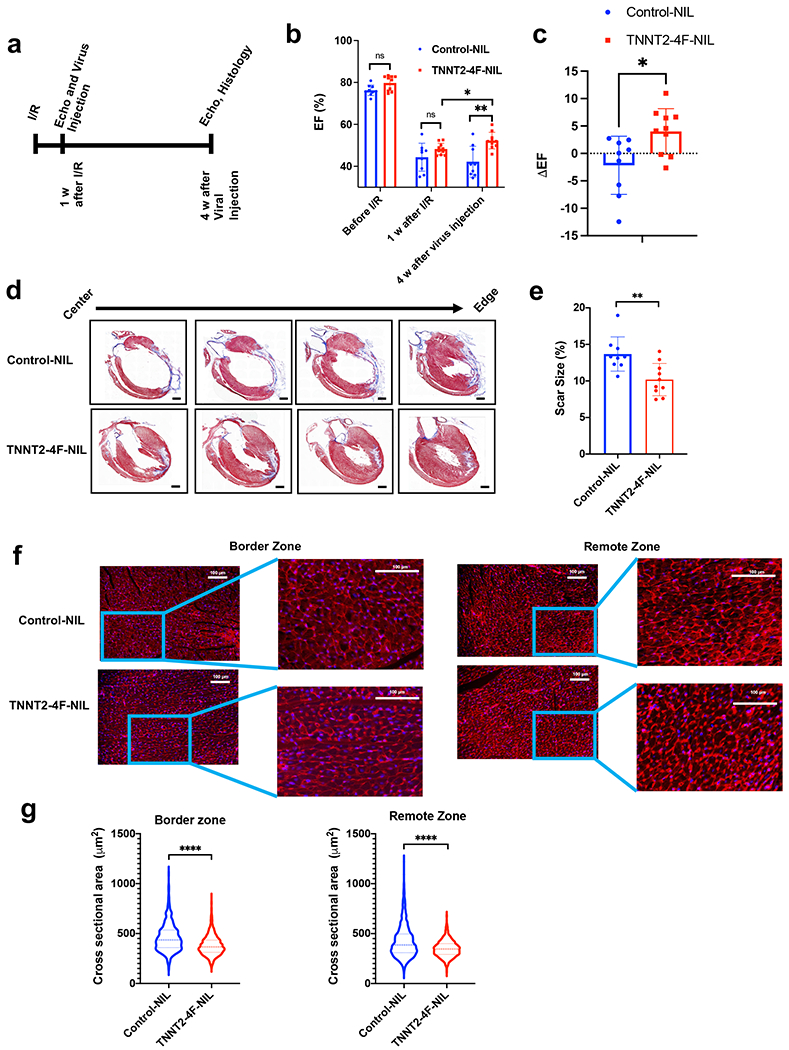
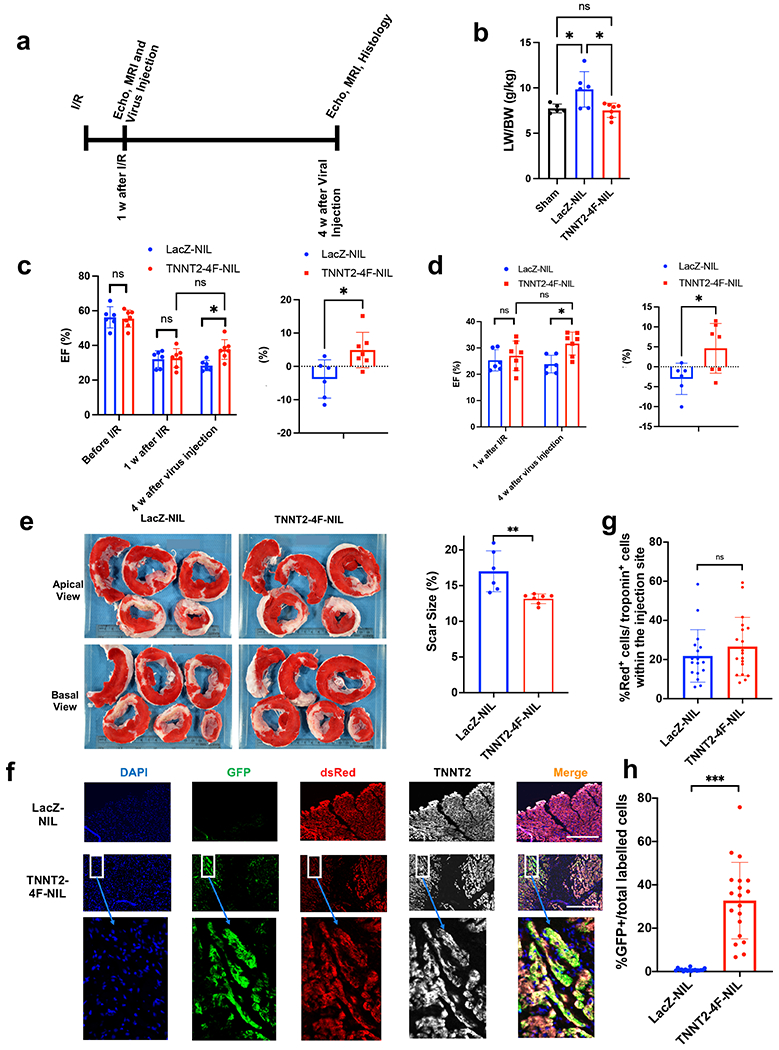
Methods: Using temporal single-cell RNA sequencing, we aimed to identify the necessary reprogramming stages during the forced cardiomyocyte proliferation with 4F on a single cell basis. Using rat and pig models of ischemic heart failure, we aimed to start the first preclinical testing to introduce 4F gene therapy as a candidate for the treatment of ischemia-induced heart failure.

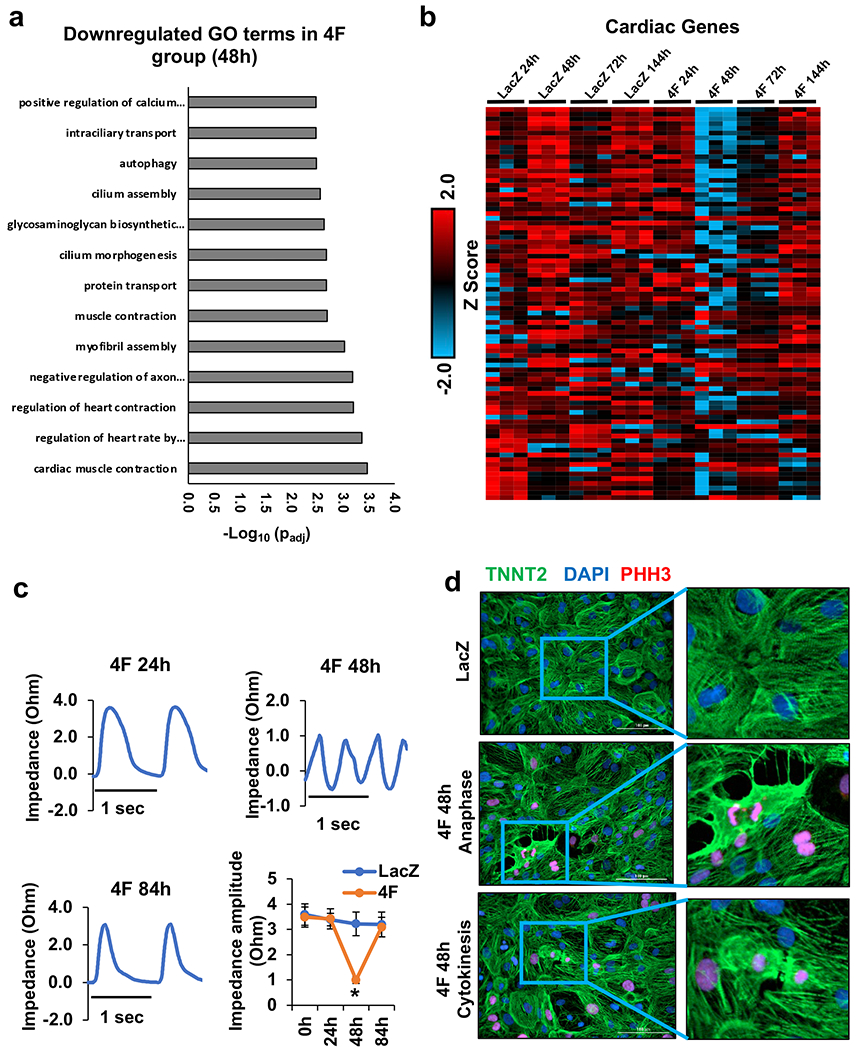
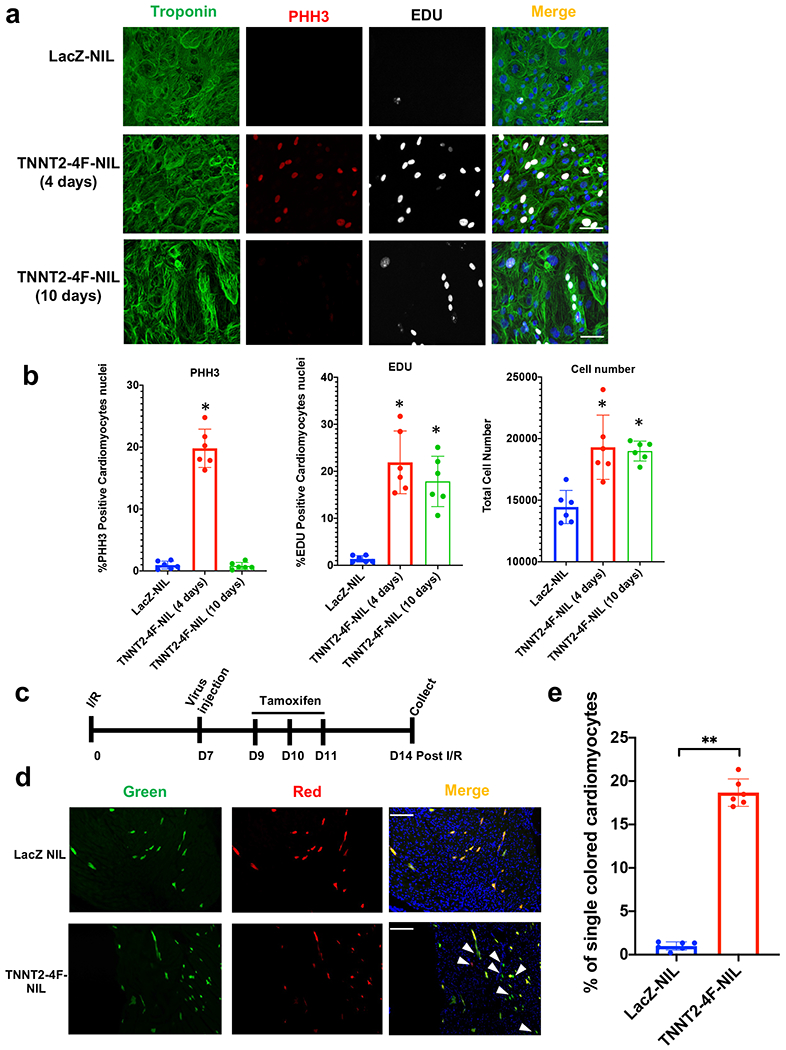
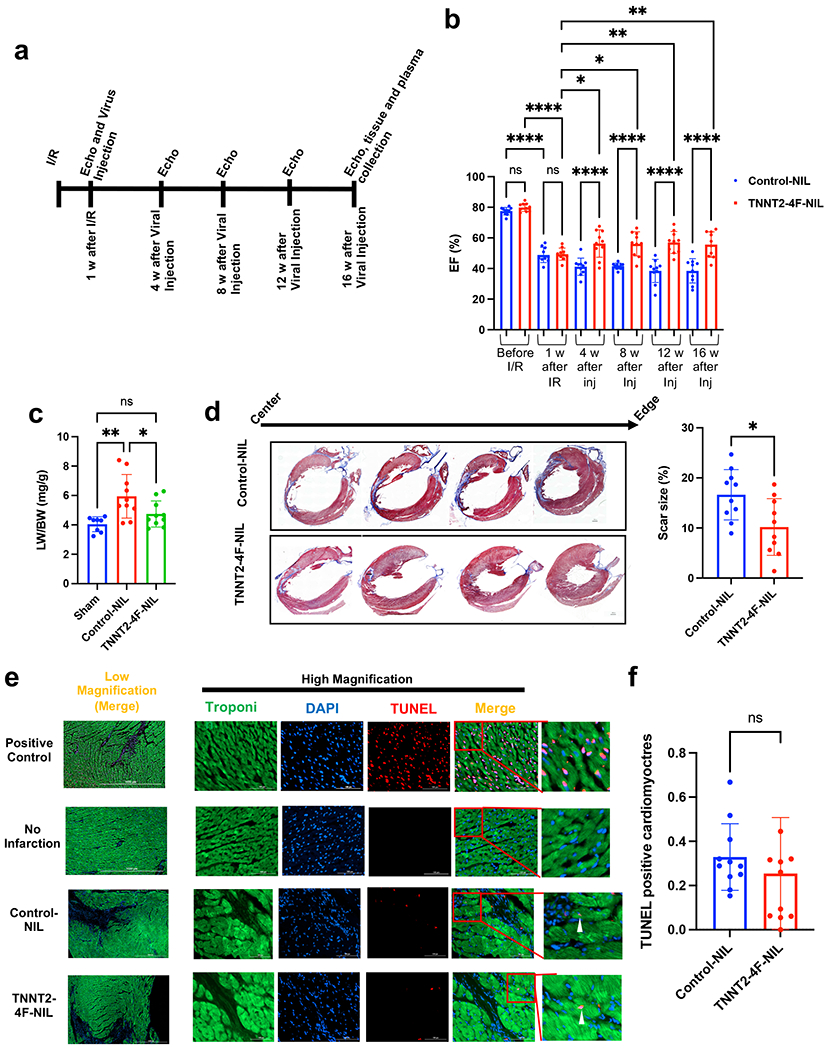
Results: Temporal bulk and single-cell RNA sequencing and further biochemical validations of mature human induced pluripotent stem cell-derived cardiomyocytes treated with either LacZ or 4F adenoviruses revealed full cell cycle reprogramming in 15% of the cardiomyocyte population at 48 hours after infection with 4F, which was associated mainly with sarcomere disassembly and metabolic reprogramming (n=3/time point/group). Transient overexpression of 4F, specifically in cardiomyocytes, was achieved using a polycistronic nonintegrating lentivirus (NIL) encoding 4F; each is driven by a TNNT2 (cardiac troponin T isoform 2) promoter (TNNT2-4Fpolycistronic-NIL). TNNT2-4Fpolycistronic-NIL or control virus was injected intramyocardially 1 week after myocardial infarction in rats (n=10/group) or pigs (n=6-7/group). Four weeks after injection, TNNT2-4Fpolycistronic-NIL-treated animals showed significant improvement in left ventricular ejection fraction and scar size compared with the control virus-treated animals. At 4 months after treatment, rats that received TNNT2-4Fpolycistronic-NIL still showed a sustained improvement in cardiac function and no obvious development of cardiac arrhythmias or systemic tumorigenesis (n=10/group).

Conclusions: This study provides mechanistic insights into the process of forced cardiomyocyte proliferation and advances the clinical feasibility of this approach by minimizing the oncogenic potential of the cell cycle factors owing to the use of a novel transient and cardiomyocyte-specific viral construct.

Keywords: cardiomyopathies; cell cycle; genetic therapy; heart failure; metabolism; sarcomeres.


Conflict of interest statement

Conflict of Interest Disclosures

R.R.E.A.: None. A.M.S.: None. Q.O.: None. X-L.T.: None. M.S.: None. K.M.K.: None. Y.G.: None. Y.H.: None. Y.N.: None. L.M.: None. P.K.L.: None. B.G.H.: None. K.C.: None. R.T.: None. B.M.A.: None. J.S.: None. H.R.J.: None. A.S.: None. Z.I.: None. S.H.: None. D.J.C.: None. A.S.E.: None. K.N.I: Holds equities at Tenaya Therapeutics. D.S.: Holds equities at Tenaya Therapeutics. R.B.: None. T.M.A.M.: Holds equities at Tenaya Therapeutics.

Figures

Fig. 1.
Fig. 1.. 4F overexpression induces cell cycle reprogramming in hiPS-CMs.
(a) Principal component analysis (PCA) of RNA-seq data from mature hiPS-CMs (60 day old) infected with either LacZ (control) or 4F for 24, 48, 72 or 144 h (n = 3). (b) Volcano plot demonstrating the number of genes that are significantly upregulated or downregulated 48 h post-4F adenovirus overexpression compared to the LacZ group (padj<0.05). (c) The bar graph shows the top GO terms for the significantly upregulated genes from RNA-seq data comparing hiPS-CMs infected with either LacZ or 4F for 48 h (padj<0.05). The GO terms reflect mostly upregulation of cell cycle genes. (d) Row normalized Z score heatmap shows a temporal expression of over 200 genes related to the cell cycle (n=3 in each sample). Source data 1 lists FPKM values for all RNAseq data and for the heart maps. Source data 2 contains the full list of the GO terms and the genes included in each GO term.
Fig. 2.
Fig. 2.. Overexpression of 4F for 48 h induces sarcomere disassembly in hiPS-CMs.
(a) The bar graph shows the top GO terms for the significantly downregulated genes from RNA-seq data comparing gene expression between the hiPS-CMs infected with either LacZ or 4F for 48 h (padj<0.05). The GO terms reflect the downregulation of cardiac contractile and sarcomeric genes. (b) Row normalized Z score heatmap shows the contractile and sarcomeric gene expression in a time-dependent manner following 4F expression (n=3 in each sample). Source data 1 lists FPKM values for all RNAseq data and for the heart maps. Source data 2 contains the full list of the GO terms and the genes included in each GO term. (c) Representative traces of impedance recording for contractile function from hiPS-CMs at 24, 48, and 84 h after infection with 4F. The bottom right panel shows the quantification of the contractile force amplitude comparing LacZ- and 4F-treated hiPS-CMs, 24, 48, and 84 h post-infection (n=3 independent experiments each in triplicate, *p<0.05 compared to LacZ treated cells). (d) representative images of sarcomere disassembly during G2/M phase in hiPS-CMs infected with lacZ (top panel), or 4F adenovirus for 48 h (middle (anaphase example) and bottom (cytokinesis example) panels) and stained with antibodies against the sarcomeric protein (troponin-T) (green), G2/M phase marker (PHH3) (red), and nuclear DAPI (blue).
Fig. 3.
Fig. 3.. Single-cell RNAseq identifies a unique mitotic subpopulation that appears at 48h post-infection with 4F.
(a) UMAP plots considering global gene expression for all single cardiomyocytes sequenced from LacZ (control group) and 4F-overexpressing cardiomyocytes at 24, 48 h, or 72 h after viral transduction (approximately 7000 cells/sample). (b) All cells show high expression of the cardiac markers, TNNT2, TNNC1, and MYH7, indicating the cardiomyocytes’ purity. (c) A unique cell population appears only at 48 h post-infection with 4F, which express mitotic/cytokinesis genes; this population was identified as the mitotic population that expresses high levels of the G2/M markers (Ki67, Aurora Kinase A and B, PCNA, E2F1, CDC20, TK1, CCNA2, PLK1, and ANLN). (d) re-clustering the cells according to their expression of the mitotic genes and location of the subpopulation of cells associated with a given time-point in the UMAP space. Consistent with our published data, the mitotic population represents ~15% of the total cardiomyocyte population within the 48 h sample. (e) Trajectory analysis using MONOCLE (solid line) and scmap (dotted arrow) algorithms to predict the pseudo time trajectory of each unique population at each time point.
Fig. 4.
Fig. 4.. Transient expression of the 4F using non-integrating lentivirus (NIL) is efficient in inducing cardiomyocyte proliferation in vitro and in vivo.
(a) Representative images of hiPS-CMs treated with LacZ-NIL, TNNT2-4Fpolycistronic-NIL for 4 or 10 days, and immuno-stained for troponin-T (green), PHH3 (red), EDU (gray) (scale bar=100μm). (b) Quantification of percentage increase in proliferation markers (PHH3 and EDU) and total cell number/well (n=6 independent experiments conducted in duplicate, *P<0.05 vs. LacZ NIL, error bars indicate S.D.). (c) Schematic diagram of the experimental design for MADM mice injection with the TNNT2-4Fpolycistronic-NIL or LacZ-NIL control. (d) Representative images show single-colored cardiomyocytes of MADM mice hearts treated with LacZ-NIL or TNNT2-4F-polycistronic-NIL (Scale bar=100μm). (e) Quantification of the percentage of the single-colored cells to the total labeled cells (n=6 animals per group, **p<0.01 vs. LacZ NIL, error bars indicate S.D.).
Fig. 5.
Fig. 5.. Transient expression of the 4F using TNNT2-4Fpolycistronic-NIL improves cardiac function and reduces scar size in rats after I/R.
(a) schematic diagram of the experimental design. (b) Ejection fraction (EF), as assessed by echocardiography before Ischemia/reperfusion (I/R), one week after I/R (before viral treatment), and four weeks after viral treatment. (n=9-10 rats per group, *p<0.05, **p<0.01 compared to GFP-NIL control group, error bars indicate S.D.). (c) Quantification of the change in ejection fraction between before and after treatment for each individual rat (n=9-10 rats per group, *p<0.05, compared to GFP-NIL control group, error bars indicate S.D.). (d) Representative images of rat hearts were stained with Masson’s trichrome stain (healthy myocardium stains red and fibrotic tissue stains blue) at the end of the experiment (scale bar=2mm). (e) The scar size quantification as a percentage of total heart tissue (n=9-10 rats per group, 20-25 heart sections per animal, **p<0.01 compared to the control group, error bars indicate S.D.). (f) Representative images of rat heart at the border zone (right panel) or a remote zone (left panel) stained against wheat germ agglutinin, WGA (red), and nuclear DAPI (blue) (scale bar=100 µm). (g) Quantification of the cross-sectional area of cardiomyocytes at border zone (left) or a remote zone (right) (n=1300-1500 cells from each group, 20-25 heart sections per animal ****p<0.0001 compared to control group, error bars indicate S.D.).
Fig. 6.
Fig. 6.. Transient expression of the 4F using TNNT2-4Fpolycistronic-NIL improves cardiac function, reduces scar size, and induces cardiomyocyte proliferation in a porcine model of heart failure.
(a) schematic diagram of the experimental design. (b) Quantification of lung weight/body weight ratio (LW/BW). (n=5-7 pigs per group, *p<0.05 vs. control LacZ group, error bars indicate S.D.) (c) Quantification of ejection fraction (EF) as assessed by echocardiography (left panel) before Ischemia/reperfusion (I/R), one week after I/R (before viral treatment), and four weeks after viral treatment. The right panel shows the change in ejection fraction for each pig between before and after the viral injection (n=6-7 pigs per group, *p<0.05 vs. control LacZ group, error bars indicate S.D.). (d) Quantification of ejection fraction (EF) (left panel) and individual changes in EF before and after treatment (right panel) as assessed by MRI 1 week after I/R (before viral treatment) and four weeks after viral treatment (n=6-7 pigs per group, *p<0.05 vs. control LacZ group, error bars indicate S.D.). (e) Left panel, representative images of pig hearts stained with triphenyl tetrazolium chloride (T.T.C.) (healthy myocardium stains red and fibrotic tissue remains white) at the end of the experiment (scale bar in cm). Right panel, quantification of scar size as a percentage of total heart tissue (n=6-7 pigs per group, **p<0.01 vs. control LacZ group, error bars indicate S.D.). (f) Representative images at the site of injection four weeks post-injection in porcine myocardium. LacZ (top panel) or 4F (bottom panel) shows the expression of the proliferation double reporter system GFP and dsRed and their co-localization with cardiomyocytes (TNNT2). (g) Quantification of the percentage of dsRed positive cardiomyocytes at the injection site and (h) percentage of GFP positive cardiomyocytes over the total labeled cardiomyocytes (n=6-7 pigs per group, 3-4 sections from different injection sites ***p<0.001 vs. control LacZ group, error bars indicate S.D.).
Fig. 7.
Fig. 7.. TNNT2-4Fpolycistronic-NIL maintained improvement in cardiac function for four months.
(a) schematic diagram of the experimental design. (b) Ejection fraction (EF), as assessed by echocardiography before ischemia/reperfusion (I/R), one week after I/R (before viral treatment), and every four weeks after viral treatment up to 16 weeks. (n=10 rats per group, *p<0.05, **p<0.01, ****p<0.0001, compared to GFP-NIL control group, error bars indicate the S.D.). (c) Quantification of the lung weight/body weight (LW/BW) (n=8-10 rats per group, *p<0.05, compared to GFP-NIL control group). (d) Representative images of rat hearts were stained with Masson’s trichrome stain (left panel) (healthy myocardium stains red and fibrotic tissue stains blue) at the end of the experiment (scale bar=2mm). The right panel shows scar size quantification as a percentage of total heart tissue (n=10 rats per group, 20-25 heart sections per animal, **p<0.01 compared to the control group, error bars indicate S.D.). (e) Representative images of rat hearts at the border zone stained for apoptotic nuclei using TUNEL assay (red), Troponin-T (green), and nuclear DAPI (blue) (scale bar=1000 µm in the low magnification images and 100 µm in the high magnification images). Positive control was carried out by treating the non-infarct heart section with the DNase-I enzyme. (f) Quantification of the percentage of TUNEL positive cardiomyocytes (n=10 heart sections per animal and 10 animals in each group, error bars indicate S.D.).

Comment in

References

    1. Hydbring P, Malumbres M and Sicinski P. Non-canonical functions of cell cycle cyclins and cyclin-dependent kinases. Nat Rev Mol Cell Biol. 2016;17:280–92. - PMC - PubMed
    1. Malumbres M and Barbacid M. Cell cycle, CDKs and cancer: a changing paradigm. Nat Rev Cancer. 2009;9:153–66. - PubMed
    1. Li VC and Kirschner MW. Molecular ties between the cell cycle and differentiation in embryonic stem cells. Proc Natl Acad Sci U S A. 2014;111:9503–8. - PMC - PubMed
    1. Mohamed TMA, Ang YS, Radzinsky E, Zhou P, Huang Y, Elfenbein A, Foley A, Magnitsky S and Srivastava D. Regulation of Cell Cycle to Stimulate Adult Cardiomyocyte Proliferation and Cardiac Regeneration. Cell. 2018;173:104–116 e12. - PMC - PubMed
    1. Zong H, Espinosa JS, Su HH, Muzumdar MD and Luo L. Mosaic analysis with double markers in mice. Cell. 2005;121:479–92. - PubMed

Publication types