. 2022 Jan 21;17(1):e0262047.
doi: 10.1371/journal.pone.0262047. eCollection 2022.

A Bayesian approach to combining multiple information sources: Estimating and forecasting childhood obesity in Thailand

Affiliations

A Bayesian approach to combining multiple information sources: Estimating and forecasting childhood obesity in Thailand

John Bryant et al. PLoS One. .

Abstract

We estimate and forecast childhood obesity by age, sex, region, and urban-rural residence in Thailand, using a Bayesian approach to combining multiple source of information. Our main sources of information are survey data and administrative data, but we also make use of informative prior distributions based on international estimates of obesity trends and on expectations about smoothness. Although the final model is complex, the difficulty of building and understanding the model is reduced by the fact that it is composed of many smaller submodels. For instance, the submodel describing trends in prevalences is specified separately from the submodels describing errors in the data sources. None of our Thai data sources has more than 7 time points. However, by combining multiple data sources, we are able to fit relatively complicated time series models. Our results suggest that obesity prevalence has recently starting rising quickly among Thai teenagers throughout the country, but has been stable among children under 5 years old.


Conflict of interest statement

The authors have declared that no competing interests exist.

Figures

Fig 1
Fig 1. Direct estimates of national-level obesity prevalence by age, sex, and year from the NHES, HDTC, and schools data.
The dots represent point estimates from the NHES, and the x’s represent point estimates from the HDTC; the vertical lines represent the associated 95% confidence intervals. The HDTC data does not distinguish females and males, so the figure shows estimates for both sexes combined. The lines for the period 2013–2019 are prevalence estimates from schools data.
Fig 2
Fig 2. Direct estimates of obesity prevalence by age, region, and urban-rural residence for females, based on schools data.
Fig 3
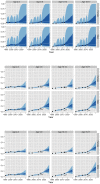
Fig 3. Estimates and forecasts of national obesity prevalence from three models.
The top panel shows results for Model 1 using NHES data only, the middle panel shows results for Model 2 using NHES, HDTC, and schools data, and the bottom panel shows results for Model 3 with NHES, HDTC, and schools data plus WHO-based prior distributions for time terms. The light bands represent 95% credible intervals, the dark bands represent 50% credible intervals, and the white lines represent medians. The black symbols represent direct estimates from Fig 1. The vertical axis for the top panel extends from 0 to 1, while the vertical axes for the other panels extend from 0 to 0.7.
Fig 4
Fig 4. The structure of our first and second models.
Our first model, on the left, allows for a single data source with sampling errors but not measurement errors. Our second model, on the right, allows for multiple data sources, all with sampling and measurement errors. Observed quantities are shaded gray; everything else is unobserved, and must be inferred.
Fig 5
Fig 5. Estimates and forecasts of obesity prevalence for females in urban areas, from models 4 and 5.
The top panel shows results from our first subnational model (Model 4), and the bottom panel shows results from our revised model (Model 5). The light bands represent 95% credible intervals, the dark bands represent 50% credible intervals, and the white lines represent medians. The black symbols represent direct school-based estimates from Fig 2.
Fig 6
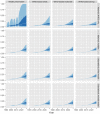
Fig 6. Comparison of national-level estimates and forecasts of obesity prevalence from different combinations of model type and priors for variance terms in time main effects and interactions.
The estimates and forecasts aggregate over age, sex, region, and urban-rural residence. Each row of panels represents one model type, and each column represents one prior.
Fig 7
Fig 7. Using replicate datasets to assess the ability of the model to capture geographical variability in rates of change for obesity.
Each columns shows results from one dataset. Each dot represents the slope from a regression of numbers of obese children against time. The figure shows results for females only.

References

    1. Tatem AJ. WorldPop, open data for spatial demography. Scientific data. Nature Publishing Group; 2017;4: 1–4. doi: 10.1038/sdata.2017.4 - DOI - PMC - PubMed
    1. Murray CJ, Abbafati C, Abbas KM, Abbasi M, Abbasi-Kangevari M, Abd-Allah F, et al.. Five insights from the Global Burden of Disease Study 2019. The Lancet. Elsevier; 2020;396: 1135–1159. doi: 10.1016/S0140-6736(20)31404-5 - DOI - PMC - PubMed
    1. Hand DJ. Statistical challenges of administrative and transaction data. Journal of the Royal Statistical Society: Series A (Statistics in Society). 2018;181: 555–605. doi: 10.1111/rssa.12315 - DOI
    1. Gregory IN, Marti-Henneberg J, Tapiador FJ. Modelling long-term pan-European population change from 1870 to 2000 by using geographical information systems. Journal of the Royal Statistical Society: Series A (Statistics in Society). 2010;173: 31–50. doi: 10.1111/j.1467-985X.2009.00598.x - DOI
    1. Hyndman RJ, Athanasopoulos G. Forecasting: Principles and practice. Third edition [Internet]. OTexts; 2021. Available: https://otexts.com/fpp3/