. 2022 May 5;139(18):2758-2769.
doi: 10.1182/blood.2021014255.

Early intestinal microbial features are associated with CD4 T-cell recovery after allogeneic hematopoietic transplant

Affiliations

Early intestinal microbial features are associated with CD4 T-cell recovery after allogeneic hematopoietic transplant

Oriana Miltiadous et al. Blood. .

Abstract

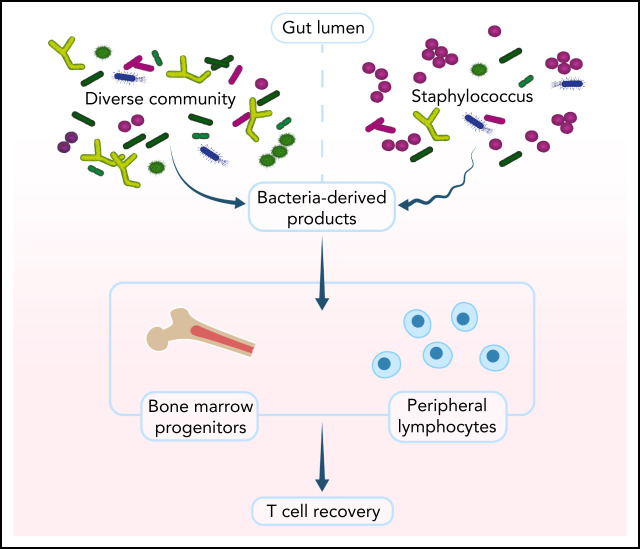
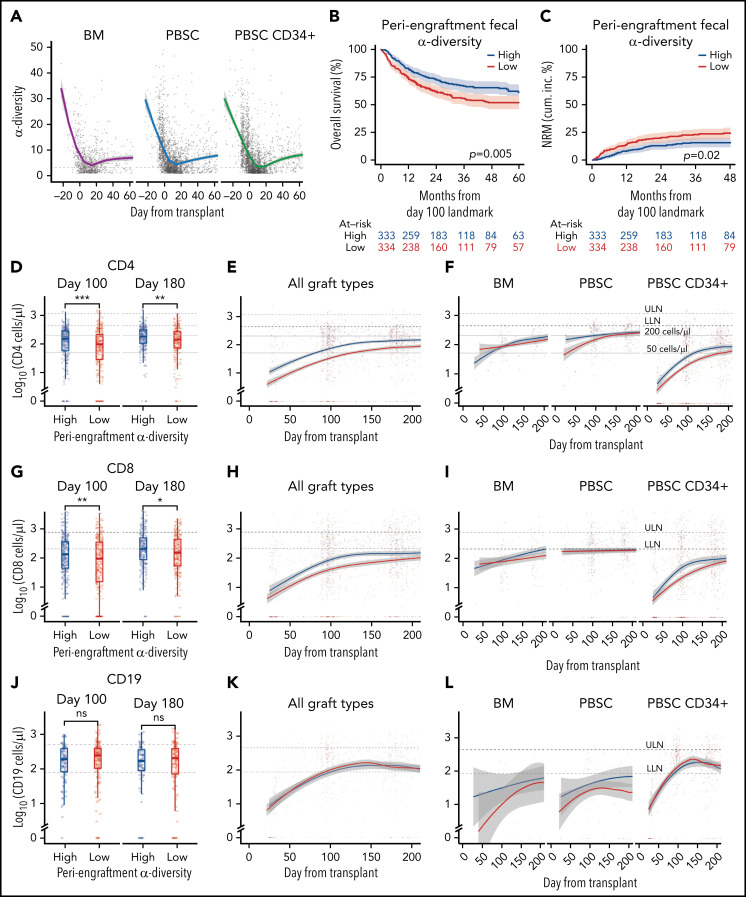
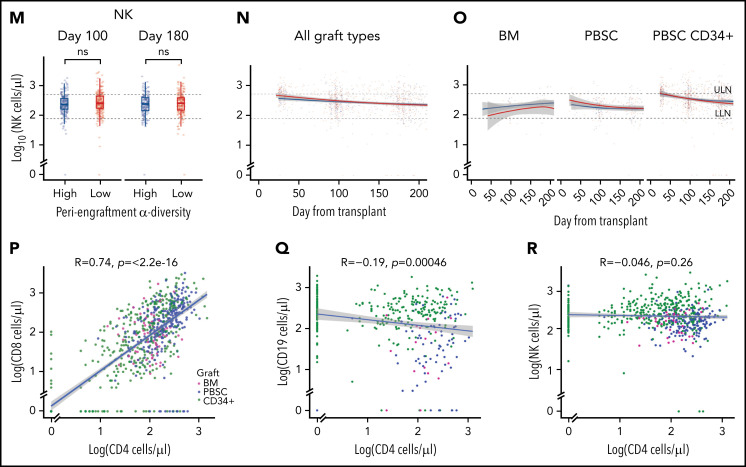
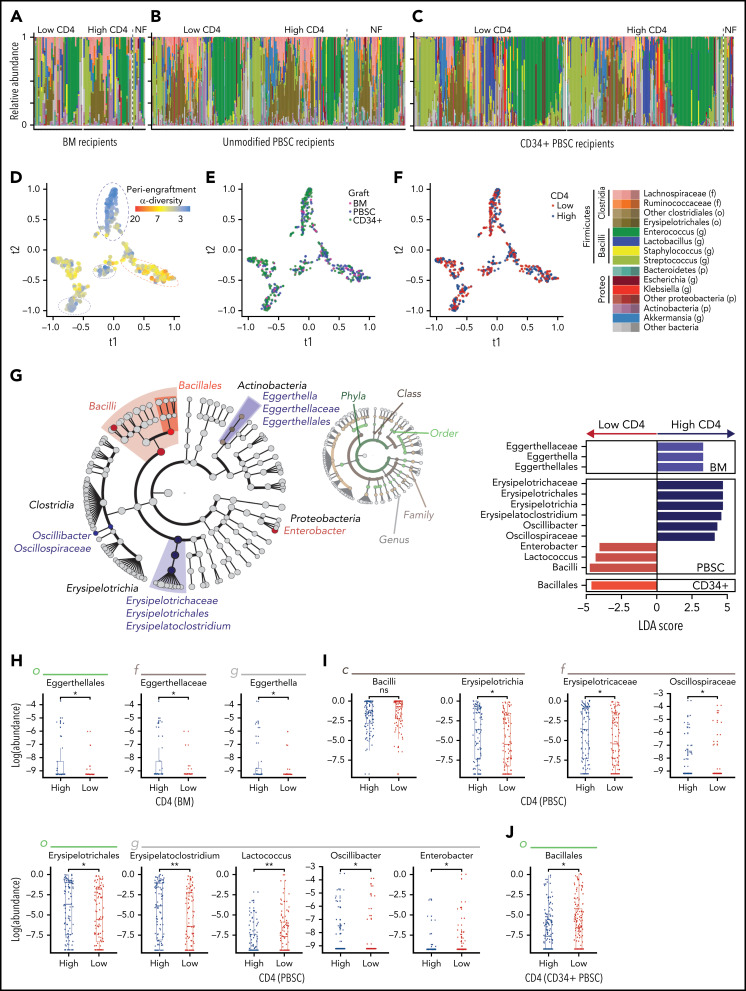
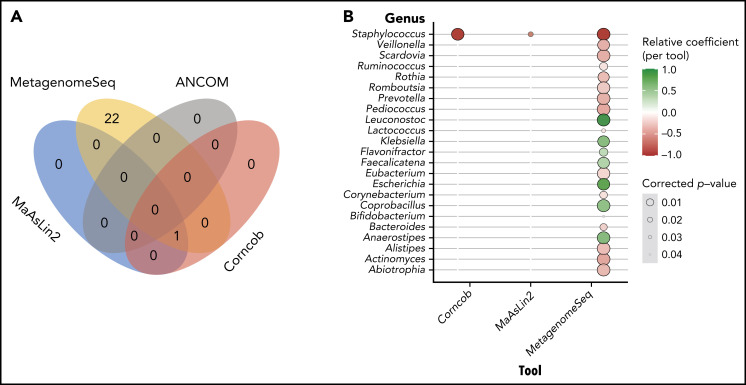
Low intestinal microbial diversity is associated with poor outcomes after allogeneic hematopoietic cell transplantation (HCT). Using 16S rRNA sequencing of 2067 stool samples and flow cytometry data from 2370 peripheral blood samples drawn from 894 patients who underwent allogeneic HCT, we have linked features of the early post-HCT microbiome with subsequent immune cell recovery. We examined lymphocyte recovery and microbiota features in recipients of both unmodified and CD34-selected allografts. We observed that fecal microbial diversity was an independent predictor of CD4 T-cell count 3 months after HCT in recipients of a CD34-selected allograft, who are dependent on de novo lymphopoiesis for their immune recovery. In multivariate models using clinical factors and microbiota features, we consistently observed that increased fecal relative abundance of genus Staphylococcus during the early posttransplant period was associated with worse CD4 T-cell recovery. Our observations suggest that the intestinal bacteria, or the factors they produce, can affect early lymphopoiesis and the homeostasis of allograft-derived T cells after transplantation.


Figures

None
Graphical abstract
Figure 1.
Figure 1.
Intestinal microbial α-diversity is associated with immune reconstitution patterns after allo-HCT. (A) Stool α-diversity over time (n = 868; BM, 85; PBSCs, 347; CD34+ PBSCs, 436). The median periengraftment (days 7-21 after HCT) α-diversity is shown with the dotted horizontal line at 3.28. OS (B) and NRM (C) cumulative incidence in patients with high and low periengraftment α-diversity. (D) CD4 counts at days 100 and 180 post-HCT in patients with above- and below-median periengraftment α-diversity (n = 633 patients; BM, 71; PBSCs, 245; CD34+ PBSCs, 317). CD4 counts over time in all graft recipients (E) and separated by graft type (F) (n = 645 patients; BM, 73; PBSCs, 250; CD34+ PBSCs, 322). (G-I) CD8 T-cell counts. (D-F) The lower limit of normal (LLN) = 429 cells per microliter, and the upper limit of normal (ULN) = 1331 cells per microliter. (G) CD8 T-cell counts at days 100 and 180 post-HCT in patients with low and high periengraftment α-diversity (n = 633 patients; BM, 71; PBSCs, 245; CD34+ PBSCs, 317). CD8 counts over time in all graft recipients (H) and separated by graft type (I) (n = 645 patients; BM, 73; PBSCs, 250; CD34+ PBSCs, 322). (G-I) LLN = 209 cells per microliter and ULN = 768 cells per microliter. (J) CD19 counts at days 100 and 180 post-HCT in patients with low and high periengraftment α-diversity (n = 272; BM, 19; PBSCs, 67; CD34+ PBSCs, 186). CD19 counts over time in all graft recipients (H) and separated by graft type (I) (n = 314 patients; BM, 23; PBSCs, 85; CD34+ PBSCs, 206). (J-L) LLN = 78 cells per microliter and ULN = 510 cells per microliter. (M) NK counts at days 100 and 180 post-HCT in patients with low and high periengraftment α-diversity (n = 479; BM, 43; PBSCs, 165; CD34+ PBSCs,: 271). NK counts over time in all graft recipients (N) and separated by graft type (O) (n = 492; BM, 45; PBSCs, 171; CD34+ PBSCs, 276). (M-O) LLN = 78 and ULN = 510 cells per microliter. (P-R) Correlations of CD4 count with CD8 T-cell count (P), CD19+ B-cell count (Q), and NK-cell count (R). R represents the Pearson correlation coefficient. Statistical comparison for (D,G,J,M) was performed with the Wilcoxon rank-sum test.
Figure 1.
Figure 1.
Intestinal microbial α-diversity is associated with immune reconstitution patterns after allo-HCT. (A) Stool α-diversity over time (n = 868; BM, 85; PBSCs, 347; CD34+ PBSCs, 436). The median periengraftment (days 7-21 after HCT) α-diversity is shown with the dotted horizontal line at 3.28. OS (B) and NRM (C) cumulative incidence in patients with high and low periengraftment α-diversity. (D) CD4 counts at days 100 and 180 post-HCT in patients with above- and below-median periengraftment α-diversity (n = 633 patients; BM, 71; PBSCs, 245; CD34+ PBSCs, 317). CD4 counts over time in all graft recipients (E) and separated by graft type (F) (n = 645 patients; BM, 73; PBSCs, 250; CD34+ PBSCs, 322). (G-I) CD8 T-cell counts. (D-F) The lower limit of normal (LLN) = 429 cells per microliter, and the upper limit of normal (ULN) = 1331 cells per microliter. (G) CD8 T-cell counts at days 100 and 180 post-HCT in patients with low and high periengraftment α-diversity (n = 633 patients; BM, 71; PBSCs, 245; CD34+ PBSCs, 317). CD8 counts over time in all graft recipients (H) and separated by graft type (I) (n = 645 patients; BM, 73; PBSCs, 250; CD34+ PBSCs, 322). (G-I) LLN = 209 cells per microliter and ULN = 768 cells per microliter. (J) CD19 counts at days 100 and 180 post-HCT in patients with low and high periengraftment α-diversity (n = 272; BM, 19; PBSCs, 67; CD34+ PBSCs, 186). CD19 counts over time in all graft recipients (H) and separated by graft type (I) (n = 314 patients; BM, 23; PBSCs, 85; CD34+ PBSCs, 206). (J-L) LLN = 78 cells per microliter and ULN = 510 cells per microliter. (M) NK counts at days 100 and 180 post-HCT in patients with low and high periengraftment α-diversity (n = 479; BM, 43; PBSCs, 165; CD34+ PBSCs,: 271). NK counts over time in all graft recipients (N) and separated by graft type (O) (n = 492; BM, 45; PBSCs, 171; CD34+ PBSCs, 276). (M-O) LLN = 78 and ULN = 510 cells per microliter. (P-R) Correlations of CD4 count with CD8 T-cell count (P), CD19+ B-cell count (Q), and NK-cell count (R). R represents the Pearson correlation coefficient. Statistical comparison for (D,G,J,M) was performed with the Wilcoxon rank-sum test.
Figure 2.
Figure 2.
Several microbial taxa are associated with immune reconstitution after allo-HCT in a univariate analysis. (A-C) Composition plots of recipients of BM (A), unmodified PBSC (B), and CD34+ PBSC (C), grafts (a single sample is included per patient). (D-F) tSNE visualization of periengraftment sample color coded by α-diversity of the sample color coded by graft type (E), and color coded by day 100 CD4 count above- or below-median (F). Median per graft type: 115 cells per microliter for BM (33 patients with high and 33 with low CD4 recovery), 220 cells per microliter for PBSCs (102 patients with high and 102 with low CD4 recovery), and 60 cells per microliter for CD34+ PBSCs (157 patients with high and 153 with low CD4 recovery). (G) LEfSe analysis of compositional differences in patients receiving each graft type. CD4 recovery is defined as in panel F. (H-J) Relative abundance of taxa identified by using LEfSe analysis as seen in panel G. NF, no flow data available; LDA, linear discriminant analysis.
Figure 3.
Figure 3.
Multivariate analysis reveals that high staphylococcal relative abundance is associated with low CD4 counts at day 100. (A) Venn diagram demonstrating the overlap in results of the tools tested: MaAslin2, Corncob, metagenomeSeq, and ANCOM2. (B) Genera that were shown to be significantly associated with CD4 recovery according to analysis method.

Comment in

References

    1. Gratwohl A, Baldomero H, Aljurf M, et al. ; Worldwide Network of Blood and Marrow Transplantation . Hematopoietic stem cell transplantation: a global perspective. JAMA. 2010;303(16):1617-1624. - PMC - PubMed
    1. Gooley TA, Chien JW, Pergam SA, et al. . Reduced mortality after allogeneic hematopoietic-cell transplantation. N Engl J Med. 2010;363(22):2091-2101. - PMC - PubMed
    1. Keever-Taylor CA, Devine SM, Soiffer RJ, et al. . Characteristics of CliniMACS® System CD34-enriched T cell-depleted grafts in a multicenter trial for acute myeloid leukemia-Blood and Marrow Transplant Clinical Trials Network (BMT CTN) protocol 0303. Biol Blood Marrow Transplant. 2012;18(5):690-697. - PMC - PubMed
    1. Ando T, Tachibana T, Tanaka M, et al. . Impact of graft sources on immune reconstitution and survival outcomes following allogeneic stem cell transplantation. Blood Adv. 2020;4(2):408-419. - PMC - PubMed
    1. Ringhoffer M, Wiesneth M, Harsdorf S, et al. . CD34 cell selection of peripheral blood progenitor cells using the CliniMACS device for allogeneic transplantation: clinical results in 102 patients. Br J Haematol. 2004;126(4):527-535. - PubMed

Publication types

Substances