. 2022 Jun 10;50(10):5443-5466.
doi: 10.1093/nar/gkac018.

Control of backbone chemistry and chirality boost oligonucleotide splice switching activity

Affiliations

Control of backbone chemistry and chirality boost oligonucleotide splice switching activity

Pachamuthu Kandasamy et al. Nucleic Acids Res. .

Erratum in

Abstract

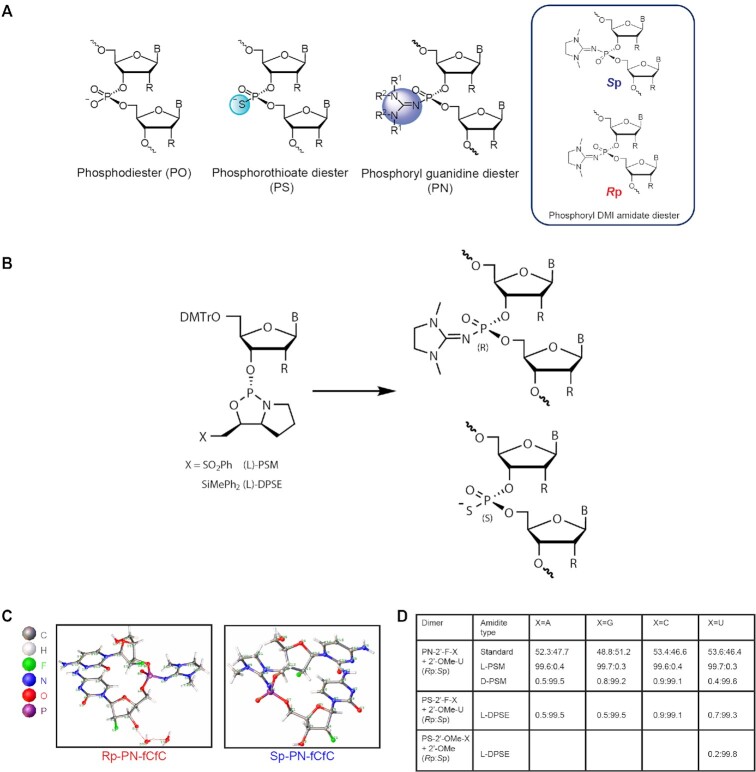
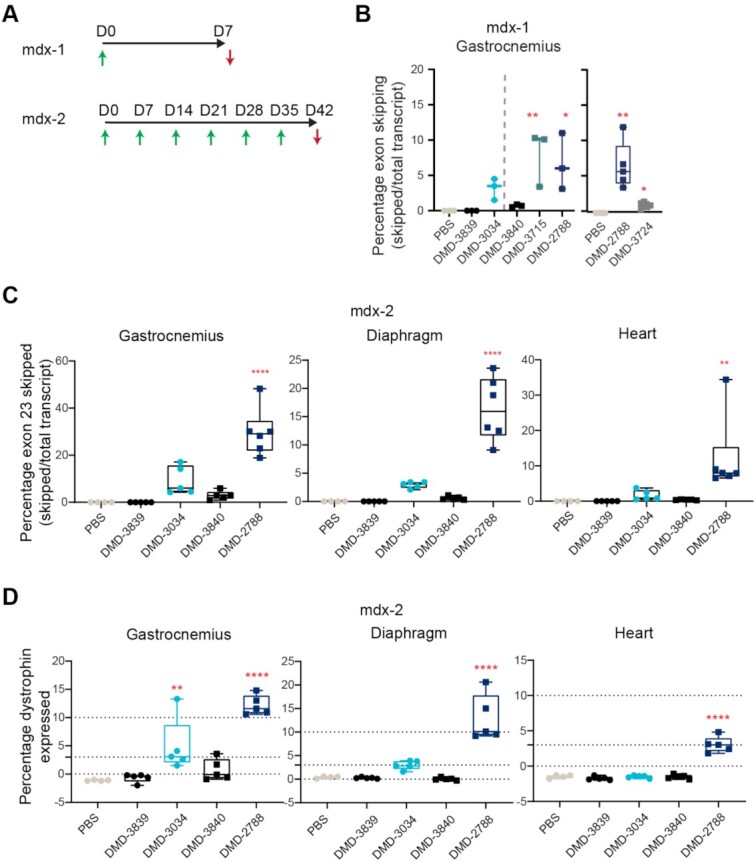
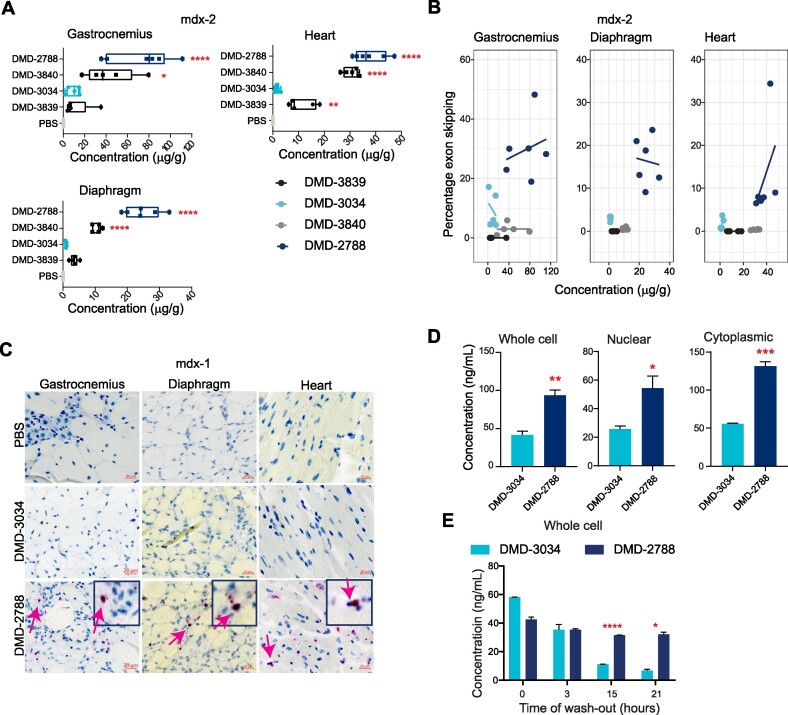
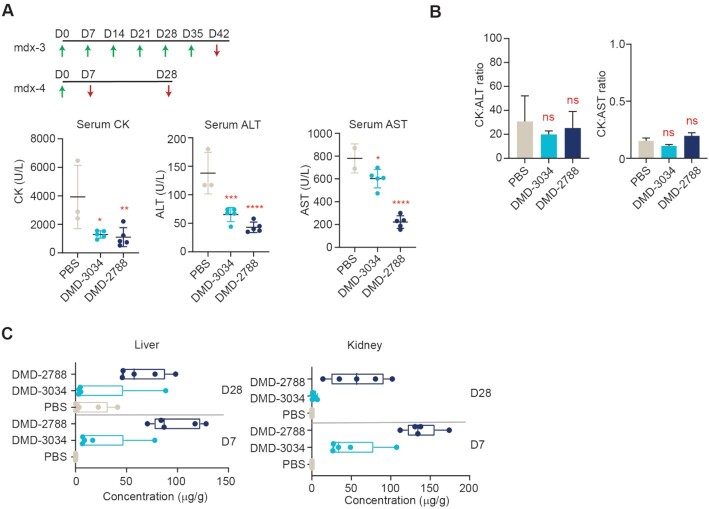
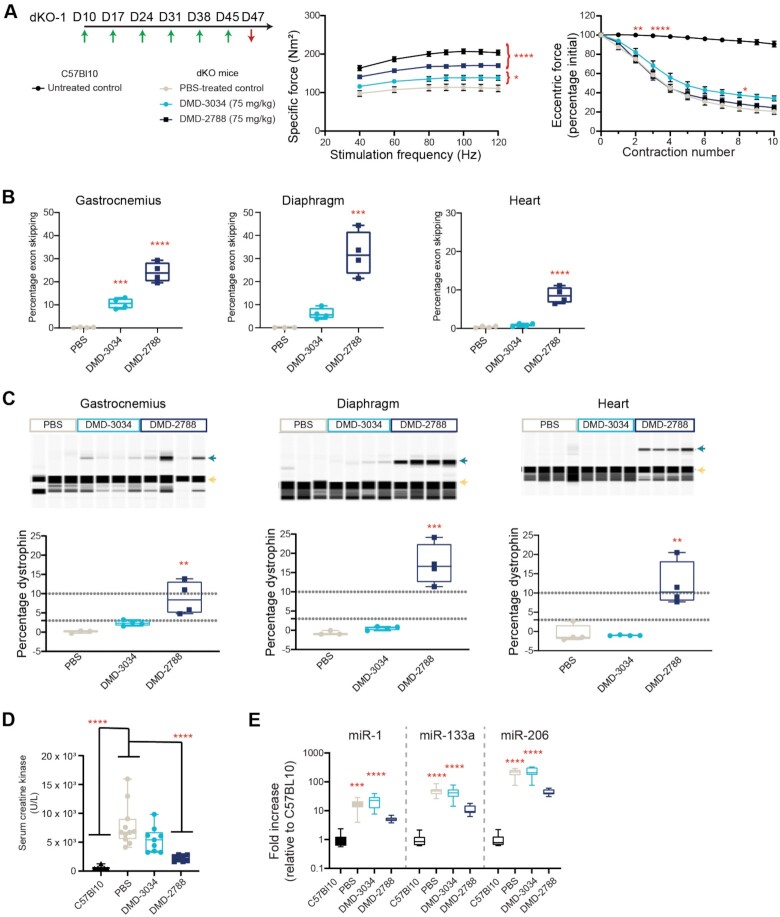
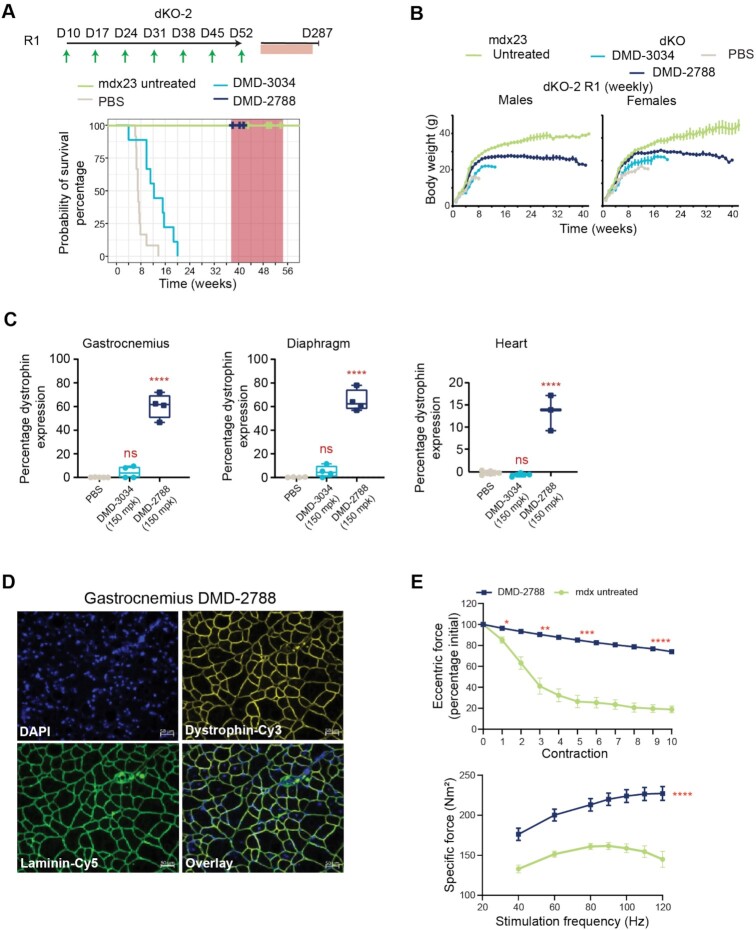
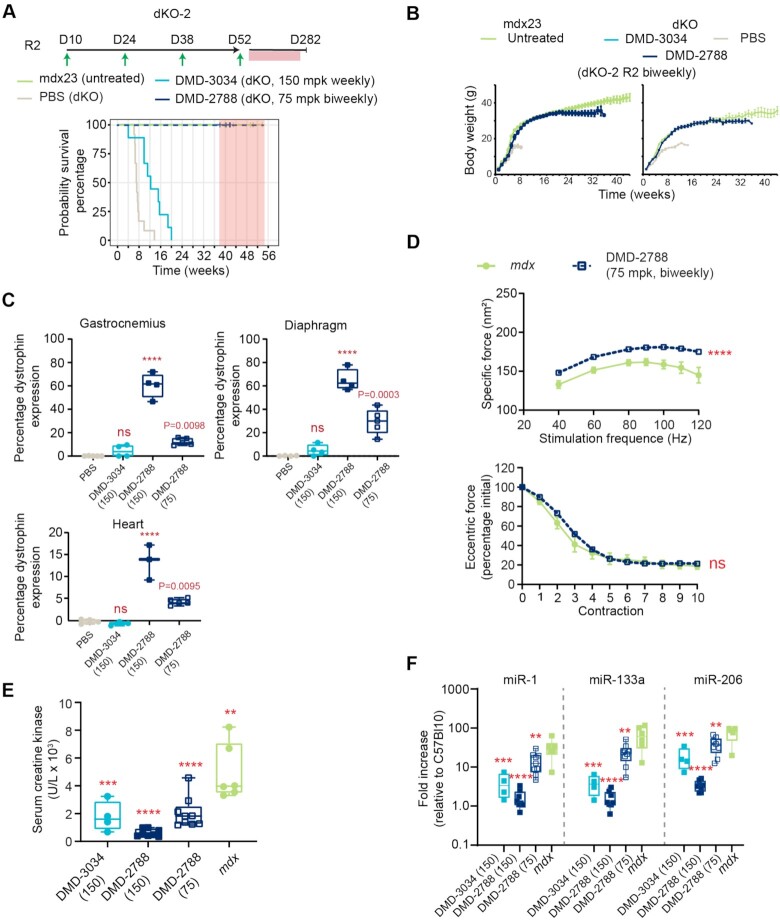
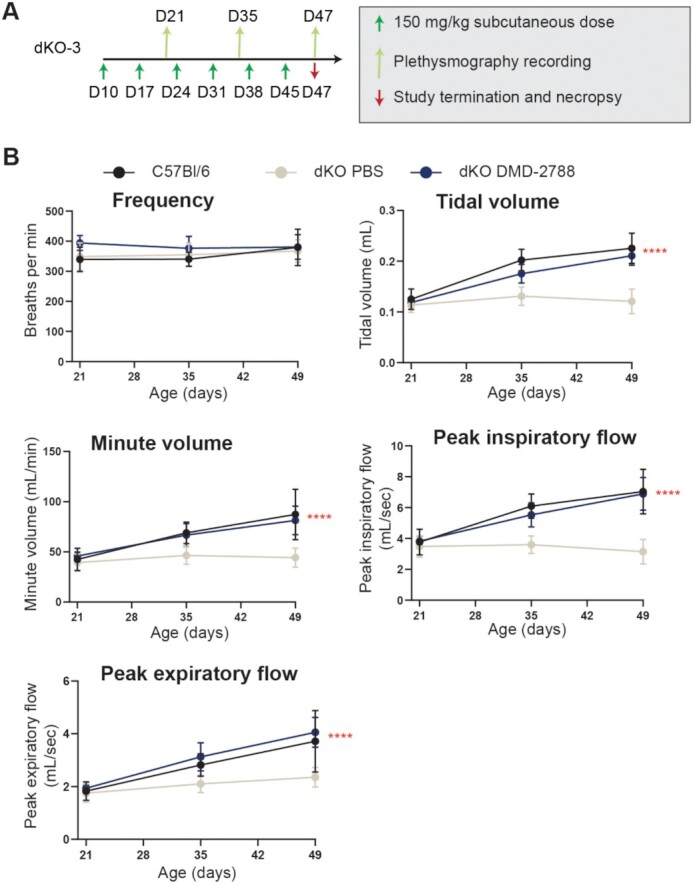
Although recent regulatory approval of splice-switching oligonucleotides (SSOs) for the treatment of neuromuscular disease such as Duchenne muscular dystrophy has been an advance for the splice-switching field, current SSO chemistries have shown limited clinical benefit due to poor pharmacology. To overcome limitations of existing technologies, we engineered chimeric stereopure oligonucleotides with phosphorothioate (PS) and phosphoryl guanidine-containing (PN) backbones. We demonstrate that these chimeric stereopure oligonucleotides have markedly improved pharmacology and efficacy compared with PS-modified oligonucleotides, preventing premature death and improving median survival from 49 days to at least 280 days in a dystrophic mouse model with an aggressive phenotype. These data demonstrate that chemical optimization alone can profoundly impact oligonucleotide pharmacology and highlight the potential for continued innovation around the oligonucleotide backbone. More specifically, we conclude that chimeric stereopure oligonucleotides are a promising splice-switching modality with potential for the treatment of neuromuscular and other genetic diseases impacting difficult to reach tissues such as the skeletal muscle and heart.


Figures

Figure 1.
Figure 1.
Controlling backbone chemistry and stereochemistry for synthesis of exon-skipping oligonucleotides. (A) Images of backbone chemistry and stereochemistry used in this work. (B) The L chiral auxiliary leads to Rp configuration of a PN linkage and Sp configuration of a PS linkage with identical geometry. (C) Crystal structures for the PN-fCfC dimers in the Rp (left) and Sp (right) configurations. (D) Ratio of Rp to Sp linkages from reverse-phase (RP)-UPLC analysis post-dimer synthesis illustrating diastereoselectivity.
Figure 2.
Figure 2.
Characterization and optimization of exon skipping oligonucleotide chemistry for human DMD exon 51. Quantification of exon 51 skipping in human Δ48–50 myoblasts treated gymnotically with the indicated oligonucleotide (10 μM A-C; dose response 0.1, 0.3, 1, 3 or 10 μM D,E). (A) Comparison of activities for oligonucleotides with identical sequence and backbone stereochemistry (stereorandom PS at all positions) with variable numbers of 2′-F modifications in termini. DMD-17 is complementary to mouse Dmd exon 23 and serves as non-targeting control in this experiment. (B) Evaluation of the effect of PO linkages on activity of oligonucleotides with identical sequence and 2′ ribose modification pattern **** P < 0.0001, * P < 0.05 One-way ANOVA with post-hoc comparison to DMD-16 (panel A) or to DMD-100 (panel B), Mean ± s.e.m., n = 2. (C) Evaluation of relationship between PO linkages and 2′-ribose modifications in the center of the oligonucleotide and its activity. **** P < 0.0001, ns, non-significant, One-way ANOVA with post-hoc comparison to DMD-16, Mean ± s.e.m., n = 2. (D) Application of Sp PS backbone stereochemistry and exploration of various 2′-ribose modification patterns in the center of the oligonucleotide. **** P < 0.0001, *** P < 0.001, **P < 0.01,* P < 0.05 Two-way ANOVA with post-hoc comparison to DMD-16, Mean ± s.e.m., n = 2. (E) Impact of PO linkages at various backbone positions on activity. **** P < 0.0001, *** P < 0.001, **P < 0.01,* P < 0.05 Two-way ANOVA with post-hoc comparison to DMD-16, Mean ± s.e.m., n = 2.
Figure 3.
Figure 3.
Identification of exon 23 skipping site. (A) To identify an exon 23 skipping targeting sequence, we screened oligonucleotides (depicted by staggered bars) complementary to sequences in and around exon 23 (yellow) of the mouse Dmd gene (cytogenetic view at top) using oligonucleotides with the chemistry mask identified from preliminary studies (shown in panel B). (B) Exon 23 skipping percentages in H2K cells treated gymnotically with 10 μM of the indicated oligonucleotides (shown in Supplementary Table S1) that differ in sequence but have the same chemical modifications (illustrated to the right). Analysis revealed a new targeting sequence (light blue) that is suitable for mediating efficient exon-23 skipping. DMD-91 (black) targets a previously published comparator sequence (5′- GGCCAAACCUCGGCUUACCU -3′) (26). ****P < 0.0001, **P < 0.01, *P < 0.05 One-way ANOVA with post-hoc comparisons to DMD-91. Mean ± s.e.m., n ≥ 3.
Figure 4.
Figure 4.
Application of PN chemistry to exon skipping oligonucleotides. (A) Placement of PN linkages was evaluated by sequentially replacing each PS linkage with a stereopure PN linkage (Rp configuration). The resulting oligonucleotide series is shown on the left (legend for modifications is shown on right). The graph depicts percentage of exon 23 skipping detected after 4 days of treatment with 0.3 μM (beige), 1 μM (green), or 3 μM (red) of the indicated oligonucleotide (n = 2 per concentration per oligonucleotide). Data are represented as mean ± s.d. (B) Number and position of PN linkages was evaluated in the series of oligonucleotides. The graph depicts percentage of exon 23 skipping detected as shown in panel A. (C) Schematic representation of oligonucleotides evaluated (left). The graph depicts percentage of exon 23 skipping detected as shown in panel A. Dotted gray line separates data from oligonucleotides with and without PN-backbone linkages. Data are presented as mean ± s.e.m., n = 3. Two-way ANOVA with multiple comparisons: * P < 0.05, ** P < 0.01, *** P < 0.001. (D) Oligonucleotide walk across human DMD exon 44 to compare average exon-skipping activity (n = 2) in Δ48–50 primary human myoblasts for oligonucleotides with all-Sp PS backbone to those with inclusion of a few stereorandom PN linkages. PS oligonucleotides, which differ from each other in sequence, are ranked along the x axis with the most active oligonucleotides on the right. Sequence-matched PN-containing oligonucleotides are plotted at the same position (x axis) as their PS counterpart. The chemical modifications for the PS and PS-PN oligonucleotides are shown. DMI, 1,3-dimethylimididazolidine-2-imine
Figure 5.
Figure 5.
Relative exon 23-skipping activity in skeletal muscle in mdx23 mouse correlates with in vitro activity. (A) Dosing paradigms for in vivo studies mdx-1 and mdx-2. Green arrows indicate intravenous (IV) administration of 30 mg/kg (mdx-1) or 75 mg/kg (mdx-2) of oligonucleotide to 6–8-week-old mice. Red arrows indicate sample collection. (B) Percentage of exon 23-skipping detected in mdx23 mouse gastrocnemius muscle at day 7 (D7) in mdx-1 study. n ≥ 3. Data from two separate experiments are shown. (C) Percentage of exon 23-skipping in gastrocnemius, heart, and diaphragm at day 42 (D42) in mdx-2. n ≥ 4. (D) Percentage of dystrophin expression detected at D42 in the gastrocnemius, diaphragm, and heart in mdx-2. WES quantification protocol is outlined in Supplementary Figure S2, images of blots are shown in Supplementary Figure S3, n ≥ 4. For C-D, scales of y axes differ across the graphs; for B-D, box and whisker plots show min to max; data points are individual animals; stats: One-way ANOVA with multiple comparisons to PBS **** P < 0.0001; ** P < 0.01; * P < 0.05.
Figure 6.
Figure 6.
PN backbone chemistry enhances muscle exposure. (A) Concentration of the indicated oligonucleotide detected in gastrocnemius, diaphragm, and heart muscle in mdx-2 study. Dots represent individual mice; box and whiskers show min to max. Mean ± s.d. n ≥ 4. Stats performed with pairwise comparisons to PBS. (B) Relationship between tissue exposure and exon-skipping activity for the indicated oligonucleotides in gastrocnemius, diaphragm, and heart muscle in mdx-2 study. (C) Images showing DMD-3034 and DMD-2788 in gastrocnemius, diaphragm, and cardiac muscle after ViewRNA staining from mdx-1 study at day 7. Tissues treated with PBS are also shown. Arrows demarcate myoblast nuclei that are positive for DMD-2788. Scale bars are 20 μm. (D) Concentration of DMD-3034 or DMD-2788 detected in whole cell (left), nuclear (middle), or cytoplasmic (right) extracts from differentiated myoblasts treated for 24 h as quantified by hybridization ELISA. n = 3 mean ± s.e.m. Unpaired, two-tailed t test *P < 0.05, **P < 0.01, *** P < 0.001. (E) Concentration of DMD-3034 or DMD-2788 in whole cell extracts from myoblasts treated for 3 h and washed for the indicated time. n = 3 mean ± s.e.m. * P < 0.05, ** P < 0.01, **** P < 0.0001 Two-way ANOVA with multiple comparisons.
Figure 7.
Figure 7.
In vivo tolerability studies. (A) Dosing paradigms for in vivo studies mdx-3 and mdx-4. Green arrows indicate intravenous (IV) administration of 60 mg/kg (mdx-3) or 75 mg/kg (mdx-4) of oligonucleotide to 10-week-old male mdx23 mice. Red arrows indicate sample collection. Serum CK (left) serum ALT (middle) and serum AST (right) are shown for animals treated as indicated in the mdx-3 study. Dots represent individual mice. Data are presented as mean ± s.d. n = 3. (B) Ratios of serum CK:ALT (left) and CK:AST (right) are shown for the mdx-3 study. mean ± s.d. are indicated. (C) Concentration of the indicated oligonucleotide detected in liver and kidney in mdx-4 study at days 7 (D7) and 28 (D28). Dots represent individual mice; box and whiskers show min to max. Data are presented as mean ± s.d. n = 4. Stats for all panels by One-way ANOVA with Dunnett's post-hoc test for multiple comparisons. ns non-significant, * P < 0.05, ** P < 0.01, *** P < 0.001, **** P < 0.0001.
Figure 8.
Figure 8.
DMD-3034 and DMD-2788 improve biomarker profiles and muscle function in dKO mice. (A) Schematic representation of weekly subcutaneous dosing regimen (75 mg/kg) for study dKO-1. First administration corresponds to 10-day old mice. Mice were dosed weekly (green arrows) for 6 weeks starting on day 10 of age and assessed for functional assays before sacrifice 2 days after the last injection (red arrow). Specific force (middle) production over increasing stimulation frequency and force drop as a percentage of initial eccentric force (right) following repeated contraction for C57Bl10 mice and dKO mice treated with PBS or the indicated oligonucleotide. Mean ± s.d., n ≥ 4. Two-way ANOVA with comparisons to PBS. * P < 0.05,** P < 0.01, ***P < 0.001, **** P < 0.0001. All significant differences increased or were maintained at later experimental points. For example, by contraction 3 (bottom), untreated C57Bl10 mice are significantly different from PBS-treated dKO mice (P < 0.0001), and this level of significance persists through the end of the experiment. (B) Percentage exon skipping measured in the gastrocnemius (left), diaphragm (middle), and heart (right) in dKO-1 study at day 47. Mean ± s.d., n = 4. ***P < 0.001, **** P < 0.0001. (C) Percentage dystrophin restoration measured in the same tissues as in panel B. Dystrophin quantification as shown in Supplementary Figure S2. Green arrow denotes dystrophin; yellow arrow, vinculin. (D) Serum creatine kinase levels for mice from dKO-1 study at day 47. Mean ± s.e.m., C57BL10 n = 6; dKO n = 8. (E) Serum miRNA levels for dKO-1 study at day 47. Mean ± s.e.m., C57Bl10 n = 6; dKO n = 8. Panels B–D: one-way ANOVA with comparison to PBS (B), PBS and C57Bl10 (C) or C57Bl10 (D), ** P < 0.01, *** P < 0.001, **** P < 0.0001.
Figure 9.
Figure 9.
DMD-2788 rescues early fatality in dKO mice. (A) Schematic representation of dosing regimens for dKO-2 study, with 10-day old mice receiving weekly subcutaneous 150 mg/kg doses of oligonucleotide or PBS in regimen 1 (R1, top) (n = 8 per group). Mice receiving DMD-2788 survived beyond the study window and were euthanized for analysis between 38 (day 266) and 41 weeks (day 287). Kaplan-Meier survival curves showing probability of survival over time for mice in R1. Hash marks indicate time points when mice were culled (some hash marks represent more than 1 mouse), and shaded red box indicates window for study termination. (B) Body weights (g) over time for males (left) and females (right) in R1. Data are presented as mean ± s.e.m., n = 8. (C) Dystrophin expression detected in gastrocnemius, diaphragm, and heart in mice from R1. Dystrophin quantification as shown in Supplementary Figure S2. Tissues from PBS- and DMD-3034-treated animals were taken at terminal time points when they were no longer healthy. Dots represent individual mice; box and whiskers show min to max. n = 2, PBS control; n = 4, treated; ns non-significant, **** P < 0.0001, one-way ANOVA with multiple comparisons to PBS. (D) Visualization of restored dystrophin co-localized with laminin in gastrocnemius muscle of dKO mice treated with DMD-2788. 50 μm scale bar is shown. (E) Percentage of initial specific force following repeat eccentric contraction (top) and specific force at increasing stimulation frequency (bottom) for dKO mice treated with DMD-2788 (150 mg/kg) for ∼38 weeks and comparably aged and untreated mdx23 mice from dKO-1 R1. Mean ± s.d., n ≥ 4. Two-way ANOVA with comparisons to PBS. * P < 0.05,** P < 0.01, ***P < 0.001, **** P < 0.0001. All significant differences increased or were maintained at later experimental points.
Figure 10.
Figure 10.
Clinically relevant doses of DMD-2788 rescue early fatality in dKO mice. (A) Schematic representation of dosing regimen for dKO-2 study, with 10-day old mice receiving biweekly subcutaneous 75 mg/kg doses in regimen 2 (R2) (n = 9 per group). Kaplan-Meier survival curves showing probability of survival over time for mice in R2. Hash marks indicate time points when mice were culled (some hash marks represent more than 1 mouse), and shaded red box indicates window for study termination. (B) Body weights (g) over time for males (left) and females (right) in R2, respectively. Data are presented as mean ± s.e.m., n = 8. (C) Dystrophin expression detected in gastrocnemius, diaphragm, and heart in mice from dKO-2 R1 (150 mg/kg) and R2 (75 mg/kg). Dystrophin quantification as shown in Supplementary Figure S2. Tissues from PBS- and DMD-3034-treated animals were taken at terminal time points when they were no longer healthy. Dots represent individual mice; box and whiskers show min to max. n = 2, PBS control; n = 4, treated; ns non-significant, **** P < 0.0001, one-way ANOVA with multiple comparisons to PBS. (D) Percentage of initial specific force following repeat eccentric contraction (top) and specific force at increasing stimulation frequency (bottom) for dKO mice treated with DMD-2788 (75 mg/kg) for ∼38 weeks and comparably aged and untreated mdx23 mice from dKO-2. Data are presented as mean ± s.e.m., n ≥ 4. Two-way ANOVA with comparison to mdx. ns nonsignificant, **** P < 0.0001. (E) Serum creatine kinase levels for dKO mice from dKO-2 R1 and R2 and mdx23 controls. Box and violin plots show min to max, dKO (DMD-3034) n = 4, dKO (DMD-2788 150 mpk) n = 8, (DMD-2788 75 mpk) n = 9, mdxn = 6. ** P = 0.0016, *** P = 0.0003, **** P < 0.0001, one-way ANOVA with multiple comparisons to PBS-treated dKO mice. (F) Serum miRNA levels for dKO-2 study R1 and R2 and mdx23 controls. Box and violin plots show min to max, C57Bl10 n = 6; DMD-3034 n = 8, DMD-2788 n = 8, mdx n = 8. ** P < 0.01, *** P < 0.001, **** P < 0.0001, one-way ANOVA with multiple comparisons to mdx23 mice.
Figure 11.
Figure 11.
DMD-2788 rescues respiratory function in dKO mice. (A) Schematic representation of dKO-3 study with 10-day old mice receiving weekly subcutaneous 150 mg/kg doses of DMD-2788 (n = 8) or PBS (n = 9). Age-matched C57Bl/6 wild-type mice (n = 8) were also included in the study. Green arrows (below black line) indicate dosing, light green arrows (above black line) indicated whole-body non-invasive plethysmography over a 30 min recording period, and red arrow indicates the end of the study. (B) Graphs depict frequency of respiration, tidal volume, minute volume, peak inspiratory flow, or peak expiratory flow at days 21, 35 and 49 of age. Data are presented as mean ± s.d. Stats from two-way ANOVA **** P < 0.0001.

References

    1. Hoffman E.P., McNally E.M.. Exon-skipping therapy: a roadblock, detour, or bump in the road?. Sci. Transl. Med. 2014; 6:230fs214. - PMC - PubMed
    1. Verhaart I.E.C., Aartsma-Rus A.. Therapeutic developments for duchenne muscular dystrophy. Nat. Rev. Neurol. 2019; 15:373–386. - PubMed
    1. Mah J.K. Current and emerging treatment strategies for duchenne muscular dystrophy. Neuropsychiatr. Dis. Treat. 2016; 12:1795–1807. - PMC - PubMed
    1. Birnkrant D.J., Bushby K., Bann C.M., Apkon S.D., Blackwell A., Brumbaugh D., Case L.E., Clemens P.R., Hadjiyannakis S., Pandya S.et al. .. Diagnosis and management of duchenne muscular dystrophy, part 1: diagnosis, and neuromuscular, rehabilitation, endocrine, and gastrointestinal and nutritional management. Lancet. Neurology. 2018; 17:251–267. - PMC - PubMed
    1. Blake D.J., Weir A., Newey S.E., Davies K.E.. Function and genetics of dystrophin and dystrophin-related proteins in muscle. Physiol. Rev. 2002; 82:291–329. - PubMed

Publication types

MeSH terms

Substances