Distinct limbic dopamine regulation across olfactory-tubercle subregions through integration of in vivo fast-scan cyclic voltammetry and optogenetics
- PMID: 35061915
- PMCID: PMC8930533
- DOI: 10.1111/jnc.15577
Distinct limbic dopamine regulation across olfactory-tubercle subregions through integration of in vivo fast-scan cyclic voltammetry and optogenetics
Abstract
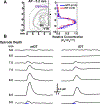
The olfactory tubercle (OT), an important component of the ventral striatum and limbic system, is involved in multi-sensory integration of reward-related information in the brain. However, its functional roles are often overshadowed by the neighboring nucleus accumbens. Increasing evidence has highlighted that dense dopamine (DA) innervation of the OT from the ventral tegmental area (VTA) is implicated in encoding reward, natural reinforcers, and motivated behaviors. Recent studies have further suggested that OT subregions may have distinct roles in these processes due to their heterogeneous DA transmission. Currently, very little is known about regulation (release and clearance) of extracellular DA across OT subregions due to its limited anatomical accessibility and proximity to other DA-rich brain regions, making it difficult to isolate VTA-DA signaling in the OT with conventional methods. Herein, we characterized heterogeneous VTA-DA regulation in the medial (m) and lateral (l) OT in "wild-type," urethane-anesthetized rats by integrating in vivo fast-scan cyclic voltammetry with cell-type specific optogenetics to stimulate VTA-DA neurons. Channelrhodopsin-2 was selectively expressed in the VTA-DA neurons of wild-type rats and optical stimulating parameters were optimized to determine VTA-DA transmission across the OT. Our anatomical, neurochemical, and pharmacological results show that VTA-DA regulation in the mOT is less dependent on DA transporters and has greater DA transmission than the lOT. These findings establish the OT as a unique, compartmentalized structure and will aid in future behavioral characterization of the roles of VTA-DA signaling in the OT subregions in reward, drug addiction, and encoding behavioral outputs necessary for survival.
Keywords: dopamine; fast-scan cyclic voltammetry; olfactory tubercle; optogenetics; ventral tegmental area.
© 2022 International Society for Neurochemistry.
Conflict of interest statement
Conflict of Interest Disclosure
The authors have no financial interests relating to the work described and declare no conflict of interest.
Figures


Similar articles
-
Heterogeneous extracellular dopamine regulation in the subregions of the olfactory tubercle.J Neurochem. 2017 Aug;142(3):365-377. doi: 10.1111/jnc.14069. Epub 2017 Jun 20. J Neurochem. 2017. PMID: 28498499 Free PMC article.
-
Application of fast-scan cyclic voltammetry for the in vivo characterization of optically evoked dopamine in the olfactory tubercle of the rat brain.Analyst. 2016 Jun 21;141(12):3746-55. doi: 10.1039/c6an00196c. Epub 2016 Apr 11. Analyst. 2016. PMID: 27063845
-
Noradrenergic Modulation of Dopamine Transmission Evoked by Electrical Stimulation of the Locus Coeruleus in the Rat Brain.ACS Chem Neurosci. 2017 Sep 20;8(9):1913-1924. doi: 10.1021/acschemneuro.7b00078. Epub 2017 Jun 21. ACS Chem Neurosci. 2017. PMID: 28594540
-
Dopamine reward circuitry: two projection systems from the ventral midbrain to the nucleus accumbens-olfactory tubercle complex.Brain Res Rev. 2007 Nov;56(1):27-78. doi: 10.1016/j.brainresrev.2007.05.004. Epub 2007 May 17. Brain Res Rev. 2007. PMID: 17574681 Free PMC article. Review.
-
Mesoaccumbal Dopamine Heterogeneity: What Do Dopamine Firing and Release Have to Do with It?Annu Rev Neurosci. 2022 Jul 8;45:109-129. doi: 10.1146/annurev-neuro-110920-011929. Epub 2022 Feb 28. Annu Rev Neurosci. 2022. PMID: 35226827 Free PMC article. Review.
Cited by
-
Ventral Tegmental Area Amylin Receptor Activation Differentially Modulates Mesolimbic Dopamine Signaling in Response to Fat versus Sugar.eNeuro. 2024 Jun 10;11(6):ENEURO.0133-24.2024. doi: 10.1523/ENEURO.0133-24.2024. Print 2024 Jun. eNeuro. 2024. PMID: 38806231 Free PMC article.
-
Connectivity of the olfactory tubercle: inputs, outputs, and their plasticity.Front Neural Circuits. 2024 May 22;18:1423505. doi: 10.3389/fncir.2024.1423505. eCollection 2024. Front Neural Circuits. 2024. PMID: 38841557 Free PMC article. Review.
-
Learning-dependent structural plasticity of intracortical and sensory connections to functional domains of the olfactory tubercle.Front Neurosci. 2023 Aug 23;17:1247375. doi: 10.3389/fnins.2023.1247375. eCollection 2023. Front Neurosci. 2023. PMID: 37680965 Free PMC article.
-
An Updated Review on Electrochemical Nanobiosensors for Neurotransmitter Detection.Biosensors (Basel). 2023 Sep 19;13(9):892. doi: 10.3390/bios13090892. Biosensors (Basel). 2023. PMID: 37754127 Free PMC article. Review.
References
Publication types
MeSH terms
Substances
Grants and funding
LinkOut - more resources
Full Text Sources
Medical

