. 2022 Apr;110(2):452-469.
doi: 10.1111/tpj.15680. Epub 2022 Feb 9.

Phosphate-induced resistance to pathogen infection in Arabidopsis

Affiliations

Phosphate-induced resistance to pathogen infection in Arabidopsis

Beatriz Val-Torregrosa et al. Plant J. 2022 Apr.

Abstract

In nature, plants are concurrently exposed to a number of abiotic and biotic stresses. Our understanding of convergence points between responses to combined biotic/abiotic stress pathways remains, however, rudimentary. Here we show that MIR399 overexpression, loss-of-function of PHOSPHATE2 (PHO2), or treatment with high phosphate (Pi) levels is accompanied by an increase in Pi content and accumulation of reactive oxygen species (ROS) in Arabidopsis thaliana. High Pi plants (e.g., miR399 overexpressors, pho2 mutants, and plants grown under high Pi supply) exhibited resistance to infection by necrotrophic and hemibiotrophic fungal pathogens. In the absence of pathogen infection, the expression levels of genes in the salicylic acid (SA)- and jasmonic acid (JA)-dependent signaling pathways were higher in high Pi plants compared to wild-type plants grown under control conditions, which is consistent with increased levels of SA and JA in non-infected high Pi plants. During infection, an opposite regulation in the two branches of the JA pathway (ERF1/PDF1.2 and MYC2/VSP2) occurs in high Pi plants. Thus, while pathogen infection induces PDF1.2 expression in miR399 OE and pho2 plants, VSP2 expression is downregulated by pathogen infection in these plants. This study supports the notion that Pi accumulation promotes resistance to infection by fungal pathogens in Arabidopsis, while providing a basis to better understand interactions between Pi signaling and hormonal signaling pathways for modulation of plant immune responses.

Keywords: Arabidopsis thaliana; Colletotrichum higginsianum; PHOSPHATE 2; Plectosphaerella cucumerina; immune response; jasmonic acid (JA); microRNA399 (miR399); phosphate (Pi); reactive oxygen species (ROS); salicylic acid (SA).


Conflict of interest statement

The authors declare that they do not have competing interests.

Figures
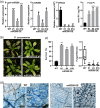
Figure 1
Figure 1
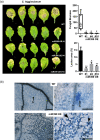
Resistance of miR399 OE plants to infection by the necrotrophic fungus P. cucumerina. Homozygous miR399 OE lines (#1, #4, and #10) and wild‐type plants were grown in soil for 3 weeks and then assayed for disease resistance. Three independent experiments were carried out with at least 12 plants per line in each experiment. (a) Accumulation of precursor (pre‐miR399) and mature miR399 sequences was determined by RT‐qPCR and stem‐loop RT‐qPCR, respectively. Expression of the miR399 target AtPHO2 was determined by RT‐qPCR. The Arabidopsis β‐tubulin2 gene (At5g05620) was used to normalize transcript levels (relative expression). The accumulation of free Pi in leaves is shown (right panel). Bars represent mean ± SEM of three biological replicates with at least three plants per replicate (t‐test, *P ≤ 0.05, **P ≤ 0.01, ***P ≤ 0.001). (b) Plants were spray‐inoculated with P. cucumerina spores (5 × 105 spores ml−1). Pictures were taken at 7 days post‐inoculation (dpi). (c) Survival ratio of wild‐type and miR399 OE plants at 7 dpi. Quantification of P. cucumerina DNA was performed by qPCR using specific primers for P. cucumerina β‐tubulin at 7 dpi. Values of fungal DNA were normalized against the Arabidopsis UBIQUITIN21 gene (At5g25760). Comparisons have been made relative to wild‐type plants. Data are mean ± SEM (n = 7) (t‐test, *P ≤ 0.05, **P ≤ 0.01). (d) Trypan blue staining of P. cucumerina‐infected leaves of wild‐type and miR399 OE plants (7 dpi). h, hyphae. Arrows and arrowheads indicate fungal hyphae and dead cells, respectively. Higher magnifications are shown (wild type and miR399 OE, right panels). Bars represent 300 μm.
Figure 2
Figure 2
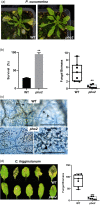
Resistance of miR399 OE plants to infection by the hemibiotrophic fungus C. higginsianum. Leaves were locally inoculated with a spore suspension at 4 × 106 spores ml−1. Results are from one out of three independent experiments performed with three independent miR399 OE lines (lines 1, 4, and 10) and wild‐type plants which gave similar results. At least 12 plants per genotype were assayed in each experiment. (a) Disease symptoms at 7 days post‐inoculation (dpi) with fungal spores. The diseased leaf area was quantified using ImageJ software. Quantification of C. higginsianum DNA was carried out by qPCR using specific primers for the C. higginsianum Internally transcribed spacer 2 (ITS2) gene at 7 dpi. Values are fungal DNA levels normalized against the Arabidopsis UBIQUITIN21 gene (At5g25760). Comparisons have been made relative to wild‐type plants. Histograms show the mean ± SEM (t‐test, *P ≤ 0.05, **P ≤ 0.01). (b) Trypan blue staining of C. higginsianum‐infected leaves of wild‐type and miR399 OE plants at 7 dpi. h, hyphae. Arrows and arrowheads indicate fungal hyphae and dead cells, respectively. Higher magnifications of these regions are shown (right panels). Bars represent 100 μm.
Figure 3
Figure 3
Resistance to infection by fungal pathogens in pho2 plants. Three‐week‐old mutant plants were inoculated with fungal P. cucumerina spores. Three independent experiments were carried out with similar results with at least 12 plants per genotype. (a) Disease phenotype of wild‐type and pho2 plants upon inoculation with P. cucumerina spores (5 × 105 spores ml−1). Pictures were taken at 7 days post‐inoculation (dpi). (b) Survival ratio of wild‐type and pho2 plants at 7 dpi (left panel). Quantification of P. cucumerina DNA was carried out using specific primers for P. cucumerina β‐tubulin at 7 dpi (right panel). Values are fungal DNA levels normalized against the Arabidopsis UBIQUITIN21 gene (At5g25760). Data are mean ± SEM (n = 7) (t‐test, *P ≤ 0.05, **P ≤ 0.01, ***P ≤ 0.001). (c) Trypan blue staining of P. cucumerina‐infected leaves and visualization of cell death and fungal growth. h, hyphae. Arrows and arrowheads indicate fungal hyphae and dead cells, respectively. Bars represent 200 μm. (d) Disease phenotype of wild‐type and pho2 plants at 8 dpi with C. higginsianum spores (4 × 106 spores ml−1).
Figure 4
Figure 4
Acumulation of precursor (pre‐miR399), mature (miR399), and PHO2 transcripts in wild‐type plants in response to inoculation with P. cucumerina spores or treatment with P. cucumerina elicitors. The accumulation of pre‐miR399f and mature miR399f sequences was determined by RT‐qPCR and stem‐loop RT‐qPCR, respectively, at the indicated times after inoculation with fungal spores (a) or elicitor treatment (b). At 48 and 72 hpi with P. cucumerina spores, pre‐miR399 levels increased 4.5‐ and 6.0‐fold, respectively. At the same time points, miR399f levels increased 2.0‐ and 9.0‐fold. Elicitor treatment elevated the level of pre‐miR399f accumulation 5.0‐ and 267‐fold at 90 and 120 min of treatment, respectively. MiR399f levels increased 20‐ and 147‐fold in response to elicitor treatment (90 and 120 min, respectively). Four biological replicates and three technical replicates per time point were assayed. Statistically significant differences were determined by anova followed by Tukey's HSD test, where different letters represent statistically significant differences.
Figure 5
Figure 5
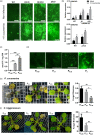
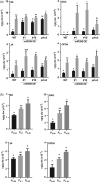
Enhanced accumulation of ROS and disease resistance in Arabidopsis plants that overaccumulate Pi. (a) In situ histochemical detection of ROS in leaves of miR399 OE and pho2 plants. Plants were spray‐inoculated with P. cucumerina spores (5 × 105 spores ml−1) or mock‐inoculated. Visualization of H2O2 accumulation was carried out using the fluorescent probe H2DCFDA at 2 days post‐inoculation (dpi). Bars represent 200 μm. (b) Expression of RBOHD in mock‐inoculated and P. cucumerina‐inoculated plants at 24 hpi (black and gray bars, respectively). The expression values were normalized to the Arabidopsis β‐tubulin2 gene (At5g62690). Three biological replicates (with three plants per replicate) were examined. Different letters represent statistically significant differences (anova followed by Tukey's HSD test; P < 0.05). (c) Free Pi content in plants that have been grown under different conditions of Pi supply. Plants were grown on agar plates for 1 week and transferred to fresh agar plates with medium containing different concentrations of Pi (0.05, 0.1, or 0.25 mm). Plants were allowed to continue growth for one more week and then inoculated with fungal spores. Pi content was determined at the time of inoculation with fungal spores. (d) ROS accumulation in wild‐type Arabidopsis (Col‐0) plants that have been grown under different Pi supply conditions, that is, 0.05, 0.1, 0.25, or 2 mm Pi (P0.05, P0.1, P0.25, and P2, respectively). ROS were detected using H2DCFDA. Representative images are shown. Bars correspond to 1 mm. (e) Resistance to infection by P. cucumerina in Pi‐treated Arabidopsis plants. Appearance of plants at 7 dpi) with P. cucumerina spores (4 × 106 spores ml−1; left panel). Representative results from one of three independent infection experiments that gave similar results are shown. Right panel, fungal biomass determined at 3 dpi by qPCR analysis using specific primers for P. cucumerina β‐tubulin and normalized to the Arabidopsis UBIQUITIN21 gene (At5g25760). (f) Resistance of Pi‐treated Arabidopsis plants to infection by C. higginsianum. Disease symptoms of Arabidopsis plants at 12 dpi with C. higginsianum spores (5 × 105 spores ml−1). Right panel, fungal biomass at 7 dpi as determined by qPCR analysis using specific primers for C. higginsianum Internally transcribed spacer 2 (ITS2). Means of three biological replicates, each one from a pool of at least three plants, are shown in (e) and (f) (right panels; t‐test, *P ≤ 0.05, **P ≤ 0.01, ***P ≤ 0.001).
Figure 6
Figure 6
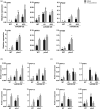
Expression of defense genes in miR399 OE and pho2 plants. Transcript levels were determined by RT‐qPCR in mock‐inoculated or P. cucumerina‐inoculated plants at 24 h post‐inoculation (black and gray bars, respectively). The expression values were normalized to the Arabidopsis β‐tubulin2 gene (At5g62690). (a) Expression of genes involved in the SA pathway (PR1, NPR1, PAD4). (b) Expression of genes in the ERF branch of the JA pathway (ERF1, PDF1.2). (c) Expression of genes in the MYC branch of the JA pathway (MYC2, VSP2). Three independent experiments (with 12 plants per genotype) were examined, with similar results. Bars represent mean ± SEM. Different letters represent statistically significant differences (anova followed by Tukey's HSD test; P < 0.05).
Figure 7
Figure 7
Levels of SA, SAG, JA, and OPDA in leaves of Arabidopsis plants that overaccumulate Pi (miR399 OE, pho2, and wild‐type plants). (a) Hormone levels were measured in mock‐inoculated and P. cucumerina‐inoculated miR399 and pho2 plants at 48 hpi. (b) Hormone levels in wild‐type plants that have been grown at the indicated Pi supply conditions (0.05, 0.1, and 0.25 mm Pi). Plants were grown as indicated in Figure 5. Three independent experiments (with 12 plants per genotype) were examined, with similar results. Bars represent mean ± SEM. Different letters represent statistically significant differences (anova followed by Tukey's HSD test; P < 0.05).
Figure 8
Figure 8
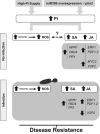
Proposed model to explain how Pi content and defense responses are integrated for modulation of resistance to infection by fungal pathogens in Arabidopsis. Treatment with high Pi, MIR399 overexpression, and loss‐of‐function of PHO2 would trigger Pi accumulation, which, in turn, would increase ROS and hormone (SA and JA) levels in Arabidopsis leaves for the induction of genes involved in the SA and JA signaling pathways. Upon pathogen infection, the expression of genes involved in the SA pathway and the ERF1/PDF1.2 branch of the JA pathway would be further induced, while genes in the MYC2/VSP2 branch of the JA pathway are repressed. The interplay between Pi, ROS, and hormones would allow the plant to mount an effective immune response. Although crosstalk between ROS and hormonal pathways has been described (Herrera‐Vásquez et al., ; Xia et al., 2015), further investigation is needed to elucidate (i) the exact mechanisms by which Pi content modulates ROS production and hormone content and (ii) how these signaling pathways communicate with each other in the coordinated regulation of Pi homeostasis and immune responses.

References

    1. Aerts, N. , Pereira Mendes, M. & Van Wees, S.C.M. (2021) Multiple levels of crosstalk in hormone networks regulating plant defense. The Plant Journal, 105, 489–504. - PMC - PubMed
    1. Andersen, E. , Ali, S. , Byamukama, E. , Yen, Y. & Nepal, M. (2018) Disease resistance mechanisms in plants. Genes, 9, 339. - PMC - PubMed
    1. Atkinson, N.J. & Urwin, P.E. (2012) The interaction of plant biotic and abiotic stresses: from genes to the field. Journal of Experimental Botany, 63, 3523–3544. - PubMed
    1. Aung, K. , Lin, S.I. , Wu, C.C. , Huang, Y.T. , Su, C.L. & Chiou, T.J. (2006) pho2, a phosphate overaccumulator, is caused by a nonsense mutation in a microRNA399 Target Gene. Plant Physiology, 141, 1000–1011. - PMC - PubMed
    1. Ballini, E. , Nguyen, T.T.T. & Morel, J.B. (2013) Diversity and genetics of nitrogen‐induced susceptibility to the blast fungus in rice and wheat. Rice, 6, 1–13. - PMC - PubMed

Publication types