

TCRpower: quantifying the detection power of T-cell receptor sequencing with a novel computational pipeline calibrated by spike-in sequences
- PMID: 35062022
- PMCID: PMC8921636
- DOI: 10.1093/bib/bbab566
TCRpower: quantifying the detection power of T-cell receptor sequencing with a novel computational pipeline calibrated by spike-in sequences
Abstract
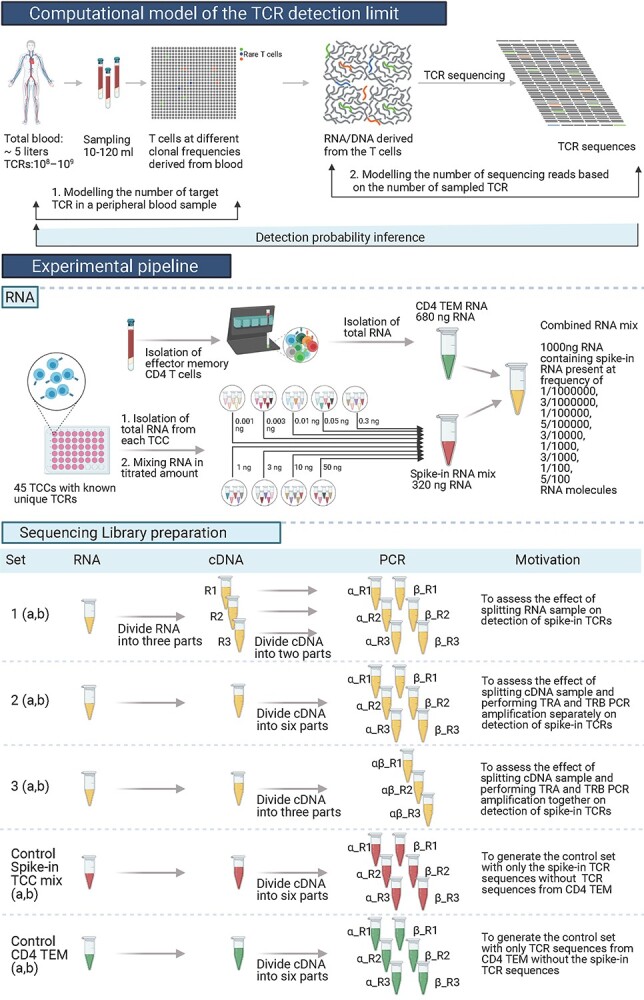
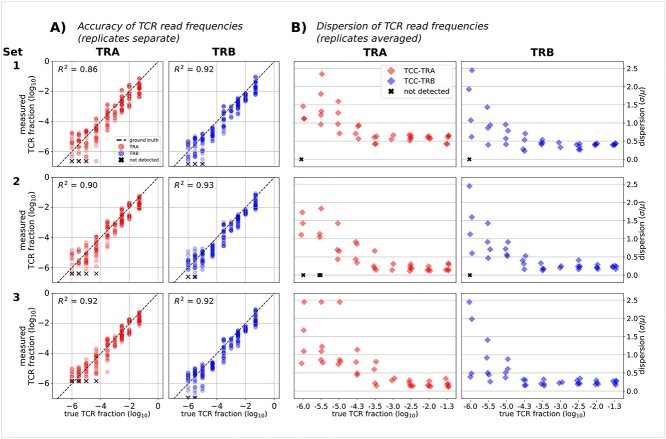
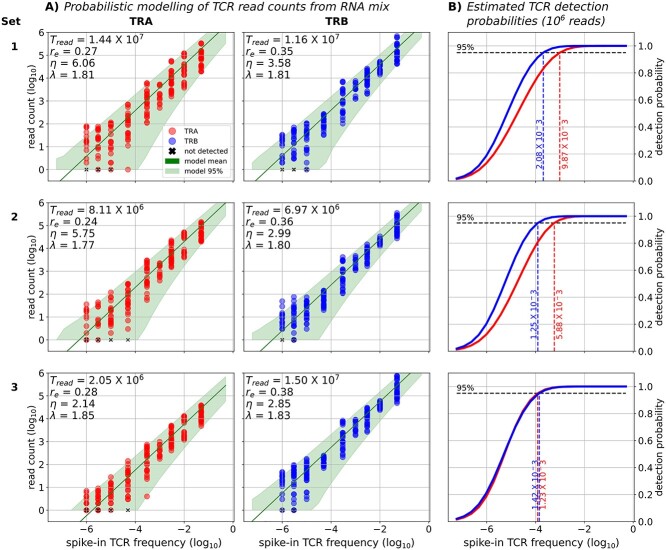
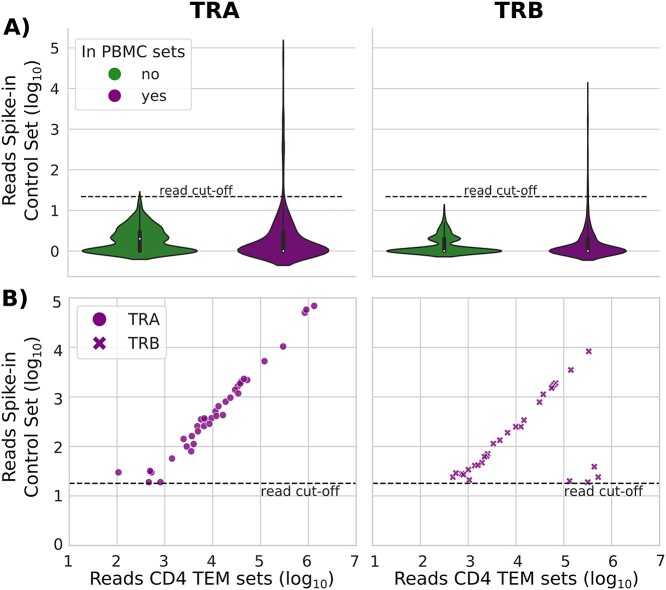
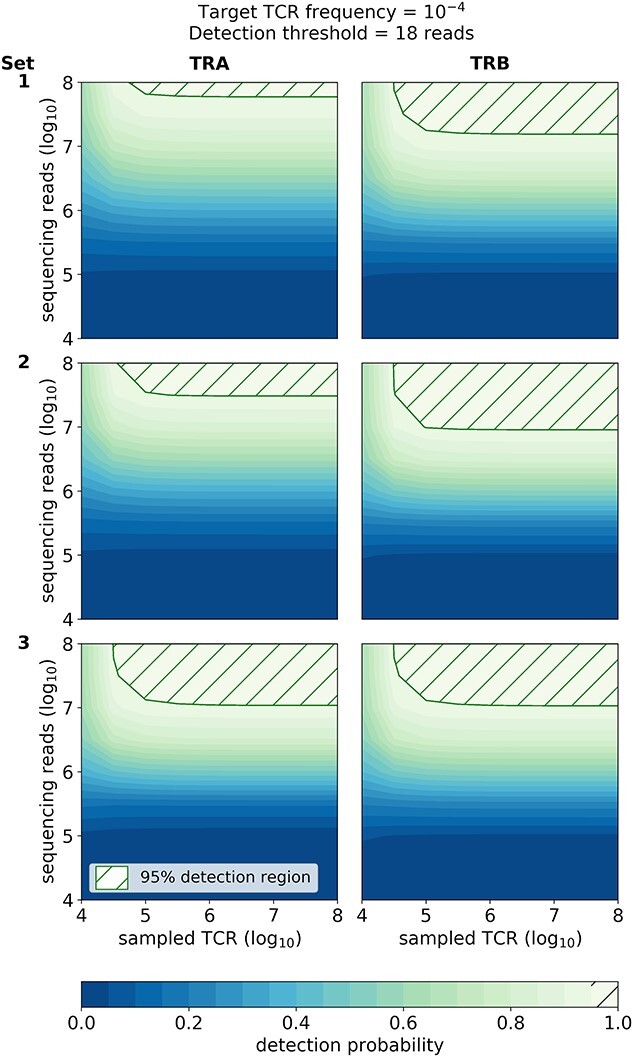
T-cell receptor (TCR) sequencing has enabled the development of innovative diagnostic tests for cancers, autoimmune diseases and other applications. However, the rarity of many T-cell clonotypes presents a detection challenge, which may lead to misdiagnosis if diagnostically relevant TCRs remain undetected. To address this issue, we developed TCRpower, a novel computational pipeline for quantifying the statistical detection power of TCR sequencing methods. TCRpower calculates the probability of detecting a TCR sequence as a function of several key parameters: in-vivo TCR frequency, T-cell sample count, read sequencing depth and read cutoff. To calibrate TCRpower, we selected unique TCRs of 45 T-cell clones (TCCs) as spike-in TCRs. We sequenced the spike-in TCRs from TCCs, together with TCRs from peripheral blood, using a 5' RACE protocol. The 45 spike-in TCRs covered a wide range of sample frequencies, ranging from 5 per 100 to 1 per 1 million. The resulting spike-in TCR read counts and ground truth frequencies allowed us to calibrate TCRpower. In our TCR sequencing data, we observed a consistent linear relationship between sample and sequencing read frequencies. We were also able to reliably detect spike-in TCRs with frequencies as low as one per million. By implementing an optimized read cutoff, we eliminated most of the falsely detected sequences in our data (TCR α-chain 99.0% and TCR β-chain 92.4%), thereby improving diagnostic specificity. TCRpower is publicly available and can be used to optimize future TCR sequencing experiments, and thereby enable reliable detection of disease-relevant TCRs for diagnostic applications.
Keywords: T-cell receptor; TCRpower and adaptive immune receptor repertoire sequencing; bulk T-cell receptor sequencing; computational model; spike-in standards.
© The Author(s) 2022. Published by Oxford University Press.
Figures
Similar articles
-
[T cell repertoires correlate with pathogenesis of chronic idiopathic thrombocytopenic purpura].Zhonghua Yi Xue Za Zhi. 2005 Dec 14;85(47):3316-22. Zhonghua Yi Xue Za Zhi. 2005. PMID: 16409835 Chinese.
-
Identification of clonally expanded T-cell receptor sequences in giant cell arteritis.J Autoimmun. 2025 Feb;151:103372. doi: 10.1016/j.jaut.2025.103372. Epub 2025 Feb 3. J Autoimmun. 2025. PMID: 39904264
-
TCR meta-clonotypes for biomarker discovery with tcrdist3 enabled identification of public, HLA-restricted clusters of SARS-CoV-2 TCRs.Elife. 2021 Nov 30;10:e68605. doi: 10.7554/eLife.68605. Elife. 2021. PMID: 34845983 Free PMC article.
-
T Cell Receptor Repertoire Sequencing.Methods Mol Biol. 2020;2204:3-12. doi: 10.1007/978-1-0716-0904-0_1. Methods Mol Biol. 2020. PMID: 32710310 Review.
-
Application of the molecular analysis of the T-cell receptor repertoire in the study of immune-mediated hematologic diseases.Hematology. 2003 Jun;8(3):173-81. doi: 10.1080/1024533031000107505. Hematology. 2003. PMID: 12745651 Review.
Cited by
-
Enhancing comparative T cell receptor repertoire analysis in small biological samples through pooling homologous cell samples from multiple mice.Cell Rep Methods. 2024 Apr 22;4(4):100753. doi: 10.1016/j.crmeth.2024.100753. Epub 2024 Apr 12. Cell Rep Methods. 2024. PMID: 38614088 Free PMC article.
-
Detecting T-cell clonal expansions and quantifying clone survival using deep profiling of immune repertoires.Front Immunol. 2024 Apr 3;15:1321603. doi: 10.3389/fimmu.2024.1321603. eCollection 2024. Front Immunol. 2024. PMID: 38633256 Free PMC article.
-
Development and characterization of human T-cell receptor (TCR) alpha and beta clones' library as biological standards and resources for TCR sequencing and engineering.Biol Methods Protoc. 2024 Sep 5;9(1):bpae064. doi: 10.1093/biomethods/bpae064. eCollection 2024. Biol Methods Protoc. 2024. PMID: 39507623 Free PMC article.
-
T-Cell Receptor Repertoire Sequencing and Its Applications: Focus on Infectious Diseases and Cancer.Int J Mol Sci. 2022 Aug 2;23(15):8590. doi: 10.3390/ijms23158590. Int J Mol Sci. 2022. PMID: 35955721 Free PMC article. Review.
-
TCR sequencing and cloning methods for repertoire analysis and isolation of tumor-reactive TCRs.Cell Rep Methods. 2023 Apr 24;3(4):100459. doi: 10.1016/j.crmeth.2023.100459. eCollection 2023 Apr 24. Cell Rep Methods. 2023. PMID: 37159666 Free PMC article.
References
-
- Manojlović LM. Photometry-based estimation of the total number of stars in the Universe. Appl Optics 2015;54(21):6589–91. - PubMed
-
- Liu X, Zhang W, Zhao M, et al. T cell receptor β repertoires as novel diagnostic markers for systemic lupus erythematosus and rheumatoid arthritis. Ann Rheum Dis 2019;78(8):1070–8. - PubMed
