. 2022 Feb:146:112377.
doi: 10.1016/j.biopha.2021.112377. Epub 2022 Jan 2.

CYP450 drug inducibility in NAFLD via an in vitro hepatic model: Understanding drug-drug interactions in the fatty liver

Affiliations

CYP450 drug inducibility in NAFLD via an in vitro hepatic model: Understanding drug-drug interactions in the fatty liver

Camilo Rey-Bedon et al. Biomed Pharmacother. 2022 Feb.

Abstract

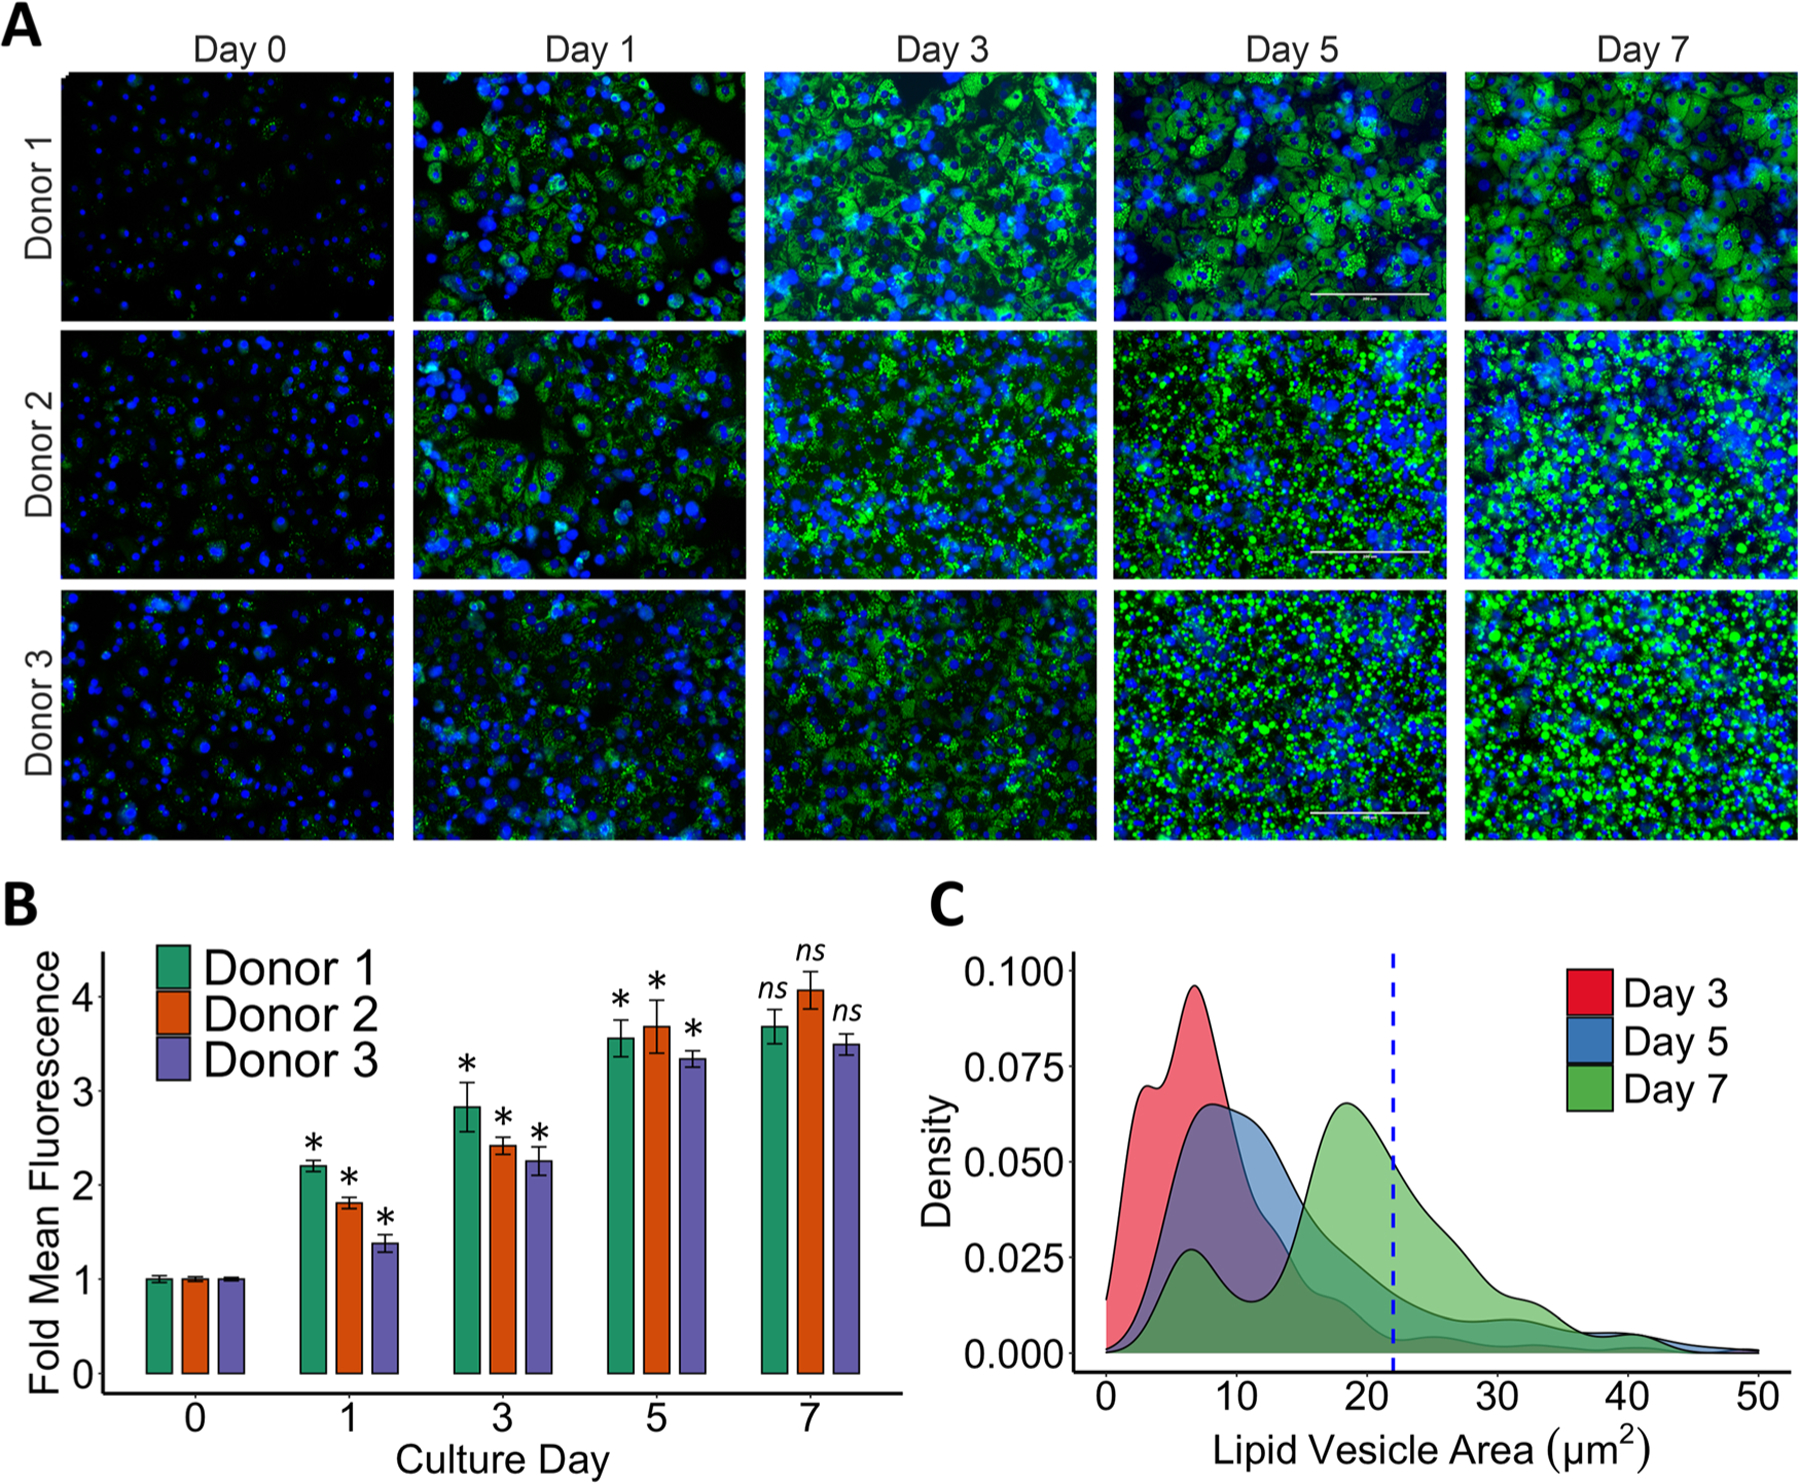
Drug-drug-interactions (DDIs) occur when a drug alters the metabolic rate, efficacy, and toxicity of concurrently used drugs. While almost 1 in 4 adults now use at least 3 concurrent prescription drugs in the United States, the Non-alcoholic fatty liver disease (NAFLD) prevalence has also risen over 25%. The effect of NALFD on DDIs is largely unknown. NAFLD is characterized by lipid vesicle accumulation in the liver, which can progress to severe steatohepatitis (NASH), fibrosis, cirrhosis, and hepatic carcinoma. The CYP450 enzyme family dysregulation in NAFLD, which might already alter the efficacy and toxicity of drugs, has been partially characterized. Nevertheless, the drug-induced dysregulation of CYP450 enzymes has not been studied in the fatty liver. These changes in enzymatic inducibility during NAFLD, when taking concurrent drugs, could cause unexpected fatalities through inadvertent DDIs. We have, thus, developed an in vitro model to investigate the CYP450 transcriptional regulation in NAFLD. Specifically, we cultured primary human hepatocytes in a medium containing free fatty acids, high glucose, and insulin for seven days. These cultures displayed intracellular macro-steatosis after 5 days and cytokine secretion resembling NAFLD patients. We further verified the model's dysregulation in the transcription of key CYP450 enzymes. We then exposed the NAFLD model to the drug inducers rifampicin, Omeprazole, and Phenytoin as activators of transcription factors pregnane X receptor (PXR), aryl hydrocarbon receptor (AHR) and constitutive androstane receptor (CAR), respectively. In the NAFLD model, Omeprazole maintained an expected induction of CYP1A1, however Phenytoin and Rifampicin showed elevated induction of CYP2B6 and CYP2C9 compared to healthy cultures. We, thus, conclude that the fatty liver could cause aggravated drug-drug interactions in NAFLD or NASH patients related to CYP2B6 and CYP2C9 enzymes.

Keywords: CYP450; Drug metabolism; Drug-drug interaction; Lipid accumulation; Non-alcoholic fatty liver disease; Primary human hepatocyte.


Conflict of interest statement

Conflict of interest statement

Dr. Uygun has a financial interest in Organ Solutions, a company focused on developing organ preservation technology. Other authors declare no financial interest related to this study. Interests of all authors are managed by the MGH and Partners Health Care in accordance with their conflict of interest policies.

Figures

Fig. 1.
Fig. 1.
Morphology and maintenance of hepatic phenotype in the in vitro NAFLD model and healthy controls overtime. (A) Representative phase contrast bright field images of healthy and steatotic (fatty) hepatocytes over 7 days of culture in corresponding media. Scalebar: 400 µm. (B) Daily Urea and Albumin secretion of each PHH donor over the healthy and steatotic culture period. Results are presented as daily mean ± SEM (n = 4 biological replicates for each PHH Donor).
Fig. 2.
Fig. 2.
Staining and quantification of intracellular lipid accumulation overtime. (A) Fluorescent images of AdipoRed® staining (green) and nuclear Hoechst 33342 dye (blue) after 1, 3, 5 and 7 days of lipid accumulation. Scalebar: 200 µm. (B) Total mean fluorescence intensity (MFI) quantification of green channel normalized to day 0 for each donor. Results are presented as daily mean ± SEM for nine independent cultures (n = 3 biological replicates for each donor). (C) Lipid vesicle size distribution after 3, 5 or 7 days of steatotic culturing for all donors. Dotted blue line represents the mean size of the hepatocyte nuclei measured from blue channel. Welch’s t-tests were used to determine statistical significance of mean fluorescence compared to the previous day’s culture for each donor. Abbreviation: ns P > 0.05, *P < 0.05, ** P < 0.01. (For interpretation of the references to colour in this figure legend, the reader is referred to the web version of this article.)
Fig. 3.
Fig. 3.
Secretion of inflammatory cytokines in the in vitro NAFLD model compared to healthy controls after 7 days of culture. (A) VEGF. (B) MCP-1. (C) IP-10. (D) IL-1ra. Cytokines were measured via a Luminex™ magnetic bead panel. Regulation of the same cytokines in healthy controls from Day 1 to Day 7 are presented in Supporting Fig. S3. Data are presented as mean ± SEM (n = 9, 3 donors with 3 biological replicates or more for each comparison). A Welch’s t-test was used to determine statistical significance. Statistical details can be found in Supporting Table S3. Abbreviation: ns P > 0.05, *P < 0.05, ** P < 0.01.
Fig. 4.
Fig. 4.
Transcriptional dysregulation of CYP450 enzymes in the NAFLD model compared to Healthy controls. Fold values were calculated via ddCT comparative method of RT-PCR data. Results are presented as mean ± SEM (n = 9, 3 donors with 3 biological replicates each, or more for each comparison). A Welch’s t-test was performed to determine statistical significance. Statistical analysis details can be found in Supporting Table S4. Abbreviation: ns P > 0.05, *P < 0.05, ** P < 0.01
Fig. 5.
Fig. 5.
Drug induction of CYP450 enzymes’ transcription in the in vitro NAFLD model (green) compared to Healthy controls (Blue). Transcriptional regulation of (A) CYP1A1 with 50 µM Omeprazole, (B) CYP2B6 with 50 µM Phenytoin, (C) CYP2C9 with 25 µM Rifampicin and (D) CYP3A4 with 25 µM Rifampicin. Results are presented as box and whiskers (n = 9, 3 donors with 3 biological replicates each, or more for each comparison). A Welch’s t-test was performed to determine statistical significance. Statistical details can be found in Supporting Table S5. Abbreviation: Ome., Omeprazole. Rif., Rifampicin. Phe., Phenytoin. ns P > 0.05, *P < 0.05, ** P < 0.01. (For interpretation of the references to colour in this figure legend, the reader is referred to the web version of this article.)

References

    1. Kucera O, Cervinkova Z, Experimental models of non-alcoholic fatty liver disease in rats, World J. Gastroenterol 20 (26) (2014) 8364–8376. - PMC - PubMed
    1. Boeckmans J, Natale A, Buyl K, Rogiers V, De Kock J, Vanhaecke T, Rodrigues RM, Human-based systems: mechanistic NASH modelling just around the corner? Pharm. Res 134 (2018) 257–267. - PubMed
    1. Bhatia LS, Curzen NP, Byrne CD, Non-alcoholic fatty liver disease and vascular risk, Curr. Opin. Cardiol 27 (4) (2012) 420–428. - PubMed
    1. Benedict M, Zhang X, Non-alcoholic fatty liver disease: an expanded review, World J. Hepatol 9 (16) (2017) 715–732. - PMC - PubMed
    1. Younossi ZM, Stepanova M, Rafiq N, Henry L, Loomba R, Makhlouf H, Goodman Z, Non-alcoholic steatofibrosis independently predicts mortality in non-alcoholic fatty liver disease, Hepatol. Commun 1 (5) (2017) 421–428. - PMC - PubMed

MeSH terms

Substances