. 2021 Dec 30;14(1):60.
doi: 10.3390/v14010060.

The Thiazole-5-Carboxamide GPS491 Inhibits HIV-1, Adenovirus, and Coronavirus Replication by Altering RNA Processing/Accumulation

Affiliations

The Thiazole-5-Carboxamide GPS491 Inhibits HIV-1, Adenovirus, and Coronavirus Replication by Altering RNA Processing/Accumulation

Subha Dahal et al. Viruses. .

Abstract

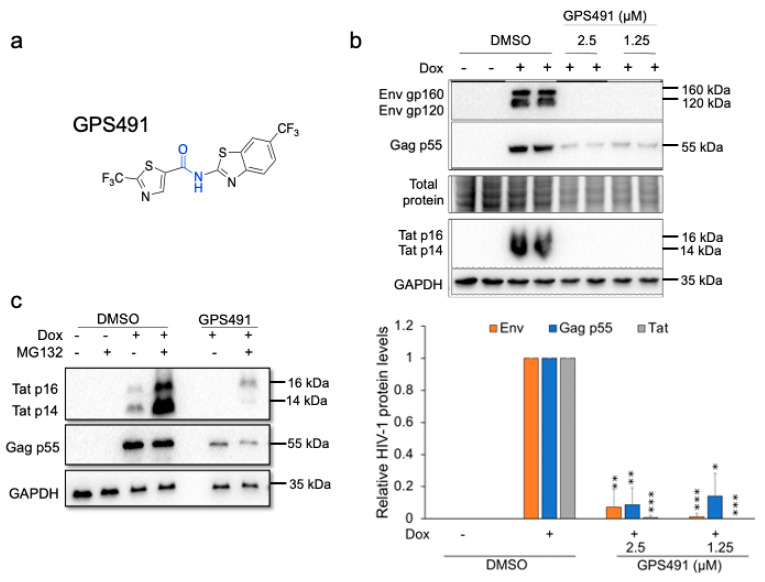
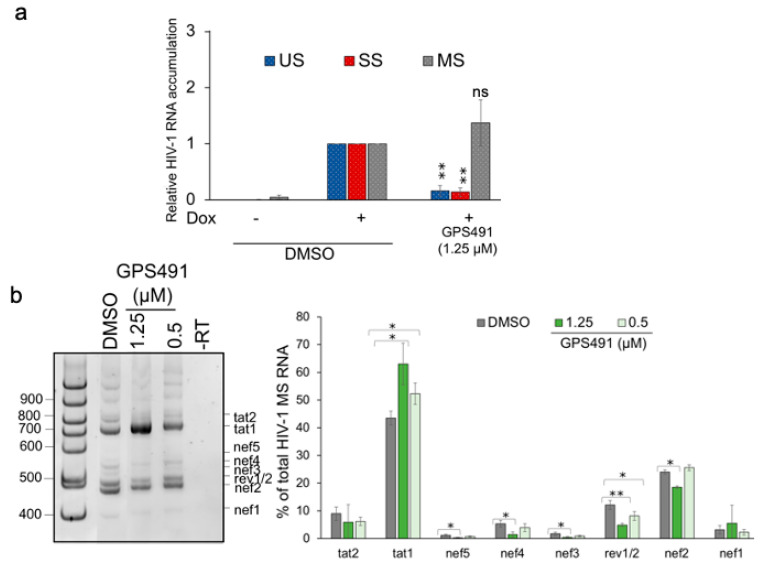
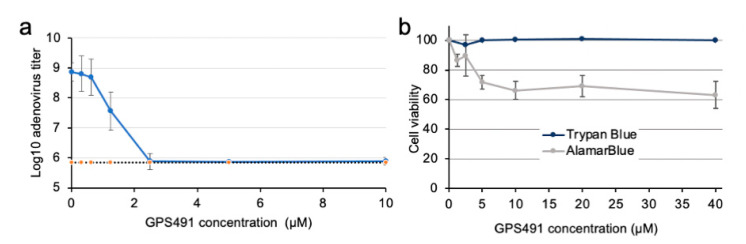
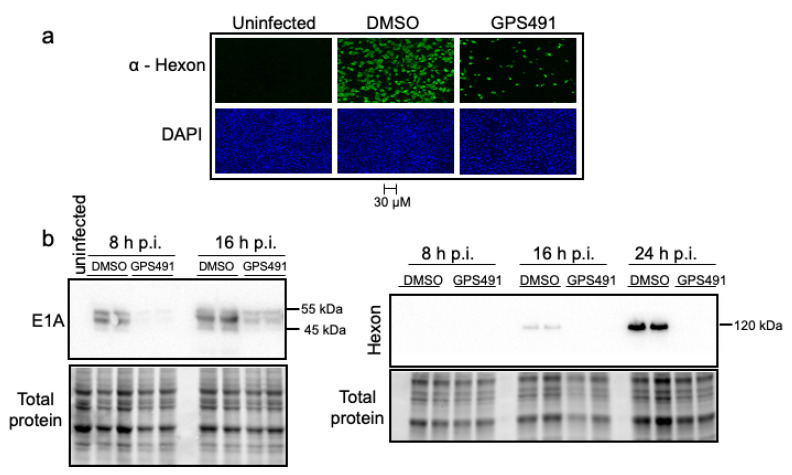
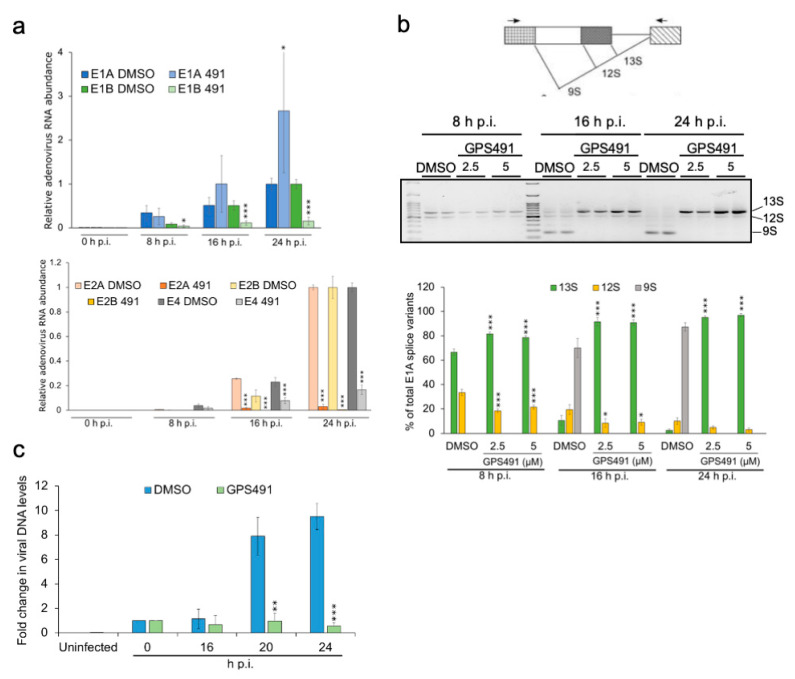
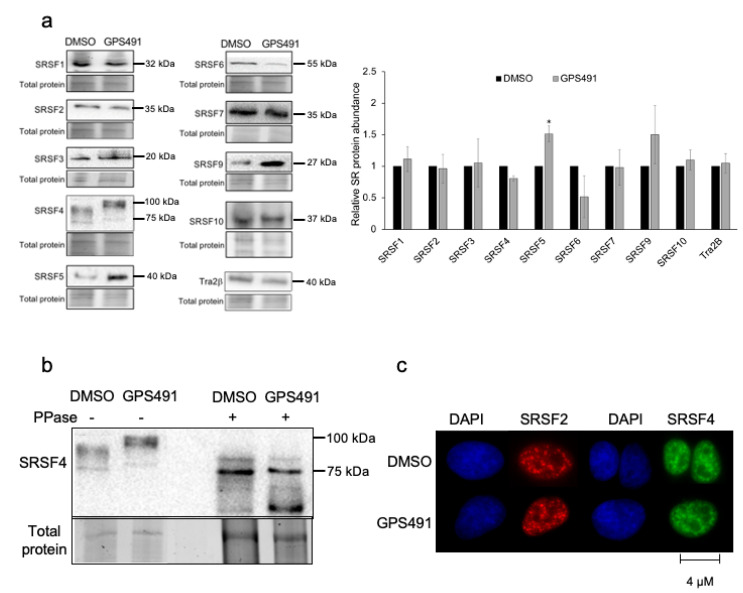
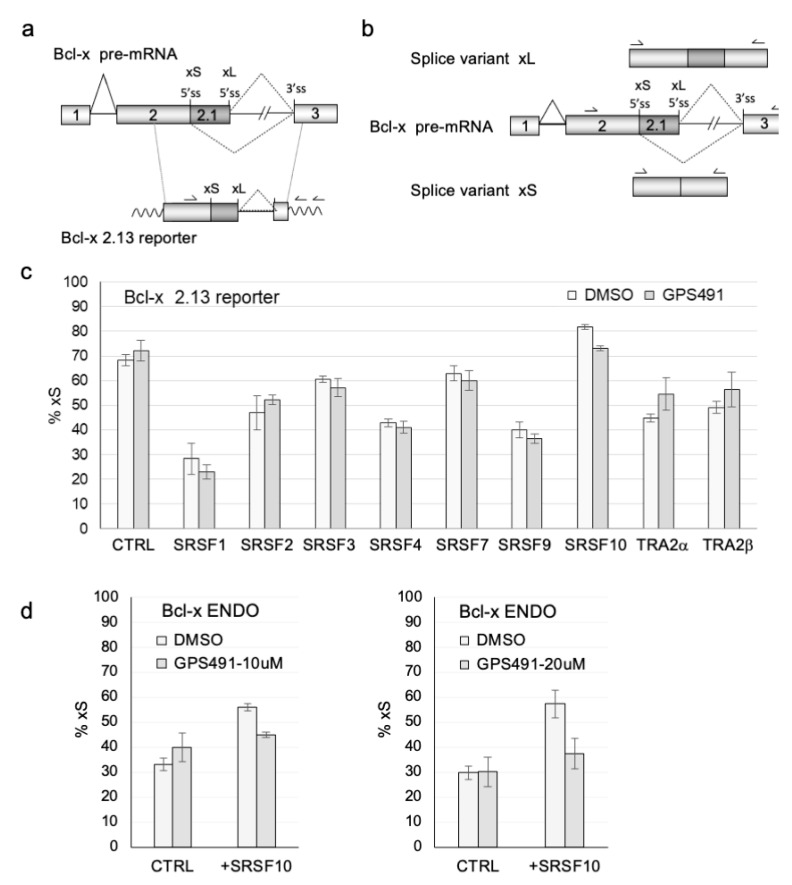
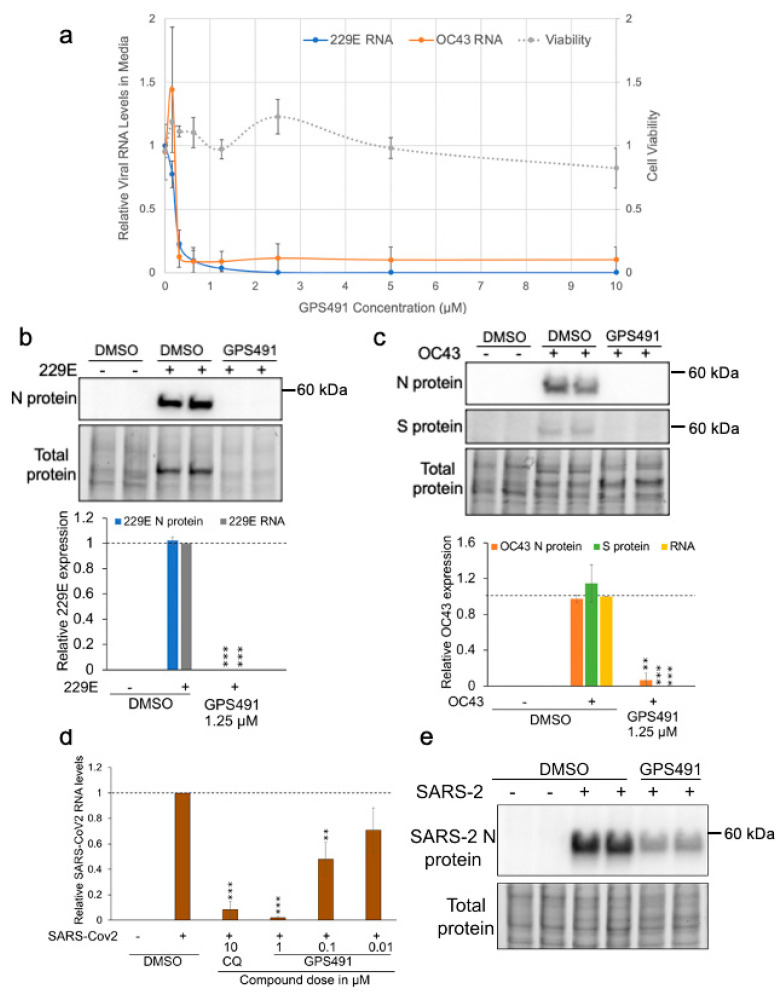
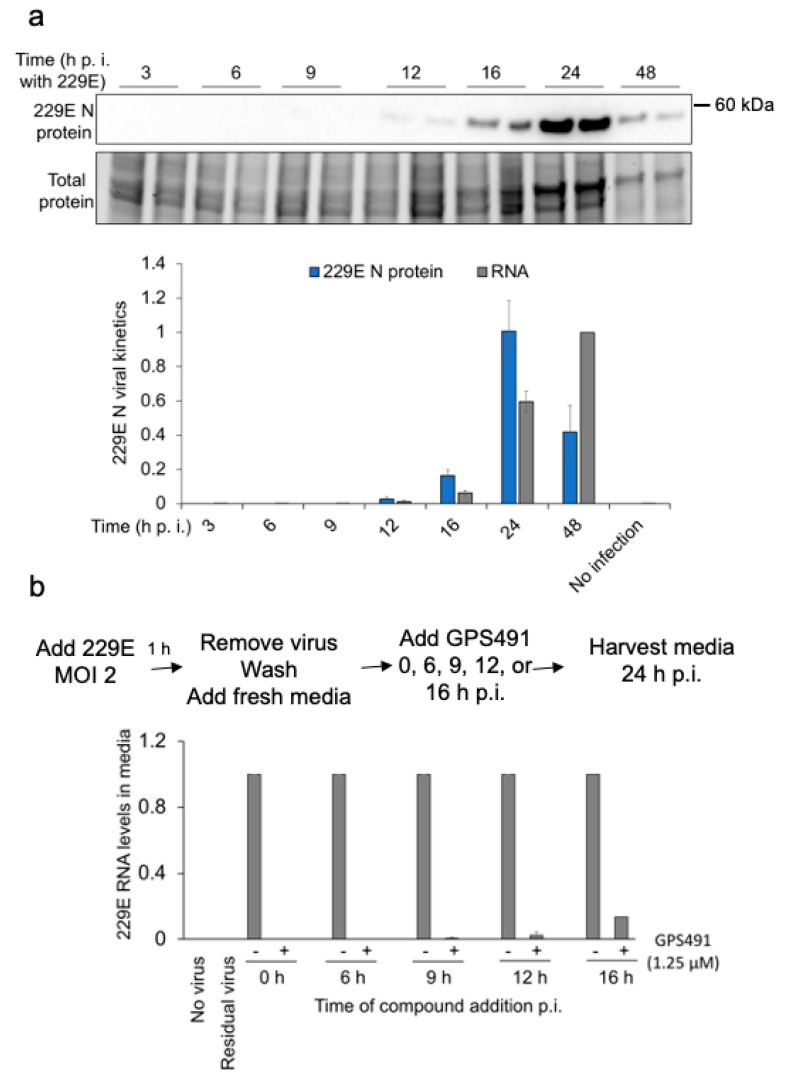
Medicinal chemistry optimization of a previously described stilbene inhibitor of HIV-1, 5350150 (2-(2-(5-nitro-2-thienyl)vinyl)quinoline), led to the identification of the thiazole-5-carboxamide derivative (GPS491), which retained potent anti-HIV-1 activity with reduced toxicity. In this report, we demonstrate that the block of HIV-1 replication by GPS491 is accompanied by a drastic inhibition of viral gene expression (IC50 ~ 0.25 µM), and alterations in the production of unspliced, singly spliced, and multiply spliced HIV-1 RNAs. GPS491 also inhibited the replication of adenovirus and multiple coronaviruses. Low µM doses of GPS491 reduced adenovirus infectious yield ~1000 fold, altered virus early gene expression/viral E1A RNA processing, blocked viral DNA amplification, and inhibited late (hexon) gene expression. Loss of replication of multiple coronaviruses (229E, OC43, SARS-CoV2) upon GPS491 addition was associated with the inhibition of viral structural protein expression and the formation of virus particles. Consistent with the observed changes in viral RNA processing, GPS491 treatment induced selective alterations in the accumulation/phosphorylation/function of splicing regulatory SR proteins. Our study establishes that a compound that impacts the activity of cellular factors involved in RNA processing can prevent the replication of several viruses with minimal effect on cell viability.

Keywords: HIV-1; RNA processing; adenovirus; coronavirus; inhibitor.


Conflict of interest statement

The authors declare no conflict of interest.

Figures

Figure 1
Figure 1
GPS491 inhibits expression of multiple HIV-1 proteins. (a) Chemical structure of GPS491. HeLa rtTA HIV∆mls cells were treated with either 2.5 µM or 1.25 µM GPS491. Cells grown with or without doxycycline (Dox) with 1% DMSO served as positive and negative controls, respectively. Cells were harvested for HIV-1 protein and RNA analyses after 24 h of induction. (b) Shown are representative Western blots showing the effects of compounds on HIV-1 Gag, Env, and Tat levels. Below is a summary of n = 3 independent experiments; data are indicated as mean ± SD; * p ≤ 0.05, ** p ≤ 0.01, and *** p ≤ 0.001. (c) Proteasome inhibition reverses the effect of GPS491 on Tat but not Gag expression. HeLa rtTA HIV∆mls cells were treated with DMSO or GPS491 +/− Dox for 24 h. Cells were treated with or without MG132 8 h prior to harvest, lysates were fractionated on 10% stain-free gels or 14% SDS PAGE gels, and the resulting blots were probed for HIV-1 Gag or Tat, respectively. Band intensity was quantified relative to Dox-induced DMSO control and normalized to total protein load (Stainfree) for Gag blot or normalized to GAPDH for Tat blot using Bio-Rad ImageLab software.
Figure 2
Figure 2
Effects of GPS491 on HIV-1 RNA accumulation and processing. HeLa rtTA HIV∆mls cells were treated with DMSO or varying concentrations of GPS491 +/− doxycycline (Dox) for 24 h. Cells were then harvested, total RNA was extracted, and cDNA was generated. Samples were subsequently analyzed (a) by RT-qPCR to measure levels of HIV-1 US, SS, and MS RNA levels or (b) by RT-PCR to measure levels of different MS RNA isoforms. Shown is a representative gel and summary quantitation of results from n > 3 independent assays. Data are indicated as mean ± SD, * p ≤ 0.05, ** p ≤ 0.01, ns—not significant.
Figure 3
Figure 3
GPS491 inhibits adenovirus (HAdV-C5) replication in A549 cells. (a) A549 cells were uninfected or infected with human adenovirus serotype 5 (HAdV-C5) at an input MOI of 100 IU/cell for 1 h after which the virus inoculum was removed and replaced with media containing DMSO or the indicated concentrations of GPS491. After 24 h, the virus was harvested by scraping cells into the culture fluid and the cell suspension was collected for titration of infectious virus by endpoint dilution (blue line). T0 (dotted line, orange dots) is a sample harvested immediately after the 1 h adsorption period to measure the residual virus from the inoculum. Error bars represent the standard deviation of three independent experiments. (b) A549 cells were treated with the indicated doses of GPS491 for 24 h and then assessed for changes in metabolic activity by alamarBlue (grey line) or for viability by staining with trypan blue (blue line).
Figure 4
Figure 4
GPS491 delays E1A production and inhibits adenovirus hexon expression. A549 cells were infected with HAdV-C5 at an input MOI of 100 IU/cell for 1 h after which the virus inoculum was removed and replaced with media containing DMSO or GPS491 (2.5 µM). (a) Cells were fixed 24 h after infection and hexon expression assessed by immunofluorescence. Scale is the same for all images. (b) Cells were harvested 8 h, 16 h, or 24 h p.i. and lysates were fractionated on SDS-PAGE gels. Shown are the representative Western blots showing the expression levels of E1A and hexon proteins in the control versus treated lysates.
Figure 5
Figure 5
GPS491 alters adenovirus RNA expression/processing and inhibits adenovirus DNA amplification. A549 cells were infected with HAdV-C5 at an input MOI of 100 IU/cell for 1 h after which virus inoculum was removed and replaced with media containing DMSO or GPS491 (2.5 or 5 µM). (a) Total RNA was extracted at 8 h, 16 h, or 24 h after virus infection. After cDNA generation, RT-qPCR was performed using primers for E1A, E1B, E2A, E2B, and E4 RNAs (Supplementary Table S1). Values are expressed relative to RNA abundance observed 24 h p.i. in the presence of 1% DMSO. Shown are data from samples treated with 2.5 µM GPS491. (b) The effect of GPS491 on E1A RNA processing. Shown on the top is the schematic diagram of E1A RNA processing indicating the major E1A mRNA isoforms generated by alternative splicing. In the middle is a representative gel of the E1A RNA amplicons generated from cDNA. The graph on the bottom represents quantitation of amplicons generated across n > 3 independent assays. (c) At 16 h, 20 h, and 24 h p.i., total DNA was isolated from cells treated with DMSO or 2.5 µM GPS491 and levels of adenoviral DNA were determined by qPCR. Data are indicated as mean ± SD, * p ≤ 0.05, ** p ≤ 0.01, and *** p ≤ 0.001.
Figure 6
Figure 6
GPS491 alters expression and phosphorylation of selected SR proteins. HeLa rtTA HIV∆mls cells were treated with DMSO or GPS491 (2.5 µM) and induced with Dox. Twenty hours post induction, cells were harvested in RIPA buffer containing a phosphatase inhibitor cocktail and fractionated on 10% stain-free SDS-PAGE gels. (a) Representative Western blots for each SR protein are shown. At the right, a summary of Western blots from three independent assays measuring the effect of GPS491 on SR proteins levels relative to DMSO-treated cells. Asterisks (*) represent changes in expression level at p < 0.05. (b) Cell lysates were mock-treated or treated with alkaline phosphatase (PPase) prior to loading onto 10% stain-free gels. After transfer onto PVDF, blots were probed for SRSF4. Blots are representative of n > 3 independent assays. (c) Cells treated with DMSO or GPS491 were fixed and permeabilized followed by staining with antibodies to either SRSF2 or SRSF4. DAPI was used to stain for cell nuclei. Images were captured on Leica DMR Microscope at 63× oil immersion.
Figure 7
Figure 7
GPS491 alters the function of only a subset of SR proteins. (a) Map depicting the Bcl-x pre-mRNA and the Bcl-x minigene 2.13 as well as the position of the primers used for RT-PCR. (b) Map of the endogenous Bcl-x gene and spliced products Bcl-xS and Bcl-xL. Positions of primers for RT-PCR are indicated. (c) HEK 293 cells were transfected with Bcl-x reporter along with plasmids expressing the indicated SR proteins, followed by treatment with DMSO or 10 μM GPS491. After 48 h, total RNA was isolated and RT-PCR was performed. The relative abundance of the xL and xS products was determined following fractionation on PAGE gels. (d) Assays were repeated with overexpression of SRSF10 in the presence of DMSO and 10 or 20 µM GPS491, evaluating the effect on alternative splicing of the endogenous Bcl-x gene (Bcl-x ENDO). Representative gel images are provided in Supplementary Figure S3.
Figure 8
Figure 8
GPS491 inhibits replication of 229E, OC43, and SARS-CoV2 coronaviruses. (a) Huh7 cells were infected with either 229E or OC43 at an input MOI of 0.1 and 1, respectively, for 1 h. Virus inoculum was removed, cells were washed, and fresh media containing 1% DMSO or varying concentrations of GPS491 (from 0 µM to 10 µM) were added. Then, 2 days p.i (229E) or 4 days p.i. (OC43), media were harvested to quantitate viral genomic RNA levels by RT-qPCR assay. All the values are expressed relative to the values detected in virus-infected DMSO-treated samples. Effect of GPS491 on cell viability was assessed 2 days post compound addition using alamarBlue at the indicated doses of GPS491. Data are indicated as mean ± SD, ** p ≤ 0.01, and *** p ≤ 0.001. (b,c) Huh7 cells were infected with (b) 229E at an MOI of 0.03 or (c) OC43 at an MOI of 0.3 for 1 h after which the virus inoculum was removed, cells were washed with 1× PBS, and media containing 1% DMSO or 1.25 µM GPS491 were added. Cells and media were harvested 2 days (229E) or 4 days (OC43) p.i., and the levels of viral proteins (N, S) were determined by Western blot and virus production was assessed by RT-qPCR of the media (RNA). Shown are representative Western blots and their respective quantitation indicating the effects of GPS491 following infection with 229E and OC43, respectively. Band intensity was quantified relative to virus-infected control and normalized to total protein load (stain-free gels). Data are indicated as mean ± SD and generated from n = 3 independent assays, each performed in duplicate. (d,e) Huh7 cells were infected with SARS-CoV2 at an MOI of 1 for 1 h. Virus inoculum was removed, and fresh media containing DMSO, chloroquine (CQ, 10 µM), or indicated doses of GPS491 were added. Two days post infection, (d) media were harvested, and levels of virion production determined by RT-qPCR or (e) lysates from cells treated with 1% DMSO or 0.3 µM GPS491 were blotted to measure expression of viral N protein. Results shown were generated from n = 3 independent assays.
Figure 9
Figure 9
GPS491 inhibits 229E virus replication post entry. (a) Kinetics of 229E coronavirus N protein expression and virus release. Huh7 cells were infected at an input MOI of 2. After incubation of cells for 1 h, cells were washed to remove residual virus and fresh media were added. At indicated times post infection (p.i.), cells and media were harvested. Cell extracts were analyzed by Western blot for N protein expression, while RTqPCR was used to monitor levels of viral RNA in the media. Shown is a representative Western blot as well as a graphical summary of the quantitative results obtained from n = 3 independent assays. (b) Addition of GPS491 at late stages of 229E replication suppresses virus growth. Huh7 cells were infected at an input MOI of 2. After incubation of cells for 1 h, cells were washed to remove residual virus and fresh media were added. At indicated times post infection (p.i.), DMSO or GPS491 was added to cultures at a final concentration of 1.25 µM and incubation continued. At 24 h post-virus infection, media were harvested and the abundance of viral RNA in media was determined by RTqPCR.

References

    1. Chaudhuri S., Symons J.A., Deval J. Innovation and trends in the development and approval of antiviral medicines: 1987–2017 and beyond. Antivir. Res. 2018;155:76–88. doi: 10.1016/j.antiviral.2018.05.005. - DOI - PMC - PubMed
    1. Kumar N., Sharma S., Kumar R., Tripathi B.N., Barua S., Ly H., Rouse B.T. Host-Directed Antiviral Therapy. Clin. Microbiol. Rev. 2020;33:e00168-19. doi: 10.1128/CMR.00168-19. - DOI - PMC - PubMed
    1. Cakir M., Obernier K., Forget A., Krogan N.J. Target Discovery for Host-Directed Antiviral Therapies: Application of Proteomics Approaches. Msystems. 2021;6:e00388-21. doi: 10.1128/mSystems.00388-21. - DOI - PMC - PubMed
    1. Keener A.B. Host with the most: Targeting host cells instead of pathogens to fight infectious disease. Nat. Med. 2017;23:528–531. doi: 10.1038/nm0517-528. - DOI - PMC - PubMed
    1. Prussia A., Thepchatri P., Snyder J.P., Plemper R.K. Systematic approaches towards the development of host-directed antiviral therapeutics. Int. J. Mol. Sci. 2011;12:4027–4052. doi: 10.3390/ijms12064027. - DOI - PMC - PubMed

Publication types