

Evaluation of Clinical and Immune Responses in Recovered Children with Mild COVID-19
- PMID: 35062289
- PMCID: PMC8779549
- DOI: 10.3390/v14010085
Evaluation of Clinical and Immune Responses in Recovered Children with Mild COVID-19
Abstract
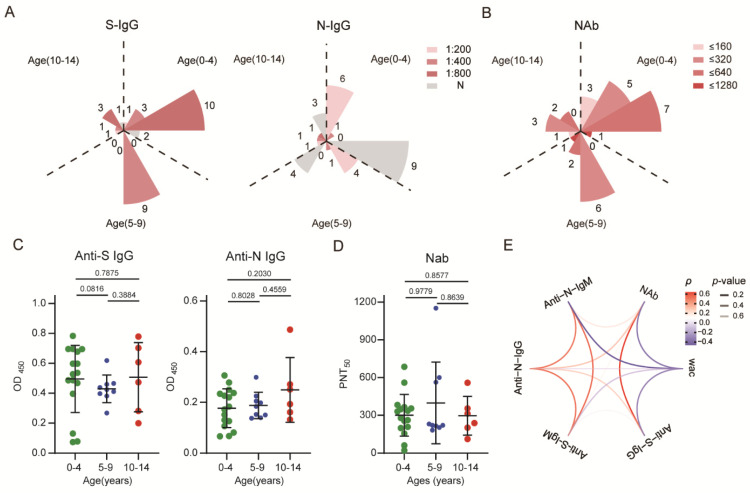
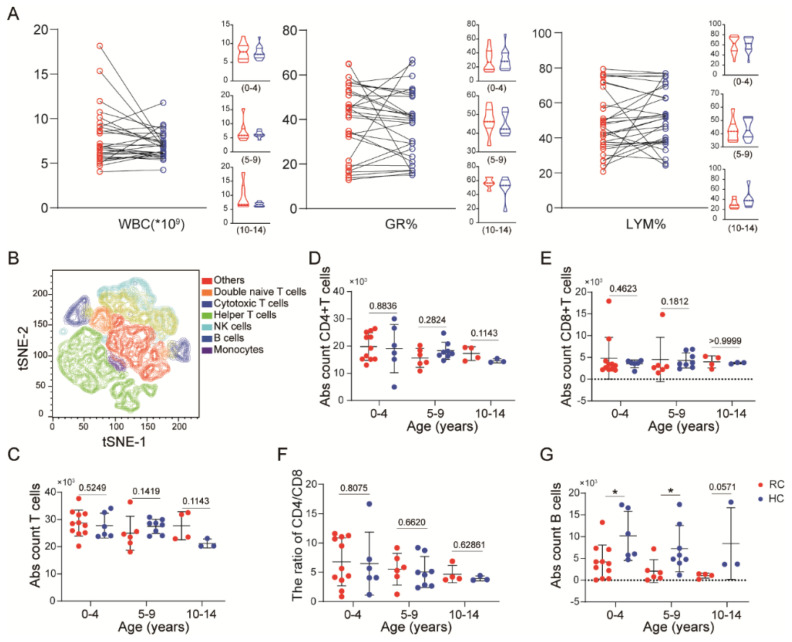
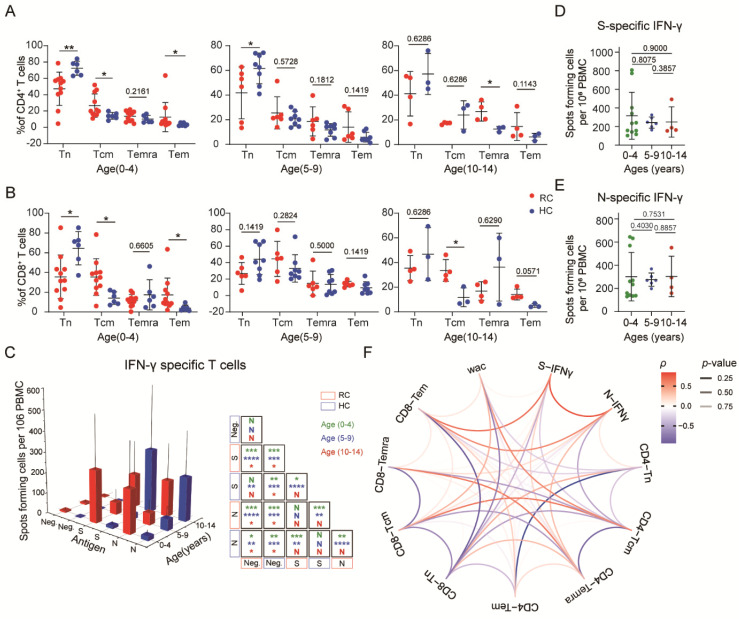
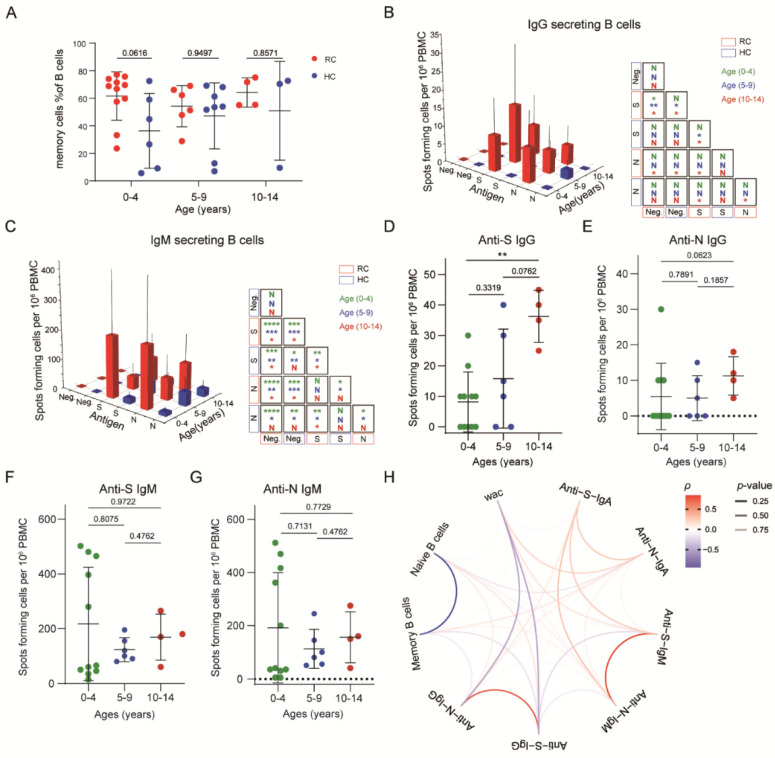
The coronavirus disease 2019 (COVID-19) has spread globally and variants continue to emerge, with children are accounting for a growing share of COVID-19 cases. However, the establishment of immune memory and the long-term health consequences in asymptomatic or mildly symptomatic children after severe acute respiratory syndrome coronavirus 2 infection are not fully understood. We collected clinical data and whole blood samples from discharged children for 6-8 months after symptom onset among 0-to-14-year-old children. Representative inflammation signs returned to normal in all age ranges. The infants and young children (0-4 years old) had lung lesions that persisted for 6-8 months and were less responsive for antigen-specific IgG secretion. In the 5-to-14-year-old group, lung imaging abnormalities gradually recovered, and the IgG-specific antibody response was strongest. In addition, we found a robust IgM+ memory B cell response in all age. Memory T cells specific for the spike or nucleocapsid protein were generated, with no significant difference in IFN-γ response among all ages. Our study highlights that although lung lesions caused by COVID-19 can last for at least 6-8 months in infants and young children, most children have detectable residual neutralizing antibodies and specific cellular immune responses at this stage.
Keywords: SARS-CoV-2; clinical; immune responses; mild COVID-19; recovered children.
Conflict of interest statement
The authors declare no conflict of interest. The funders had no role in the design of the study; in the collection, analyses, or interpretation of data; in the writing of the manuscript, or in the decision to publish the results.
Figures
Similar articles
-
Quantitative SARS-CoV-2 Serology in Children With Multisystem Inflammatory Syndrome (MIS-C).Pediatrics. 2020 Dec;146(6):e2020018242. doi: 10.1542/peds.2020-018242. Epub 2020 Sep 2. Pediatrics. 2020. PMID: 32879033
-
Longitudinal Profiling of Antibody Response in Patients With COVID-19 in a Tertiary Care Hospital in Beijing, China.Front Immunol. 2021 Mar 15;12:614436. doi: 10.3389/fimmu.2021.614436. eCollection 2021. Front Immunol. 2021. PMID: 33790892 Free PMC article.
-
Declining Levels of Neutralizing Antibodies Against SARS-CoV-2 in Convalescent COVID-19 Patients One Year Post Symptom Onset.Front Immunol. 2021 Jun 16;12:708523. doi: 10.3389/fimmu.2021.708523. eCollection 2021. Front Immunol. 2021. PMID: 34220870 Free PMC article.
-
Rapid generation of durable B cell memory to SARS-CoV-2 spike and nucleocapsid proteins in COVID-19 and convalescence.Sci Immunol. 2020 Dec 22;5(54):eabf8891. doi: 10.1126/sciimmunol.abf8891. Sci Immunol. 2020. PMID: 33443036 Free PMC article.
-
Characterization of SARS-CoV-2-Specific Humoral and Cellular Immune Responses Induced by Inactivated COVID-19 Vaccines in a Real-World Setting.Front Immunol. 2021 Dec 22;12:802858. doi: 10.3389/fimmu.2021.802858. eCollection 2021. Front Immunol. 2021. PMID: 35003131 Free PMC article.
Cited by
-
Behavior of immunoglobulin G antibodies for SARS-COV-2 in Mexican pediatric patients with comorbidities: a prospective comparative cohort study.Transl Pediatr. 2023 Jul 31;12(7):1319-1326. doi: 10.21037/tp-22-454. Epub 2023 Jul 12. Transl Pediatr. 2023. PMID: 37575905 Free PMC article.
-
Role of IgM Memory B Cells and Spleen Function in COVID-19.Front Immunol. 2022 Jun 30;13:889876. doi: 10.3389/fimmu.2022.889876. eCollection 2022. Front Immunol. 2022. PMID: 35844543 Free PMC article. Review.
-
Molecular Determinants of the Early Life Immune Response to COVID-19 Infection and Immunization.Vaccines (Basel). 2023 Feb 22;11(3):509. doi: 10.3390/vaccines11030509. Vaccines (Basel). 2023. PMID: 36992093 Free PMC article. Review.
-
The association between chronic underlying diseases and the clinical characteristics in adult patients infected with Omicron BA.1.J Virus Erad. 2025 Mar 14;11(2):100591. doi: 10.1016/j.jve.2025.100591. eCollection 2025 Jun. J Virus Erad. 2025. PMID: 40213468 Free PMC article.
-
A Systematic Review of Persistent Clinical Features After SARS-CoV-2 in the Pediatric Population.Pediatrics. 2023 Aug 1;152(2):e2022060351. doi: 10.1542/peds.2022-060351. Pediatrics. 2023. PMID: 37476923 Free PMC article.
References
-
- Hui D.S., Azhar E.I., Madani T.A., Ntoumi F., Kock R., Dar O., Ippolito G., McHugh T.D., Memish Z.A., Drosten C., et al. The continuing 2019-nCoV epidemic threat of novel coronaviruses to global health—The latest 2019 novel coronavirus outbreak in Wuhan, China. Int. J. Infect. Dis. 2020;91:264–266. doi: 10.1016/j.ijid.2020.01.009. - DOI - PMC - PubMed
-
- Sekine T., Perez-Potti A., Rivera-Ballesteros O., Strålin K., Gorin J.B., Olsson A., Llewellyn-Lacey S., Kamal H., Bogdanovic G., Muschiol S., et al. Robust T Cell Immunity in Convalescent Individuals with Asymptomatic or Mild COVID-19. Cell. 2020;183:158–168.e14. doi: 10.1016/j.cell.2020.08.017. - DOI - PMC - PubMed
Publication types
MeSH terms
Substances
LinkOut - more resources
Full Text Sources
Medical
Miscellaneous
