Review
. 2022 Jan 7;22(2):442.
doi: 10.3390/s22020442.

Wearable Sensors and Machine Learning for Hypovolemia Problems in Occupational, Military and Sports Medicine: Physiological Basis, Hardware and Algorithms

Affiliations
Review

Wearable Sensors and Machine Learning for Hypovolemia Problems in Occupational, Military and Sports Medicine: Physiological Basis, Hardware and Algorithms

Jacob P Kimball et al. Sensors (Basel). .

Abstract

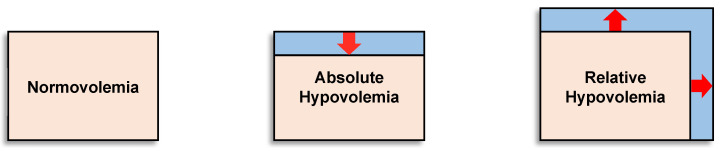
Hypovolemia is a physiological state of reduced blood volume that can exist as either (1) absolute hypovolemia because of a lower circulating blood (plasma) volume for a given vascular space (dehydration, hemorrhage) or (2) relative hypovolemia resulting from an expanded vascular space (vasodilation) for a given circulating blood volume (e.g., heat stress, hypoxia, sepsis). This paper examines the physiology of hypovolemia and its association with health and performance problems common to occupational, military and sports medicine. We discuss the maturation of individual-specific compensatory reserve or decompensation measures for future wearable sensor systems to effectively manage these hypovolemia problems. The paper then presents areas of future work to allow such technologies to translate from lab settings to use as decision aids for managing hypovolemia. We envision a future that incorporates elements of the compensatory reserve measure with advances in sensing technology and multiple modalities of cardiovascular sensing, additional contextual measures, and advanced noise reduction algorithms into a fully wearable system, creating a robust and physiologically sound approach to manage physical work, fatigue, safety and health issues associated with hypovolemia for workers, warfighters and athletes in austere conditions.

Keywords: cardiac decompensation; compensatory reserve; dehydration; environmental stress and adaptation; physical work capabilities; wearable sensors.


Conflict of interest statement

O.T.I. is a Scientific Advisor to Physiowave, Inc. and a Co-Founder, Chief Scientific Advisor, and Board Member for Cardiosense, Inc. The other authors declare no conflict of interest. The funders had no role in the design of the study; in the collection, analyses or interpretation of data; in the writing of the manuscript, or in the decision to publish the results.

Figures

Figure 1
Figure 1
Illustration of the concept of absolute and relative hypovolemia. Pink represents the vascular (blood) volume and blue represents the vascular space. Absolute hypovolemia (reduction in blood/plasma volume) can be mediated by factors such as hemorrhage or dehydration; relative hypovolemia can be mediated by factors that increase vascular space such as increased cutaneous vasodilation from heat stress, hypoxia, intense physical exercise, or systemic vasodilation from sepsis. Image modified from [15].
Figure 2
Figure 2
Linear regression of plasma volume loss (hypovolemia) and body water deficit (percent change in body mass) relationship for hypertonic (sweat loss) and isotonic (Furosimide diuretic) dehydration [16].
Figure 3
Figure 3
Ventricular function curves showing the sequence of cardiovascular events during hypovolemia while performing an occupational work activity. Hypovolemia causes reduced ventricular filling or preload (1). Then, the body compensates by increased sympathetic tone, resulting in elevated heart rate and cardiac contractility (2). During physical activity, the worker periodically performs upper limb isometric tasks, thus increasing afterload (3). The result is decreased stroke volume and increased myocardial oxygen demands.
Figure 4
Figure 4
Demonstration of the impact of skin warming on skin temperature (Ts), rectal temperature (TR),blood temperature from right atrium (TB), total peripheral resistance (TPR), right atrial mean pressure (RAMP), aortic mean pressure (AoMP), central blood volume (CBV), stroke volume (SV), and heart rate (HR) and cardiac output (CO). Image from [45].
Figure 5
Figure 5
The conceptual framework of the compensatory reserve measure (CRM) algorithm. The input waveform from the current subject is compared to a library of more than 650,000 waveforms recordings collected from more than 260 subjects exposed to experimentally-controlled progressive reductions in central blood volume by lower-body negative pressure to generate an estimated individual compensatory reserve measurement (CRM). Image modified from [50].
Figure 6
Figure 6
Compensatory reserve measures for normothermic vs hyperthermic subjects (left) and euhydrated vs dehydrated subjects (right) during progressive lower body negative pressure (LBNP) experiments. Data are means and 95% confidence intervals, with the solid lines at the bottom indicating statistically significant differences from baseline. Image modified from [13].
Figure 7
Figure 7
Compensatory reserve measure responses to progressive increases in aerobic exercise intensity (percent maximal aerobic power) that result in maximal exertion (left). On the (right), low baseline CRM (filled circles with 95% confidence intervals) is associated with lower maximal aerobic power (VO2max) compared to subjects with high initial CRM (open circles with 95% confidence intervals) with the final difference shown by the red arrow on the x-axis. Image from [13].
Figure 8
Figure 8
Compensatory reserve measured in a human subject during a 20-min graded cycle ergometer exercise performed at 100 °F air temperature. Each bar represents the average response over 1 min. Bar colors: green, compensatory reserve >60%; yellow, compensatory reserve ≤60% and >30%; red, compensatory reserve ≤30%. BL, baseline; W, watts. Image modified from [52].
Figure 9
Figure 9
Compensatory reserve measures before and after 45 min of running exercise in the heat and resting recovery (10 min) and then fluid replacement (black line). Bar colors: green, compensatory reserve >60%; yellow, compensatory reserve ≤60% and >30%; red, compensatory reserve ≤30%. BL, baseline; W, watts. Image modified from [52].
Figure 10
Figure 10
Device form factor. Electrodes for a single-lead ECG, photodiodes and LEDs to record the PPG, and tri-axial accelerometers and gyroscopes (internal to the devices) to acquire the SCG signal can be customized and modularized to work in multiple form factors. The left side shows the watch-based approach described in [60], while the right side shows an updated version of the chest-worn patch originally described in [59].
Figure 11
Figure 11
BVDS feature extraction. While the CRM evaluates 30-s segments of the recorded arterial waveform signal, the BVDS metric uses the ECG to segment and analyze all signals on a heartbeat-by-heartbeat level. Fiducial points are detected in each heartbeat and used to calculate cardiac timing intervals and a handful of other clinically relevant features.
Figure 12
Figure 12
Feature importance for the BVDS model, as output by the random forest algorithm in [12]. Electromechanical features include the pre-ejection period (PEP), left ventricular ejection time (LVET) and their ratio, PEP/LVET along with heart rate (HR) and multiple measures of heart rate variability (HRV). Vascular features include the distal (and normalized) pulse arrival time (PAT), the distal pulse transit time (PTT), the PPG amplitude and the plethysmograph variability index (PVI). PEP/LVET is the most important feature for this model by a large margin, and six of the top seven features are from an electromechanical signal. This result highlights the relevance of including the ECG and SCG signals in predicting cardiovascular decompensation. Image modified from [12].
Figure 13
Figure 13
The BVDS metric performance in predicting decompensation. The line of best fit through the mean of the aggregated predictions for all animals during all portions of the experiment is shown in red. BVDS levels range on a scale from 0 to 100, with 100 indicating full decompensation status. The slope of the line (0.65) is an indicator of the overall prediction accuracy, while the R2 value of 0.93 is an indicator of the prediction consistency between BVDS levels. Standard deviation bars are also shown for each level, indicating the consistency of predictions within a single decompensation level. Image modified from [12].
Figure 14
Figure 14
The graph similarity score representing structural differences in the SCG signal recorded from a wearable patch found significant differences between compensated and decompensated heart failure patients from admission to discharge. Though all patients improved following treatment, some patients responded much better to the treatment than others. Image from [64].
Figure 15
Figure 15
Processing stages in an example use case. Noisy signal recordings from a ruggedized chest-worn sensor (brown) go through a signal quality assessment and then motion and external vibration removal prior to feature extraction. Once high-quality features are extracted from the signals, predictions and evaluations of context, activity and reserve or decompensation status can be made. This summarized information is then relayed back to the user.

Similar articles

Cited by

References

    1. Sawka M.N., Cheuvront S.N., Kenefick R.W. Hypohydration and Human Performance: Impact of Environment and Physiological Mechanisms. Sports Med. 2015;45:S51–S60. doi: 10.1007/s40279-015-0395-7. - DOI - PMC - PubMed
    1. Wittbrodt M.T., Sawka M.N., Mizelle J.C., Wheaton L.A., Millard-Stafford M.L. Exercise-heat stress with and without water replacement alters brain structures and impairs visuomotor performance. Physiol. Rep. 2018;6:e13805. doi: 10.14814/phy2.13805. - DOI - PMC - PubMed
    1. Castellani J.W., Muza S.R., Cheuvront S.N., Sils I.V., Fulco C.S., Kenefick R.W., Beidleman B.A., Sawka M.N. Effect of hypohydration and altitude exposure on aerobic exercise performance and acute mountain sickness. J. Appl. Physiol. 2010;109:1792–1800. doi: 10.1152/japplphysiol.00517.2010. - DOI - PubMed
    1. Sawka M.N., Young A.J., Latzka W.A., Neufer P.D., Quigley M.D., Pandolf K.B. Human Tolerance to Heat Strain During Exercise—Influence of Hydration. J. Appl. Physiol. 1992;73:368–375. doi: 10.1152/jappl.1992.73.1.368. - DOI - PubMed
    1. Carter R., Cheuvront S.N., Vernieuw C.R., Sawka M.N. Hypohydration and prior heat stress exacerbates decreases in cerebral blood flow velocity during standing. J. Appl. Physiol. 2006;101:1744–1750. doi: 10.1152/japplphysiol.00200.2006. - DOI - PubMed