. 2022 Jan 14;10(1):124.
doi: 10.3390/vaccines10010124.

Immunoprofiling Identifies Functional B and T Cell Subsets Induced by an Attenuated Whole Parasite Malaria Vaccine as Correlates of Sterile Immunity

Affiliations

Immunoprofiling Identifies Functional B and T Cell Subsets Induced by an Attenuated Whole Parasite Malaria Vaccine as Correlates of Sterile Immunity

Marie Mura et al. Vaccines (Basel). .

Abstract

Immune correlates of protection remain elusive for most vaccines. An identified immune correlate would accelerate the down-selection of vaccine formulations by reducing the need for human pathogen challenge studies that are currently required to determine vaccine efficacy. Immunization via mosquito-delivered, radiation-attenuated P. falciparum sporozoites (IMRAS) is a well-established model for efficacious malaria vaccines, inducing greater than 90% sterile immunity. The current immunoprofiling study utilized samples from a clinical trial in which vaccine dosing was adjusted to achieve only 50% protection, thus enabling a comparison between protective and non-protective immune signatures. In-depth immunoprofiling was conducted by assessing a wide range of antigen-specific serological and cellular parameters and applying our newly developed computational tools, including machine learning. The computational component of the study pinpointed previously un-identified cellular T cell subsets (namely, TNFα-secreting CD8+CXCR3-CCR6- T cells, IFNγ-secreting CD8+CCR6+ T cells and TNFα/FNγ-secreting CD4+CXCR3-CCR6- T cells) and B cell subsets (i.e., CD19+CD24hiCD38hiCD69+ transitional B cells) as important factors predictive of protection (92% accuracy). Our study emphasizes the need for in-depth immunoprofiling and subsequent data integration with computational tools to identify immune correlates of protection. The described process of computational data analysis is applicable to other disease and vaccine models.

Keywords: correlate of protection; immune signature; machine learning; malaria; whole sporozoites vaccine.


Conflict of interest statement

The authors declare no conflict of interest.

Figures

Figure 1
Figure 1
IMRAS clinical trial timeline. Cryopreserved PBMCs were available from baseline (T0), 2 weeks after the third immunization (T1), 5–6 days after controlled human malaria infection (CHMI, T2) and 3–4 months after CHMI (T3). Sera were available from baseline (T0), 2 weeks after the third immunization (T1), the day of CHMI (T2), and 28 days after CHMI (T3). The vaccine schedule included 5 immunizations with approx. 200 bites from mosquitoes infected with irradiated SPZ per immunization.
Figure 2
Figure 2
Immune signatures induced by IMRAS vaccination. The immunological landscape was established by integrating the results of all immune assays performed on longitudinal samples from IMRAS-vaccinated subjects. Twenty-six immune measures were significantly (p < 0.05, q < 0.05) associated with IMRAS immunization at T1. The correlation matrix of these measures shows only significant correlations (Spearman, ρ > 0.4, p < 0,05). The color and size of the dots (scale next to graph) indicate the degree of correlation between the different parameters (small to large indicating low to high correlation).
Figure 3
Figure 3
Antibody and B cell responses induced by IMRAS immunization. (A) Normalized log-10 transformed serology titers at baseline (T0) and after immunization (T1) specific to SPZ. Titers were assessed by IFA. (B) Normalized log-10 transformed serology titers at baseline (T0) and after immunization (T1) specific to AMA-1 and CSP full length (CSP_FL). Titers were assessed by ELISA. (C) Mean luminescence signal (measured by MSD) against MSP-1, saliva protein gSG6 (gSG6 peptides 1 and 2), CSP C-terminus (Pf16), CSP repeat (NANP), and early gametocyte antigens (Pfs16/Pfs25). (D) Stratification of antibody titers by protection status. Normalized log-10 transformed serology titers at baseline (T0), after the third immunization (T1), the day of CHMI (T2), and 28 days after CHMI (T3) specific to AMA-1 and CSP full length (CSP_FL) assessed by ELISA. ns = not significant, * p < 0.05, ** p < 0.01, *** p < 0.001.
Figure 4
Figure 4
Frequency and composition of Plasmodium-specific reactive B cells before and after IMRAS immunization. (A) Antigen specificity (SPZ, CSP, CelTOS, AMA-1, and MSP-1) and frequency of Plasmodium-specific, IgG-producing B cells per million PBMC assessed by ELISpot. Box plots represent n = 16 subjects per time point. (B) Changes in the frequency and composition of SPZ-specific B cell compartment: naïve B cells, memory (MBC), switched MBC, un-switched MBC, transitional B cells, and plasmablasts (phenotypic markers indicated on X-axis) assessed by flow cytometry. Box plots represent n = 12 subjects per time point. ns = not significant, ** p < 0.01, *** p < 0.001. LD = limit of detection (threshold).
Figure 5
Figure 5
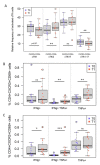
IMRAS vaccination induces significant differences in the frequency of antigen-specific T cell subsets. (A) Changes in the frequency and compositions of CSP-specific cTfh subsets after vaccination. Frequency of antigen-specific cTfh subsets (indicated on X-axis based on expression of chemokine receptors CXCR3 vs. CCR6) at baseline (pre-immune, T0 = blue dots) and pre-CHMI (T1 = red dots). Changes in the frequency of antigen-specific CD4+CXCR3+ T cells secreting IFNγ and/or TNFα after SPZ (B) or CSP (C) stimulation before (T0) and after immunization (T1). ns = not significant, * p < 0.05, ** p < 0.01, *** p < 0.001.
Figure 6
Figure 6
Frequencies of SPZ-specific CD4+ and CD4+CXCR3+ T cells are significantly higher in protected individuals. Changes in the frequency of CD69+CD4+CXCR3+ (Panel A) and bulk CD69+CD4+ in protected (blue) and non-protected (red) individuals at pre-immune (T0) vs. pre-CHMI (T1) time points. ns = not significant, ** p < 0.01.
Figure 7
Figure 7
Principal component analysis of protection. Twelve individuals with a complete dataset were plotted on the first (Dim1) and second (Dim2) principal components of a principal component analysis. The color and shape of the dots (which represent individual samples) indicate protection status.

References

    1. Plotkin S.A. Correlates of Protection Induced by Vaccination. Clin. Vaccine Immunol. 2010;17:1055–1065. doi: 10.1128/CVI.00131-10. - DOI - PMC - PubMed
    1. Farooq F., Bergmann-Leitner E.S. Immune Escape Mechanisms are Plasmodium’ s Secret Weapons Foiling the Success of Potent and Persistently Efficacious Malaria Vaccines. Clin. Immunol. 2015;161:136–143. doi: 10.1016/j.clim.2015.08.015. - DOI - PubMed
    1. World Health Organization . World Malaria Report. WHO; Geneva, Switzerland: 2019.
    1. The RTS,S Clinical Trials Partnership Efficacy and Safety of the RTS,S/AS01 Malaria Vaccine during 18 Months after Vaccination: A Phase 3 Randomized, Controlled Trial in Children and Young Infants at 11 African Sites. PLoS Med. 2014;11:e1001685. doi: 10.1371/journal.pmed.1001685. - DOI - PMC - PubMed
    1. The RTS,S Clinical Trials Partnership. Agnandji S.T., Lell B., Fernandes J.F., Abossolo B.P., Methogo B.G., Kabwende A.L., Adegnika A., Mordmuller B., Issifou S., et al. A Phase 3 Trial of RTS,S/AS01 Malaria Vaccine in African Infants. N. Engl. J. Med. 2012;367:2284–2295. doi: 10.1056/nejmoa1208394. - DOI - PMC - PubMed