

Peptide-based semiconducting polymer nanoparticles for osteosarcoma-targeted NIR-II fluorescence/NIR-I photoacoustic dual-model imaging and photothermal/photodynamic therapies
- PMID: 35062957
- PMCID: PMC8780402
- DOI: 10.1186/s12951-022-01249-4
Peptide-based semiconducting polymer nanoparticles for osteosarcoma-targeted NIR-II fluorescence/NIR-I photoacoustic dual-model imaging and photothermal/photodynamic therapies
Abstract
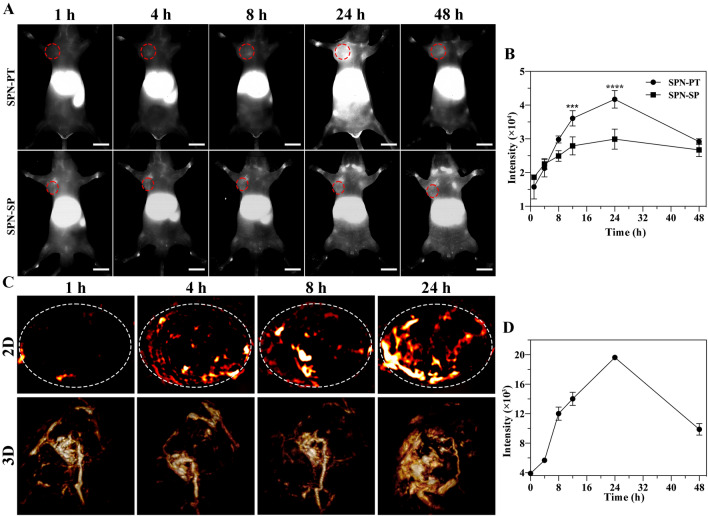
Background: The overall survival rate of osteosarcoma (OS) patients has not been improved for 30 years, and the diagnosis and treatment of OS is still a critical issue. To improve OS treatment and prognosis, novel kinds of theranostic modalities are required. Molecular optical imaging and phototherapy, including photothermal therapy (PTT) and photodynamic therapy (PDT), are promising strategies for cancer theranostics that exhibit high imaging sensitivity as well as favorable therapeutic efficacy with minimal side effect. In this study, semiconducting polymer nanoparticles (SPN-PT) for OS-targeted PTT/PDT are designed and prepared, using a semiconducting polymer (PCPDTBT), providing fluorescent emission in the second near-infrared window (NIR-II, 1000 - 1700 nm) and photoacoustic (PA) signal in the first near-infrared window (NIR-I, 650 - 900 nm), served as the photosensitizer, and a polyethylene glycolylated (PEGylated) peptide PT, providing targeting ability to OS.
Results: The results showed that SPN-PT nanoparticles significantly accelerated OS-specific cellular uptake and enhanced therapeutic efficiency of PTT and PDT effects in OS cell lines and xenograft mouse models. SPN-PT carried out significant anti-tumor activities against OS both in vitro and in vivo.
Conclusions: Peptide-based semiconducting polymer nanoparticles permit efficient NIR-II fluorescence/NIR-I PA dual-modal imaging and targeted PTT/PDT for OS.
Keywords: Dual-modal imaging; Osteosarcoma-targeted; Photodynamic therapy; Photothermal therapy.
© 2022. The Author(s).
Conflict of interest statement
All authors declared no conflict of interest.
Figures


Similar articles
-
NIR-II Excitation Phototheranostic Nanomedicine for Fluorescence/Photoacoustic Tumor Imaging and Targeted Photothermal-Photonic Thermodynamic Therapy.Small. 2021 Oct;17(42):e2102527. doi: 10.1002/smll.202102527. Epub 2021 Sep 16. Small. 2021. PMID: 34528387
-
Gadolinium-Chelated Conjugated Polymer-Based Nanotheranostics for Photoacoustic/Magnetic Resonance/NIR-II Fluorescence Imaging-Guided Cancer Photothermal Therapy.Theranostics. 2019 May 31;9(14):4168-4181. doi: 10.7150/thno.34390. eCollection 2019. Theranostics. 2019. PMID: 31281539 Free PMC article.
-
GSH-Responsive Semiconducting Polymer as a Nanotheranostic Platform for NIR-II Imaging-Guided Chemo-Photothermal Therapy.Macromol Rapid Commun. 2025 May;46(10):e2401098. doi: 10.1002/marc.202401098. Epub 2025 Feb 22. Macromol Rapid Commun. 2025. PMID: 39985423
-
Multifunctional nanotheranostics for near infrared optical imaging-guided treatment of brain tumors.Adv Drug Deliv Rev. 2022 Nov;190:114536. doi: 10.1016/j.addr.2022.114536. Epub 2022 Sep 13. Adv Drug Deliv Rev. 2022. PMID: 36108792 Review.
-
Organic Semiconductors for Photothermal Therapy and Photoacoustic Imaging.Chembiochem. 2019 Jul 1;20(13):1628-1636. doi: 10.1002/cbic.201800818. Epub 2019 Apr 18. Chembiochem. 2019. PMID: 30690811 Review.
Cited by
-
Near-Infrared Carbonized Polymer Dots for NIR-II Bioimaging.Adv Sci (Weinh). 2022 Oct;9(30):e2203474. doi: 10.1002/advs.202203474. Epub 2022 Sep 1. Adv Sci (Weinh). 2022. PMID: 36047633 Free PMC article.
-
A Multifunctional Nano-Delivery System Against Rheumatoid Arthritis by Combined Phototherapy, Hypoxia-Activated Chemotherapy, and RNA Interference.Int J Nanomedicine. 2022 Dec 10;17:6257-6273. doi: 10.2147/IJN.S382252. eCollection 2022. Int J Nanomedicine. 2022. PMID: 36531117 Free PMC article.
-
Biomimetic CuCoO2 nanosheets reinforced with self-assembling peptide nanofibers for tumor photothermal therapy.RSC Adv. 2024 Dec 11;14(53):39163-39172. doi: 10.1039/d4ra07435a. eCollection 2024 Dec 10. RSC Adv. 2024. PMID: 39664248 Free PMC article.
-
Advancements in Photothermal Therapy Using Near-Infrared Light for Bone Tumors.Int J Mol Sci. 2024 Apr 9;25(8):4139. doi: 10.3390/ijms25084139. Int J Mol Sci. 2024. PMID: 38673726 Free PMC article. Review.
-
Bioinspired nanomedicines for the management of osteosarcoma: Recent progress and perspectives.Mater Today Bio. 2025 Mar 5;32:101607. doi: 10.1016/j.mtbio.2025.101607. eCollection 2025 Jun. Mater Today Bio. 2025. PMID: 40151805 Free PMC article. Review.
References
-
- Chen C, Xie L, Ren T, Huang Y, Xu J, Guo W. Immunotherapy for osteosarcoma: Fundamental mechanism, rationale, and recent breakthroughs. Cancer Lett. 2021;500:1–10. - PubMed
-
- Gianferante DM, Mirabello L, Savage SA. Germline and somatic genetics of osteosarcoma - connecting aetiology, biology and therapy. Nat Rev Endocrinol. 2017;13:480–91. - PubMed
MeSH terms
Substances
Grants and funding
LinkOut - more resources
Full Text Sources
Miscellaneous
