. 2022 Jan 21;12(1):8.
doi: 10.1186/s13578-022-00745-2.

Transcriptome-scale spatial gene expression in rat arcuate nucleus during puberty

Affiliations

Transcriptome-scale spatial gene expression in rat arcuate nucleus during puberty

Shasha Zhou et al. Cell Biosci. .

Abstract

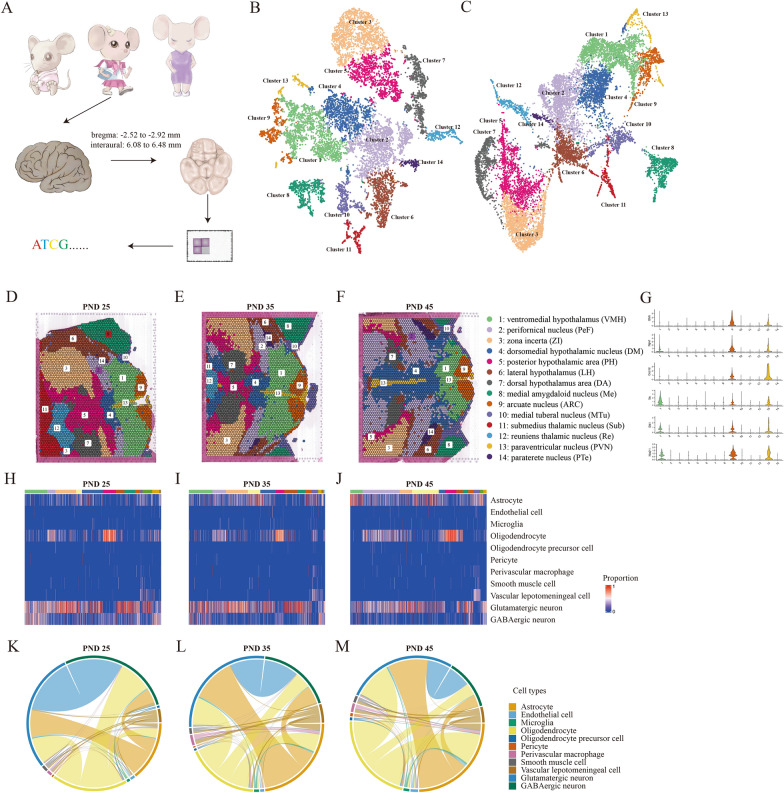
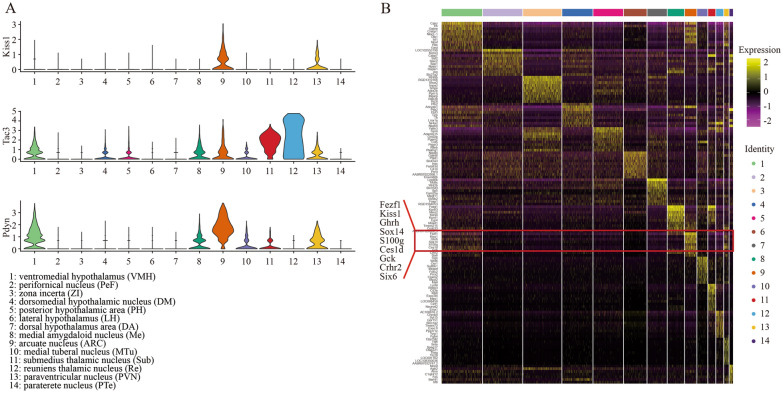
Background: A variety of neurons in hypothalamus undergo a complicated regulation on transcription activity of multiple genes for hypothalamic-pituitary-gonadal axis activation during pubertal development. Identification of puberty-associated cell composition and characterization of the unique transcriptional signatures across different cells are beneficial to isolation of specific neurons and advanced understanding of their functions.

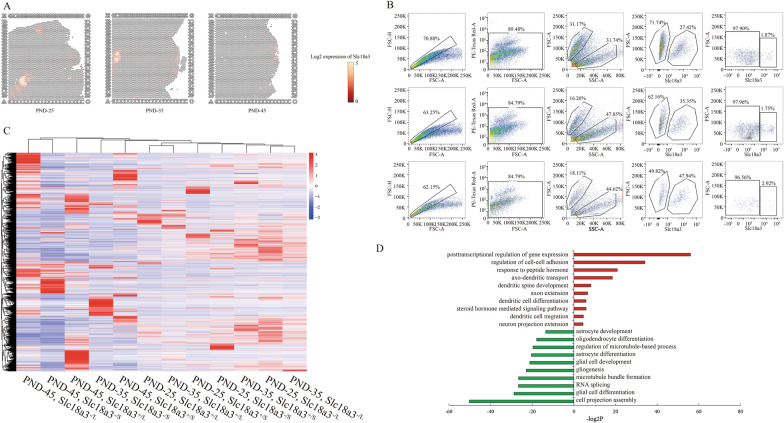
Methods: The hypothalamus of female Sprague-Dawley rats in postnatal day-25, 35 and 45 were used to define the dynamic spatial atlas of gene expression in the arcuate nucleus (ARC) by 10× Genomics Visium platform. A surface protein expressed selectively by kisspeptin neurons was used to sort neurons by flow cytometric assay in vitro. The transcriptome of the isolated cells was examined using Smart sequencing.

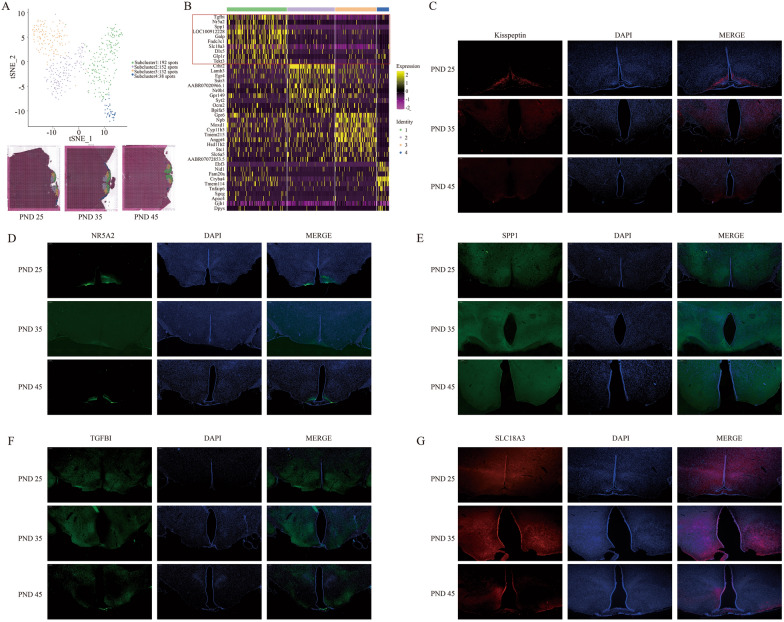
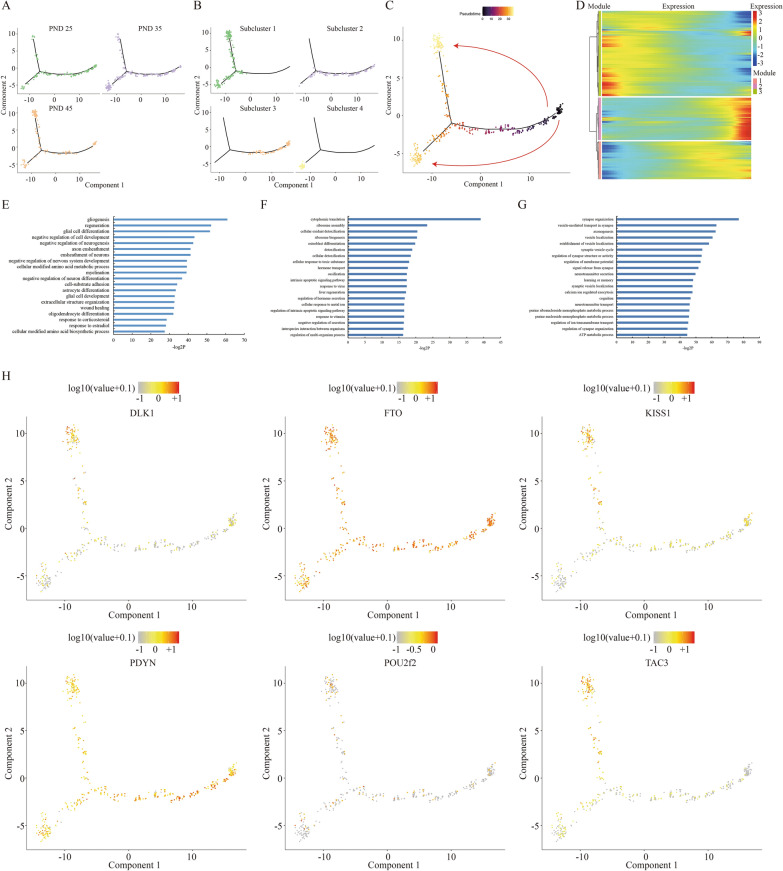
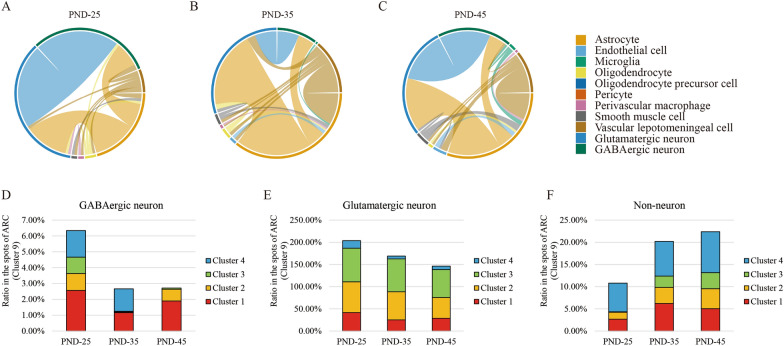
Results: Four subclusters of neurons with similar gene expression signatures in ARC were identified. Only one subcluster showed the robust expression of Kiss1, which could be isolated by a unique membrane surface biomarker Solute carrier family 18 member A3 (SLC18A3). Moreover, genes in different subclusters presenting three expression modules distinctly functioned in each pubertal stage. Different types of cells representing distinct functions on glial or neuron differentiation, hormone secretion as well as estradiol response precisely affect and coordinate with each other, resulting in a complicated regulatory network for hypothalamic-pituitary-gonadal axis initiation and modulation.

Conclusion: Our data revealed a comprehensive transcriptomic overview of ARC within different pubertal stages, which could serve as a valuable resource for the study of puberty and sexual development disorders.

Keywords: ARC; Hypothalamus; Kiss1; Puberty; Slc18a3; Spatial transcriptome.


Conflict of interest statement

All authors declare that there is no conflict of interest.

Figures

Fig. 1
Fig. 1
Cell clusters identification in rat hypothalamus by spatial transcriptomics sequencing. A Schematic diagram of spatial transcriptomics sequencing of rat hypothalamus with postnatal day (PND)-25, 35 and 45. The target hypothalamus is sectioned at bregma: − 2.52 to − 2.92 mm and interaural: 6.08 to 6.48 mm. The tSNE (B) and UMAP (C) plots showing the cells are classified into 14 clusters based on the transcriptomes of overall gene expression relationship among the 12,436 spots with 5179 genes. Different cell clusters are color-coded. The clusters of ventromedial hypothalamus nucleus (VMH) (Cluster 1), arcuate nucleus (ARC) (Cluster 9), and paraventricular nucleus (PVN) (Cluster 13) are highlighted. DF Feature plots showing the distribution of clusters in brain sections of PND-25, 35 and 45. The colors and names of each cluster are corresponding to B. G Violin plots showing the gene expressions of Ghrh, Trh, Npvf, Dlk1, Ces1d and Nkx2-1 in all 14 clusters. HJ Cell type heatmap showing the proportion of different cell types occupied in each cluster of PND-25, 35 and 45. KM Chord diagrams showing that all spot sites on a spatial slice of a sample contain both specific cells of PND-25, 35 and 45. The thicker lines represent that these two cell types share more spots
Fig. 2
Fig. 2
Spatial transcriptomic profiles of ARC. A Violin plots showing the gene expressions of Kiss1, Tac3 and Pdyn in all 14 clusters. B Heatmap showing the top ten genes in 14 clusters. Red frame highlights the top expressed genes in ARC (Cluster 9)
Fig. 3
Fig. 3
Cell clusters identification in ARC. A The tSNE plot showing the cells are classified into 4 clusters based on the transcriptomes of overall gene expression in 514 spots of ARC (Cluster 9) (Top). Feature plots showing the distribution of clusters in PND-25, 35 and 45 (Bottom). B Heatmap showing the top ten genes in these 4 subclusters. Red frame highlights the top expressed genes in Subcluster 1. CG The IF assay showing the expression of Kiss1, Nr5a2, Spp1, Tgfbi and Slc18a3 in ARC of PND-25, 35 and 45 rat
Fig. 4
Fig. 4
Isolation of Kiss1-expressed cells from ARC. A Feature plots showing the Slc18a3-expressed spots in PND-25, 35 and 45. B Flow cytometric analysis showing the process of ARC cells isolated by SLC18A3 from PND-25 (Top), PND-35 (Middle) and PND-45 (Bottom). C Heatmap showing the gene expression signatures of the four populations from B in PND-25, 35 and 45. “L”: large; “S”: small; “+”:SLC18A3 positive; “−”: SLC18A3 negative. D GO analysis of differential expressed genes (DEGs) between the large and small SLC18A3 positive cells. Red items represent the up-regulated DEGs while green items represent the down-regulated DEGs in large cells compared to the small ones
Fig. 5
Fig. 5
Transcriptional dynamics during pubertal development. A Unsupervised pseudotime analysis showing the PND-25 (green), 35 (pinkish purple) and 45 (orange) based on their gene expression profiles. Minimal spanning tree is shown in black. B Unsupervised pseudotime analysis showing the Subcluster 1 (green), Subcluster 2 (pinkish purple), Subcluster 3 (orange) and Subcluster 4 (yellow) based on their gene expression profiles. C Unsupervised ordering of the pubertal development based on gene expression profiles of these three stages. Arrows indicate the direction of development. D Heatmap showing three groups of gene expression modules with distinct expression dynamics during pubertal development. EG GO analysis of the genes in three modules, respectively. H Scatterplots showing the expression of Dlk1, Fto, Kiss1, Pdyn, Pou2f2 and Tac3 along the pseudo-timeline
Fig. 6
Fig. 6
Cell types alteration during pubertal development. AC Chord diagrams showing the intercrossed cell types in PND-25, 35 and 45. The thicker lines represent that these two cell types share more spots. DF The proportion dynamics of GABAergic, glutamatergic and non-neuron in four subclusters in PND-25, 35 and 45

References

    1. Toro CA, Aylwin CF, Lomniczi A. Hypothalamic epigenetics driving female puberty. J Neuroendocrinol. 2018;30(7):e12589. doi: 10.1111/jne.12589. - DOI - PMC - PubMed
    1. Trevisan CM, Montagna E, de Oliveira R, Christofolini DM, Barbosa CP, Crandall KA, Bianco B. Kisspeptin/GPR54 system: what do we know about its role in human reproduction? Cell Physiol Biochem. 2018;49(4):1259–1276. doi: 10.1159/000493406. - DOI - PubMed
    1. Roberts SA, Kaiser UB. Genetics in endocrinology: genetic etiologies of central precocious puberty and the role of imprinted genes. Eur J Endocrinol. 2020;183(4):R107–R117. doi: 10.1530/EJE-20-0103. - DOI - PMC - PubMed
    1. Clarkson J, d’Anglemont de Tassigny X, Colledge WH, Caraty A, Herbison AE. Distribution of kisspeptin neurones in the adult female mouse brain. J Neuroendocrinol. 2009;21(8):673–682. doi: 10.1111/j.1365-2826.2009.01892.x. - DOI - PubMed
    1. Herbison AE. Control of puberty onset and fertility by gonadotropin-releasing hormone neurons. Nat Rev Endocrinol. 2016;12(8):452–466. doi: 10.1038/nrendo.2016.70. - DOI - PubMed

LinkOut - more resources