. 2022 Jan 20;185(2):299-310.e18.
doi: 10.1016/j.cell.2021.12.023.

Transition to invasive breast cancer is associated with progressive changes in the structure and composition of tumor stroma

Affiliations

Transition to invasive breast cancer is associated with progressive changes in the structure and composition of tumor stroma

Tyler Risom et al. Cell. .

Abstract

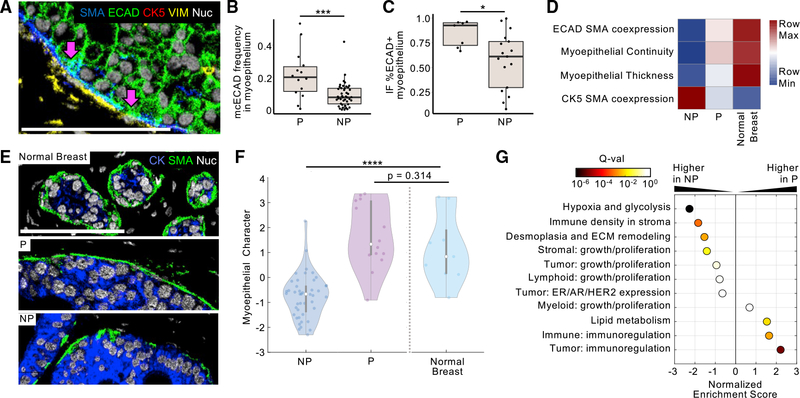
Ductal carcinoma in situ (DCIS) is a pre-invasive lesion that is thought to be a precursor to invasive breast cancer (IBC). To understand the changes in the tumor microenvironment (TME) accompanying transition to IBC, we used multiplexed ion beam imaging by time of flight (MIBI-TOF) and a 37-plex antibody staining panel to interrogate 79 clinically annotated surgical resections using machine learning tools for cell segmentation, pixel-based clustering, and object morphometrics. Comparison of normal breast with patient-matched DCIS and IBC revealed coordinated transitions between four TME states that were delineated based on the location and function of myoepithelium, fibroblasts, and immune cells. Surprisingly, myoepithelial disruption was more advanced in DCIS patients that did not develop IBC, suggesting this process could be protective against recurrence. Taken together, this HTAN Breast PreCancer Atlas study offers insight into drivers of IBC relapse and emphasizes the importance of the TME in regulating these processes.

Keywords: DCIS; MIBI; breast cancer; myoepithelium; spatial proteomics; systems biology; tumor microenvironment; tumor progression.


Conflict of interest statement

Declaration of interests M.A. and S.C.B. are inventors on patent US20150287578A1. M.A. and S.C.B. are board members and shareholders in IonPath Inc. T.R. and E.F.M. have previously consulted for IonPath Inc.

Figures

Figure 1.
Figure 1.. A longitudinal cohort of DCIS patients with or without subsequent invasive relapse
(A) Schematic of the tumor stages and patient sample numbers profiled in this study, including normal breast tissue, primary DCIS, and ipsilateral IBC relapses; 9/12 IBC samples were paired with primary DCIS samples. (B) Primary DCIS samples consisted of two outcome groups: progressors, who recurred with ipsilateral invasive disease with a median of 9.1 years, and non-progressors, who never recurred within a median follow-up of 11.4 years.
Figure 2.
Figure 2.. A single-cell phenotypic atlas of DCIS epithelium and its microenvironment
(A) Depiction of the parallel tissue analysis methods used in this study, including H&E staining, laser-capture microdissection (LCM) of stroma and epithelium with RNA-seq, and MIBI-TOF with an overview of the MIBI-TOF workflow. (B) Markers used in the MIBI-TOF panel, grouped by target cell type or protein class. (C) Cell lineage assignments based on normalized expression of lineage markers (heatmap columns). Rows are ordered by absolute abundance (bar plot, left), while columns are hierarchically clustered (euclidean distance, average linkage). Myoep, myoepithelial cell; Mono, monocyte; Endo, endothelial cell; APC, antigen-presenting cell; Macs, macrophages; ImmOther, immune other; MonoDC, monocyte-derived dendritic cell; dnT, double-negative T cell; DC, dendritic cell. (D) Representative MIBI image of a DCIS tumor with a nine-color overlay of major cell lineage markers. Inset showing the corresponding H&E image; scale bar: 100 μm. Pt., patient. (E) A cell phenotype map (CPM) showing cell identity by color, as defined in C, overlaid onto the cell segmentation mask; scale bar: 100 μm. (F) Region masks marking stroma (pink), myoepithelial (cyan), and ductal (blue) tissue regions; scale bar: 100 μm. (G) Heatmap of normalized marker expression for four tumor cell subsets including luminal (CK7/PanCK/ECAD+), CK5/7-low (PanCK+, ECAD+ only), Basal (CK5/PanCK/ECAD+), and EMT (VIM/PanCK/ECAD+), with an accompanying bar graph of cell subset prominence. (H) Images of DCIS tumors with diversity in tumor cell subsets including basal/luminal heterogeneity (left) and EMT tumor cells (right); scale bar, 100 μm. (I) Heatmap of normalized marker expression for four fibroblast cell subsets including resting fibroblasts (VIM+ only, Resting), myofibroblasts (SMA/VIM+, Myo), cancer-associated fibroblasts (FAP/VIM+, CAFs), and normal fibroblasts (CD36/VIM+, Normal). (J) Images of DCIS tumors with distinct stroma makeup of fibroblast subsets including normal fibroblast enriched (left) and CAF enriched (right); scale bar: 100 μm. (K) Area plots of the frequency of tumor subsets (top), fibroblast subsets (middle), and immune lineages (bottom) in all DCIS, IBC, and normal patient samples profiled in this study. Tissue and PAM50 subtype are denoted by color in the top row.
Figure 3.
Figure 3.. Transition to DCIS and IBC is marked by coordinated changes in the TME
(A) Schematic of the classes of spatial features quantified in all samples, including the measurement of cell type prevalence in specific tissue regions (1: Tissue compartment enrichment), the calculation of paired cell-cell spatial enrichment or spatially enriched cell neighborhoods (2: cell-cell proximity), and morphometric features of the myoepithelial layer and collagen fibers (3: morphometrics). (B) Area plot of the distribution of each feature class in the features that significantly differ between normal breast tissue, DCIS, and IBC states by Kruskal-Wallis H test (p < 0.05). (C) Column plot comparing the prevalence of each feature class in features that differ between tissue states, and total measured features. (D) Heatmap of the distinguishing feature prevalence in normal breast tissue, DCIS, and recurrent IBC samples. K-means clustering separated features into four groups of distinct feature-enrichment patterns in the tissues states, including those highest in normal tissue and low in IBC (TME1: normal enriched), those highest in DCIS (TME2: DCIS enriched), and those highest in IBC and low in normal (TME3: IBC enriched). Features are organized by descending false-discovery rate Q value within each TME. Color indicates mean over tissue state, Z scored per feature across tissue states. (E) Area plot of the distribution of the cellular compartment of the distinguishing features in each TME cluster.
Figure 4.
Figure 4.. Increased desmoplasia and ECM remodeling distinguish primary DCIS from their IBC recurrence
(A) Paired vertical scatterplot of the stromal density of mast cells in the primary DCIS diagnosis and subsequent IBC recurrence in individual patients; paired Mann-Whitney test. (B) The stromal density of normal fibroblasts is compared in longitudinal samples from single patients as in (A). (C) Representative MIBI image overlays showing the primary DCIS diagnosis (left) and invasive recurrence (right) from patient 1023. Green arrows, normal fibroblasts, orange arrows, CAFs; scale bar: 100 μm. (D) Example of dense MIBI collagen signal, collagen fiber object segmentation, and subsequent fiber area and orientation measurement, with fiber-fiber alignment denoted by fiber color. (E) Scatterplot comparing summed stromal density of CAFs and myofibroblasts versus collagen fiber density. (F) Volcano plot of ECM-related gene expression for the top and bottom CAF-enriched DCIS tumors.
Figure 5.
Figure 5.. Identifying DCIS features correlated with risk of invasive progression
(A) Schematic of the outcome groups of primary DCIS: “progressors,” who recurred with ipsilateral IBC, and “non-progressors,” who showed no recurrence within 11 years of follow-up. MIBI features (N = 433) of numerous feature classes were used to train a random forest classifier to differentiate progressor and non-progressor samples. Classifier specificity was then tested on a withheld set of 20% of patients in a test group. (B) AUC plot of classifier sensitivity and specificity. (C) Classifier accuracy is compared for 10 runs with known progressor/non-progressor labels and 10 runs with randomly permuted progressor/non-progressor labels. p = 0.02, Wilcoxon signed rank test. (D) Bar plot of features with top classifier importance ranked by average Gini importance across the unpermuted 10 runs. Orange, enriched for progressors; green, enriched for non-progressors. The parent feature class for each feature is shown and whether that class leveraged spatial information. (E) Column plot of the sum of Gini importance of features separated by their corresponding cellular compartment.
Figure 6.
Figure 6.. Myoepithelial breakdown and phenotypic change between progressors and non-progressors
(A) Representative MIBI image overlay of a DCIS progressor tumor with ECAD coexpression in the SMA+ myoepithelium; scale bar: 100 μm. (B) Boxplot comparing the frequency of ECAD+/SMA+ myoepithelial coexpression cluster in progressor (P) and non-progressor (NP) tumors. ***p < 0.001, *p < 0.05, Mann-Whitney test. (C) Boxplot comparing the frequency of the ECAD+ myoepithelium in immunofluorescence analysis between P and NP tumors. (D) Heatmap of select myoepithelial feature prominence in NP tumors, P tumors, and normal breast tissue. (E) Representative images of myoepithelial integrity in normal breast tissue, a P DCIS tumor, and a NP tumor. (F) Violin plot of the distribution of linear discriminate analysis-derived “myoepithelial character” values in NP and P tumors as well as normal breast tissue; Kruskal-Wallis test. (G) Gene set enrichment analysis of all measured features was used to determine which tissue feature ontologies were enriched in tumors with high or low myoepithelial character scores. Normalized enrichment score is given for each feature ontology; points are colored by significance (false discovery rate Q value).

References

    1. Afghahi A, Forgó E, Mitani AA, Desai M, Varma S, Seto T, Rigdon J, Jensen KC, Troxell ML, Gomez SL, et al. (2015). Chromosomal copy number alterations for associations of ductal carcinoma in situ with invasive breast cancer. Breast Cancer Res. 17, 108. - PMC - PubMed
    1. Aguiar FN, Cirqueira CS, Bacchi CE, and Carvalho FM (2015). Morphologic, molecular and microenvironment factors associated with stromal invasion in breast ductal carcinoma in situ: Role of myoepithelial cells. Breast Dis. 35, 249–252. - PubMed
    1. Casasent AK, Schalck A, Gao R, Sei E, Long A, Pangburn W, Casasent T, Meric-Bernstam F, Edgerton ME, and Navin NE (2018). Multiclonal Invasion in Breast Tumors Identified by Topographic Single Cell Sequencing. Cell 172, 205–217.e12. - PMC - PubMed
    1. Anders S, and Huber W (2010). Differential expression analysis for sequence count data. Genome Biol. 11, R106. - PMC - PubMed
    1. Aponte-López A, Fuentes-Pananá EM, Cortes-Muñoz D, and MuñozCruz S (2018). Mast Cell, the Neglected Member of the Tumor Microenvironment: Role in Breast Cancer. J. Immunol. Res 10.1155/2018/2584243. - DOI - PMC - PubMed

Publication types