. 2022 Feb 17;185(4):712-728.e14.
doi: 10.1016/j.cell.2021.12.041. Epub 2022 Jan 20.

Tau interactome maps synaptic and mitochondrial processes associated with neurodegeneration

Affiliations

Tau interactome maps synaptic and mitochondrial processes associated with neurodegeneration

Tara E Tracy et al. Cell. .

Abstract

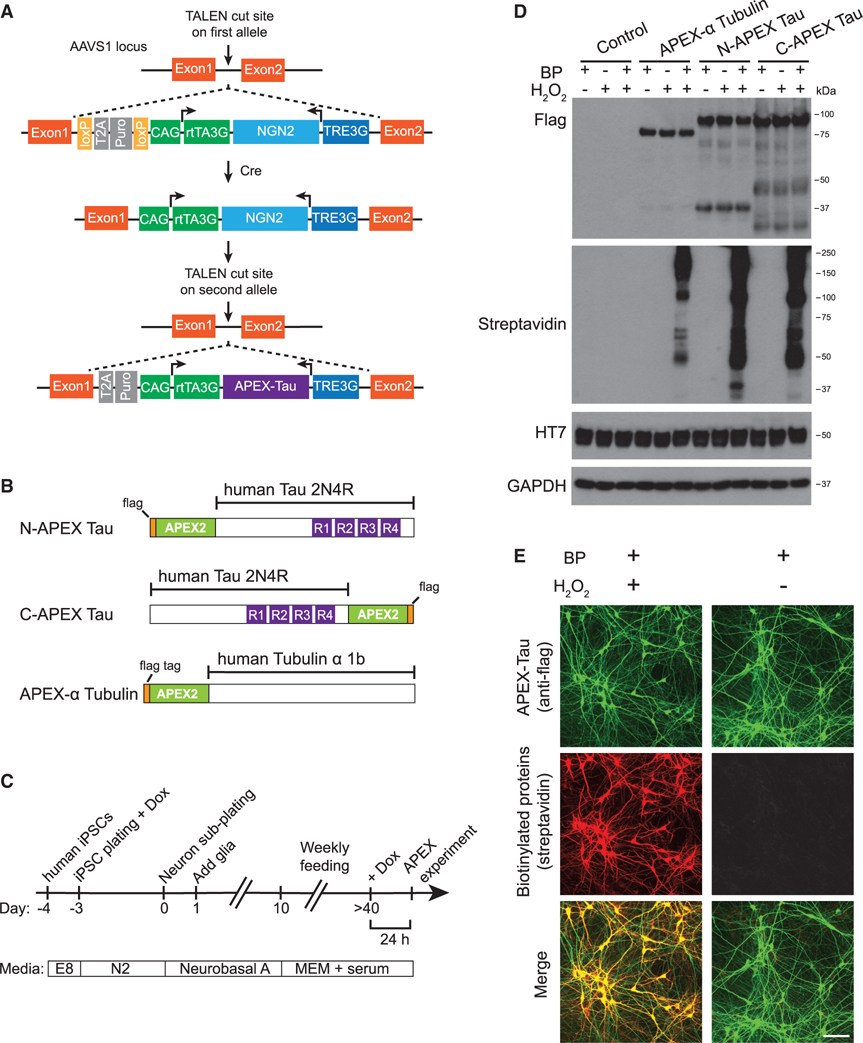
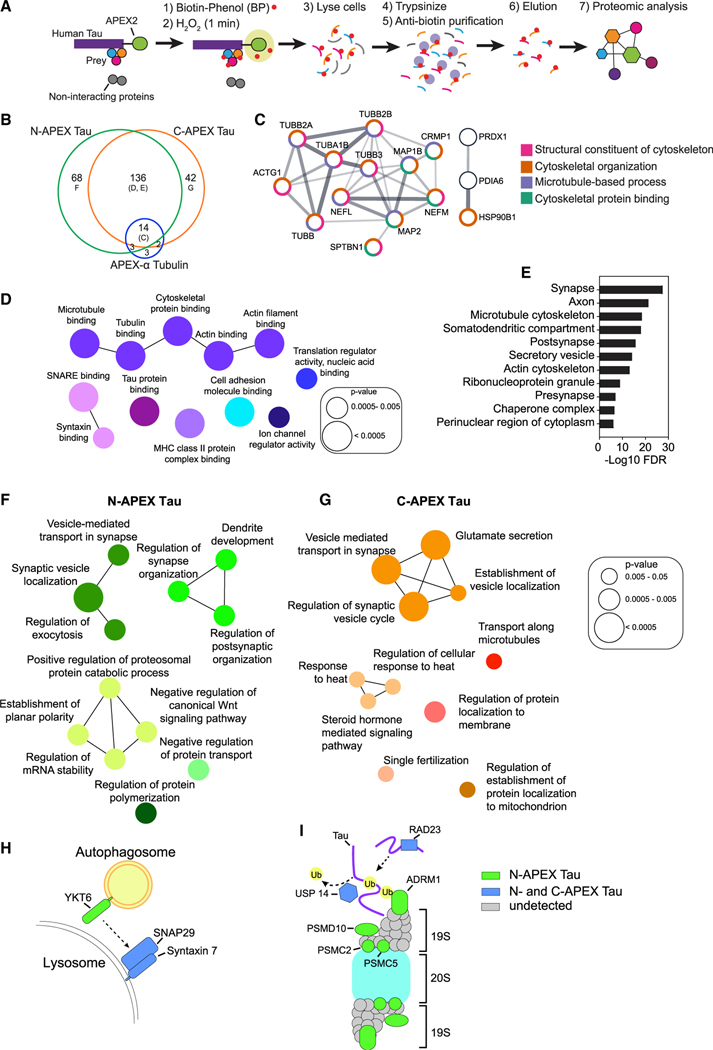
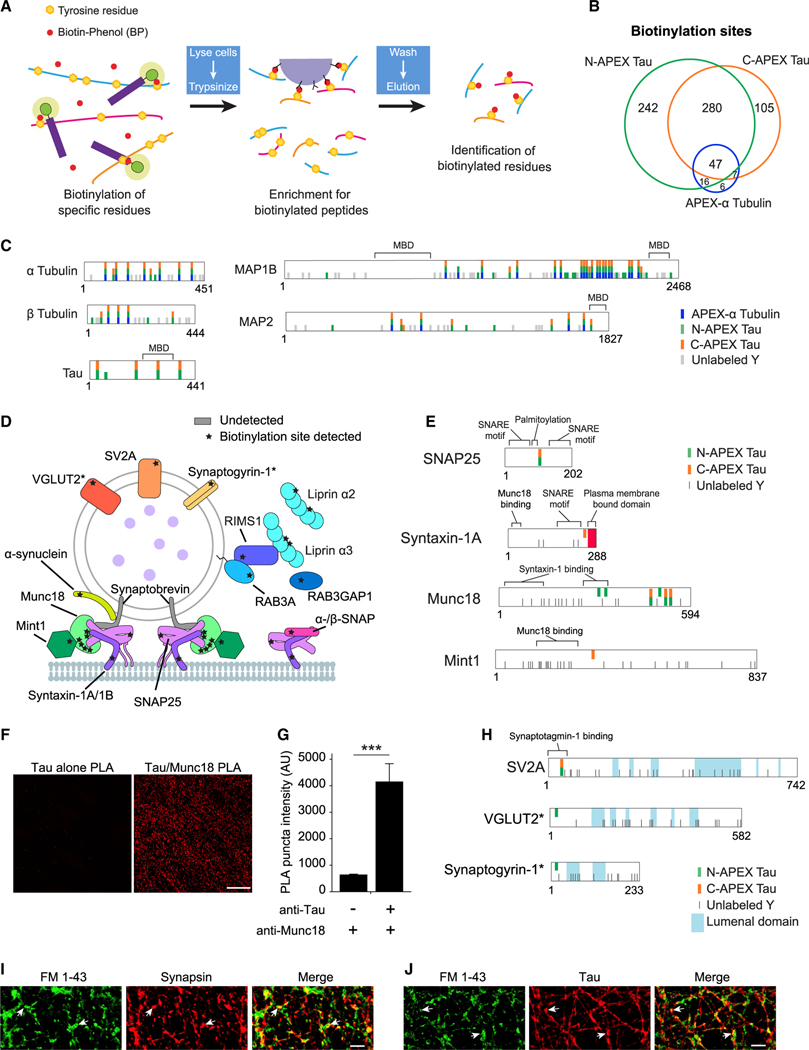
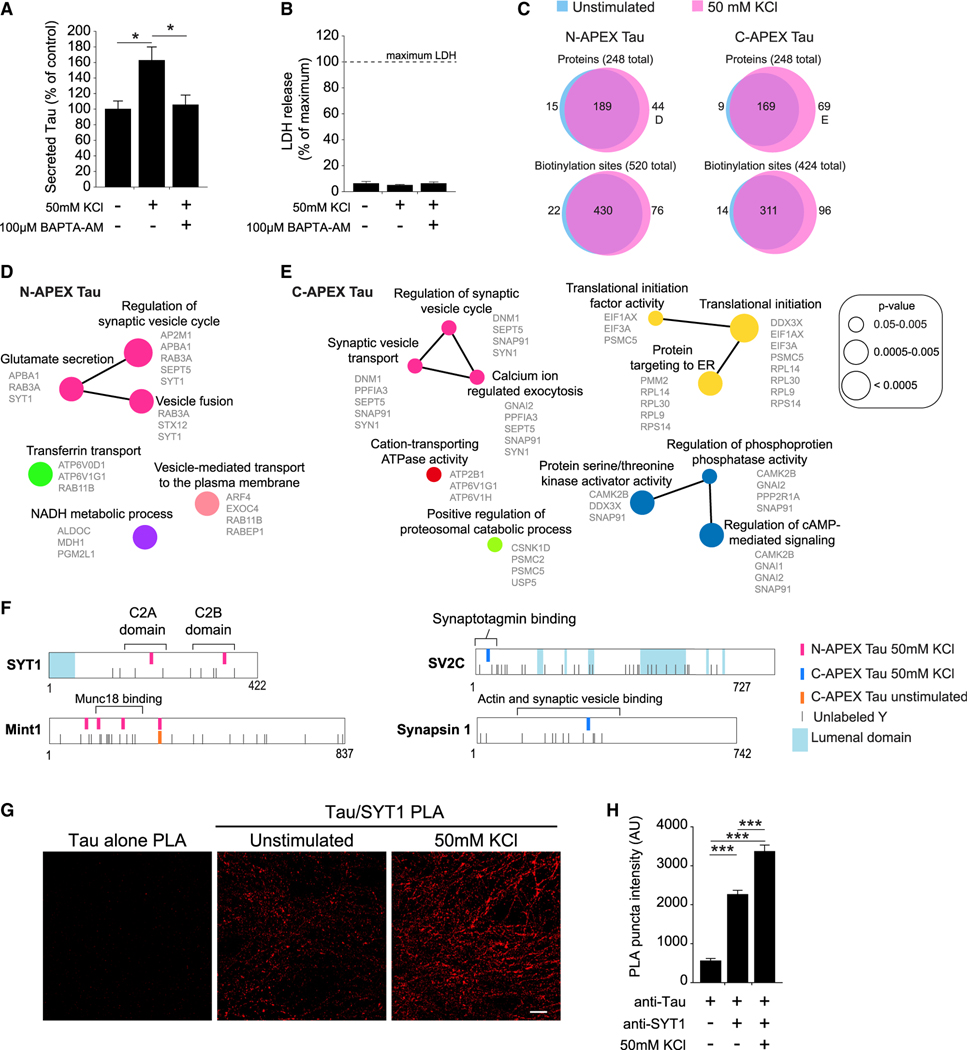
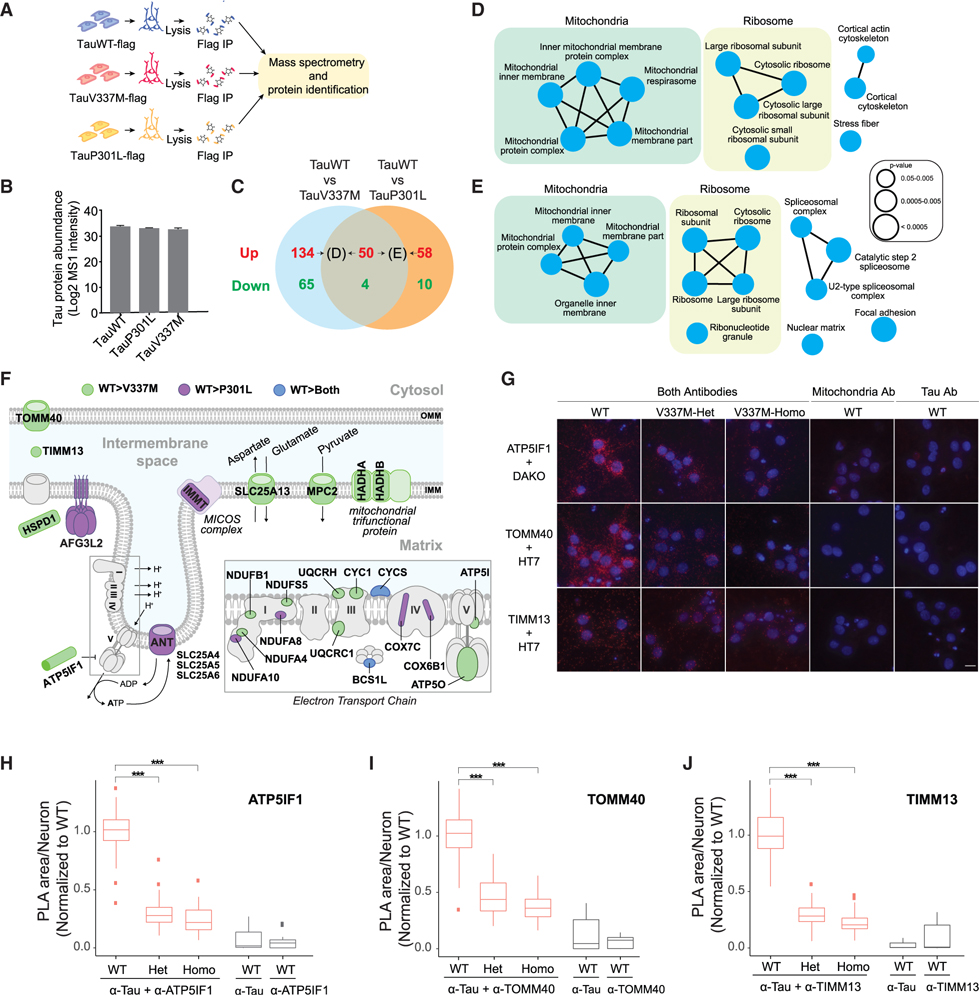
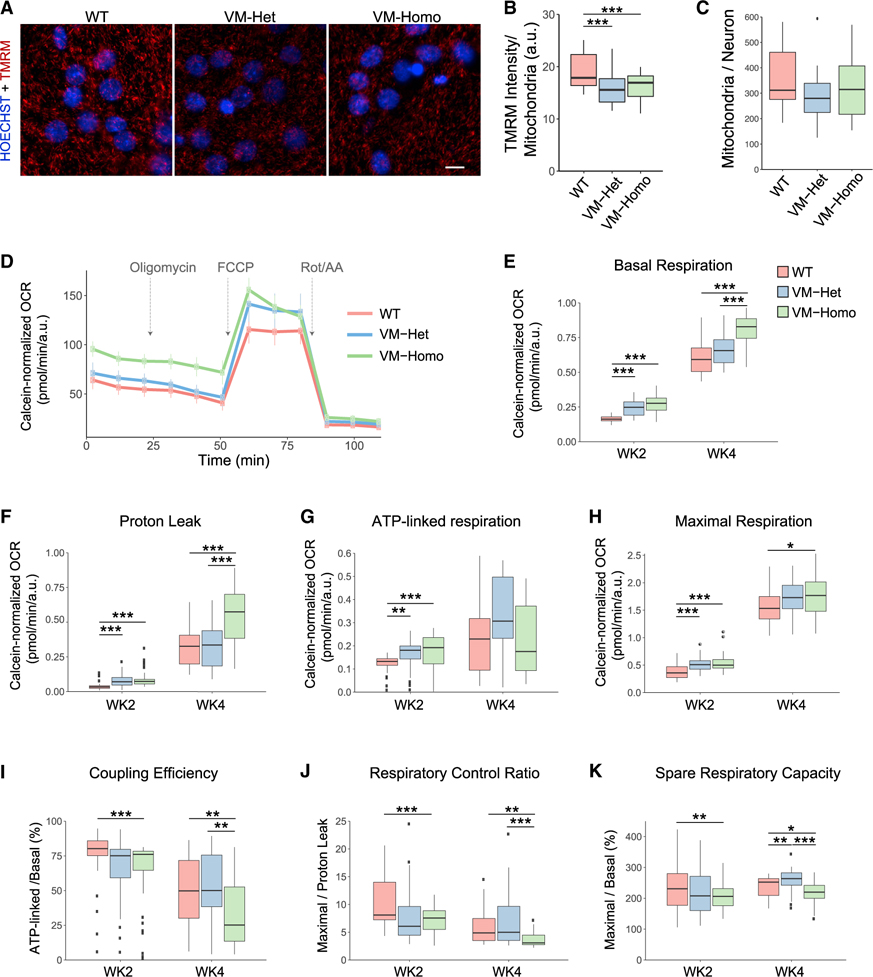
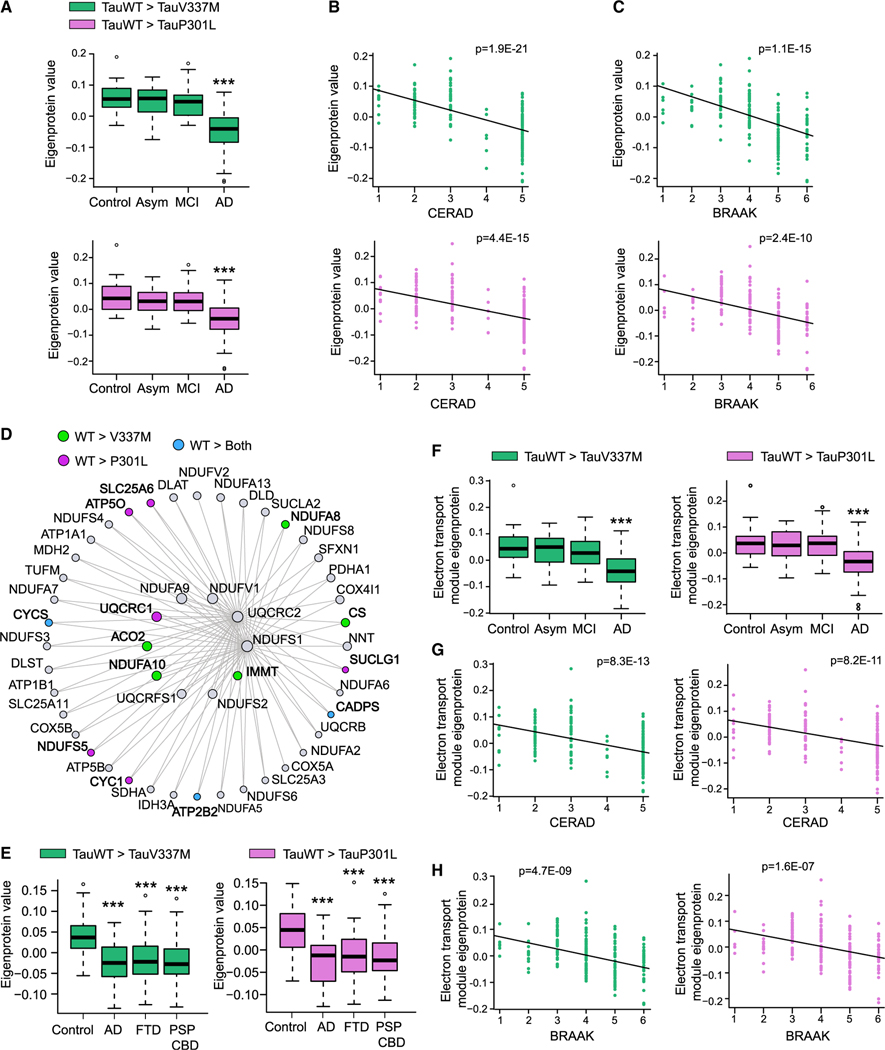
Tau (MAPT) drives neuronal dysfunction in Alzheimer disease (AD) and other tauopathies. To dissect the underlying mechanisms, we combined an engineered ascorbic acid peroxidase (APEX) approach with quantitative affinity purification mass spectrometry (AP-MS) followed by proximity ligation assay (PLA) to characterize Tau interactomes modified by neuronal activity and mutations that cause frontotemporal dementia (FTD) in human induced pluripotent stem cell (iPSC)-derived neurons. We established interactions of Tau with presynaptic vesicle proteins during activity-dependent Tau secretion and mapped the Tau-binding sites to the cytosolic domains of integral synaptic vesicle proteins. We showed that FTD mutations impair bioenergetics and markedly diminished Tau's interaction with mitochondria proteins, which were downregulated in AD brains of multiple cohorts and correlated with disease severity. These multimodal and dynamic Tau interactomes with exquisite spatial resolution shed light on Tau's role in neuronal function and disease and highlight potential therapeutic targets to block Tau-mediated pathogenesis.

Keywords: APEX; Tau; Tau secretion; affinity purification mass spectrometry; interactome; mitochondria; neurodegeneration; protein-protein interaction; synapse; tauopathies.


Conflict of interest statement

Declaration of interests L.G. is a founder of Aeton Therapeutics. N.J.K. received research support from Vir Biotechnology and F. Hoffmann-La Roche; has consulting agreements with the Icahn School of Medicine at Mount Sinai, New York, Maze Therapeutics, and Interline Therapeutics; is a shareholder in Tenaya Therapeutics, Maze Therapeutics, and Interline Therapeutics; and is a financially compensated Scientific Advisory Board Member for GEn1E Life sciences.

Figures

Figure 1.
Figure 1.. APEX-Tau-mediated proximity-dependent biotinylation in human iPSC-derived neurons
(A) Transcription Activator-Like Effector Nucleases (TALEN)-mediated integration of NGN2 into one allele of the AAVS1 locus in human iPSCs, followed by integration of APEX-Tau into the second AAVS1 allele. Arrowheads represent transcription from the transgene. (B) APEX-flag-tagged human Tau (2N4R) and Tubulin α 1B constructs. See also Figure S1. (C) Workflow of i3Neuron differentiation and experiments. (D) Western blot analysis of N- and C-terminal APEX-tagged Tau and APEX-α Tubulin expressed in i3Neurons. (E) Images of APEX-Tau expression (green) and biotinylated proteins (red) in i3Neurons. Scale bars, 100 μm.
Figure 2.
Figure 2.. Subcellular and subprotein domain Tau interactome in living human neurons identified by APEX-mediated biotinylation
(A) Workflow for proximity-dependent identification of Tau-associated proteins. (B) Venn diagram of biotinylated proteins detected in human neurons with N-APEX Tau (n = 7 cultures), C-APEX Tau (n = 9 cultures), or APEX-α Tubulin (n = 12 cultures). See also Table S1. (C) N-APEX Tau, C-APEX Tau, and APEX-α Tubulin biotinylated proteins include components of the microtubule cytoskeleton. Only interconnected nodes based on the Search Tool for the Retrieval of Interacting Genes/Proteins (STRING) database are shown. Function pathway analyses categories are grouped by color. (D) ClueGO molecular function pathway enrichment of proteins biotinylated by both N-APEX Tau and C-APEX Tau but not APEX-α Tubulin. Node colors denote functionally grouped networks (kappa connectivity score ≥ 30%). (E) Gene Set Enrichment Analysis (GSEA) on proteins biotinylated by both N-APEX and C-APEX Tau showing major cellular component categories. (F and G) ClueGO biological processes pathway enrichment of proteins biotinylated only by N-APEX Tau (F) and only by C-APEX Tau (G). (H and I) Subprotein-level APEX Tau associations identified that regulate autophagy (H) and proteasome degradation (I).
Figure 3.
Figure 3.. Mapping of biotinylation sites on Tau-associated proteins
(A) Workflow used to enrich and identify biotinylated peptides following antibiotin pulldown of proteins biotinylated by APEX Tau. (B) Venn analysis of the biotinylated tyrosines on peptides detected in human neurons expressing N-APEX Tau (n = 7 cultures), C-APEX Tau (n = 9 cultures), or APEX-α tubulin (n = 12 cultures). See also Table S2. (C) Biotinylated and unlabeled tyrosines (Y) on proteins biotinylated by APEX-α Tubulin, N-, and C-APEX Tau. See also Figure S2. (D) Biotinylation sites (stars) on SNARE complex and synaptic vesicle-associated proteins labeled by APEX Tau. Biotinylation was detected on the t-SNAREs, syntaxin, and SNAP25; however, the v-SNARE, synaptobrevin, was not detected. (E) Tyrosine residues biotinylated by N- and C-APEX Tau mapped onto SNARE complex proteins adjacent to structural and functional domains that mediate vesicle fusion. (F) Images of the PLA reaction (red) in human neurons with the Tau5 antibody alone (left) and with both the Tau5 and Munc18 antibodies (right). Scale bars, 20 μm. (G) Quantification of PLA puncta fluorescence intensity in human neurons with and without the Munc18 antibody (n = 6 images/group, ***p < 0.001, unpaired Student’s t test). Values are given as means ± SEM. See also Figure S3. (H) Biotinylated residues detected in relation to the topology of integral synaptic vesicle membrane proteins. Biotinylation sites were detected on the cytosolic, not the lumenal domains. Asterisks denote biotinylated proteins that were detected in less than half of the samples (VGLUT2, n = 3, and synaptogyrin-1, n = 2 out of 7 samples). (I) Human neurons labeled with fixable FM 1–43 dye (green) and synapsin (red) following treatment with 50-mM KCl to enhance neuronal activity. FM 1–43 dye-labeled sites of vesicle fusion at presynaptic terminals (arrows). Scale bars, 5 μm. (J) HT7 immunolabeling of Tau (red) colocalized with FM 1–43 uptake at sites of vesicle fusion in human neurons. Scale bars, 5 μm.
Figure 4.
Figure 4.. Activity-induced changes in the Tau interactome during activity-dependent Tau secretion from human neurons
(A) Quantification of Tau secreted from human neurons treated with high KCl to enhance neuronal activity and BAPTA-AM, a membrane-permeable calcium chelator. Secreted Tau measured by ELISA was normalized to total Tau in the neuron culture (n = 8–9 cultures/group, *p < 0.05, one-way ANOVA, Bonferroni post hoc analyses). Values are given as means ± SEM. (B) Lactate dehydrogenase (LDH) levels in the media collected from human neurons after 30 min with or without high KCl (n = 8–9 cultures/group). Values are given as means ± SEM. (C) Venn analyses of the biotinylated proteins and the individual biotinylation sites labeled by N-APEX Tau and C-APEX Tau without stimulation (blue, data from Figure 2B, n = 7–9 cultures/group) and with enhanced neuronal activity (red, n = 7–9 cultures/group). See also Table S3. (D and E) ClueGO biological processes pathway enrichment of proteins biotinylated by (D) N-APEX Tau or by (E) C-APEX Tau in neurons with KCl-induced activity. Analyses were performed on the 44 (D) and 70 (E) biotinylated proteins labeled in (C). See also Figure S4. (F) Activity-induced biotinylated residues detected on synaptic vesicle-associated proteins. (G) Images of PLA fluorescence with Tau5 and SYT1 antibodies in unstimulated and high-KCl-stimulated human neurons. Scale bars, 5 μm. See also Figure S3. (H) Tau5 and SYT1 PLA puncta fluorescence intensity in human neurons with and without KCL-enhanced activity (n = 6–12 images/group, ***p < 0.001, one-way ANOVA, Bonferroni post hoc analyses). Values are given as means ± SEM.
Figure 5.
Figure 5.. Comparison of interactomes of wild-type Tau and FTD Tau mutants by AP-MS with PLA validation
(A) Workflow for the affinity purification identification of Tau-associated proteins by mass spectrometry. (B) Expression levels of flag-tagged TauWT, TauP301L, and TauV337M detected by mass spectrometry in the AP-MS experiments. See also Figure S5. (C) Venn diagram indicating the number of proteins identified as differential interactors between TauWT (n = 7 cultures) and mutant Tau (TauV337M and TauP301L, n = 8 cultures/group). Proteins that preferentially interact with TauWT or FTD Tau are labeled in red and green, respectively. See also Tables S4 and S5. (D and E) ClueGO cellular compartment pathway enrichment of (D) the 184 proteins that preferentially interact with TauWT with respect to TauV337M and of (E) the 108 proteins that preferentially interact with TauWT with respect to TauP301L and are labeled in (C). See also Figure S6. (F) Illustration of TauWT-preferential interactors localized to the mitochondrial membrane. The TauWT-preferential interactors compared with TauV337M (green), TauP301L (purple), and both FTD Tau mutants (blue) are labeled. OMM, outer mitochondrial membrane; IMM, inner mitochondrial membrane. (G) Images of the PLA reactions between ATP5IF1, TOMM40, or TIMM13 and TauWT, TauV337M-Het, or TauV337M-Homo (Dako or HT7 antibodies) in 5-week-old human neurons. PLA reaction controls only contain either the antimitochondria or anti-Tau antibodies. PLA signal, red; DAPI, blue. Scale bars, 5 μm. (H–J) Quantification of the area of the PLA reaction per neuron between (H) ATP5IF1 and Tau, (I) TOMM40 and Tau, and (J) TIMM13 and Tau (n > 150 neurons/group/experiment from 3 independent experiments with 2 technical replicates, ***p < 0.001, linear mixed-effects model with Tukey’s post hoc analyses). The center lines in boxplots (H–J) represent the median with the 25th and 75th percentiles marked by the box limits. The bars extend to the farthest data points and the dots outside of the bars are outliers.
Figure 6.
Figure 6.. TauV337M neurons display mitochondrial bioenergetic alterations
(A) Images of 4-week-old TauWT, TauV337M-Het (VM-Het), and TauV337M-Homo (VM-Homo) neurons incubated with TMRM (red) and hoechst 33342 (blue). Scale bars, 5 μm. (B) TMRM intensity analysis of TauWT, TauV337M-Het, and TauV337M-Homo neurons at baseline or treated with oligomycin (n > 30,000 mitochondria/replicate from two independent experiments and >8 internal replicates/genotype and treatment, ***p < 0.001, linear mixed-effects model with Tukey’s post hoc analyses). (C) Quantification of mitochondria number per neuron from experiments depicted in (A). (D) Representative OCR measurements obtained from Seahorse assays with TauWT, TauV337M-Het, and TauV337M-Homo neurons normalized to calcein intensity. Arrows indicate addition of oligomycin, FCCP, and rotenone+antimycin A (Rot/AA). (E–H) Quantification of basal respiration (E), proton leak (F), ATP-linked respiration (G), and maximal respiration (H) from Seahorse experiments depicted in (D) with 2- and 4-week-old neurons (from 3 experiments and 8 technical replicates/condition, ***p < 0.001, **p < 0.01, *p < 0.05, linear mixed-effects model with Tukey’s post hoc analyses). (I–K) Coupling efficiency (I), respiratory control ratio (J), and spare respiratory capacity (K) were calculated using the indicated parameters from the Seahorse experiments depicted in (D–F) (***p < 0.001, **p < 0.01, *p < 0.05, linear mixed-effects model with Tukey’s post hoc analyses). The center lines in boxplots (B–K) represent the median with the 25th and 75th percentiles marked by the box limits. The bars extend to the farthest data points and the dots outside of the bars are outliers.
Figure 7.
Figure 7.. Decreased expression of TauWT-preferential interactors correlates with human AD progression
(A–C) Plots showing TauWT-preferential interactor eigenprotein trajectory with AD diagnosis (A), CERAD (B), and BRAAK (C) scores in the Banner cohort. TauWT-preferential interactors as compared with TauV337M and P301L are colored as green and pink, respectively (***p < 0.005). See also Figure S7. (D) Co-expression graph of the first 50 hub proteins of the C2-mitochondrial module showing TauWT-preferential interactors compared with TauV337M (green), P301L (pink), or both mutants (blue). (E) Plots showing C2-mitochondrial module TauWT-preferential interactor eigenprotein trajectory with AD, FTD, and PDP-CBS diagnosis in the UPenn cohort. TauWT-preferential interactors as compared with TauV337M and P301L are colored as green and pink, respectively (***p < 0.005). (F–H) Plots showing C2-mitochondrial module TauWT-preferential interactor eigenprotein trajectory with AD diagnosis (F), CERAD (G), and BRAAK (H) scores in Banner cohort. TauWT-preferential interactors as compared with TauV337M and P301L are colored as green and pink, respectively. ***p < 0.005. See also Figure S7. The center lines in boxplots (A), (F), and (E) represent the median with the 25th and 75th percentiles marked by the box limits. The bars extend to the farthest data points and the dots outside of the bars are outliers.

Comment in

References

    1. Alonso AD, Grundke-Iqbal I, Barra HS, and Iqbal K (1997). Abnormal phosphorylation of tau and the mechanism of Alzheimer neurofibrillary degeneration: sequestration of microtubule-associated proteins 1 and 2 and the disassembly of microtubules by the abnormal tau. Proc. Natl. Acad. Sci. USA 94, 298–303. - PMC - PubMed
    1. Amadoro G, Corsetti V, Atlante A, Florenzano F, Capsoni S, Bussani R, Mercanti D, and Calissano P (2012). Interaction between NH(2)-tau fragment and Abeta in Alzheimer’s disease mitochondria contributes to the synaptic deterioration. Neurobiol. Aging 33, 833, e1–833.25. - PubMed
    1. Bardai FH, Wang L, Mutreja Y, Yenjerla M, Gamblin TC, and Feany MB (2018). A conserved cytoskeletal signaling cascade mediates neurotoxicity of FTDP-17 tau mutations in vivo. J. Neurosci. 38, 108–119. - PMC - PubMed
    1. Belizaire R, Komanduri C, Wooten K, Chen M, Thaller C, and Janz R (2004). Characterization of synaptogyrin 3 as a new synaptic vesicle protein. J. Comp. Neurol. 470, 266–281. - PubMed
    1. Benussi L, Ghidoni R, Paterlini A, Nicosia F, Alberici AC, Signorini S, Barbiero L, and Binetti G (2005). Interaction between tau and alpha-synuclein proteins is impaired in the presence of P301L tau mutation. Exp. Cell Res. 308, 78–84. - PubMed

Publication types

MeSH terms