. 2022 Feb 17;185(4):729-745.e20.
doi: 10.1016/j.cell.2021.12.043. Epub 2022 Jan 20.

Cellular architecture of human brain metastases

Affiliations

Cellular architecture of human brain metastases

Hugo Gonzalez et al. Cell. .

Abstract

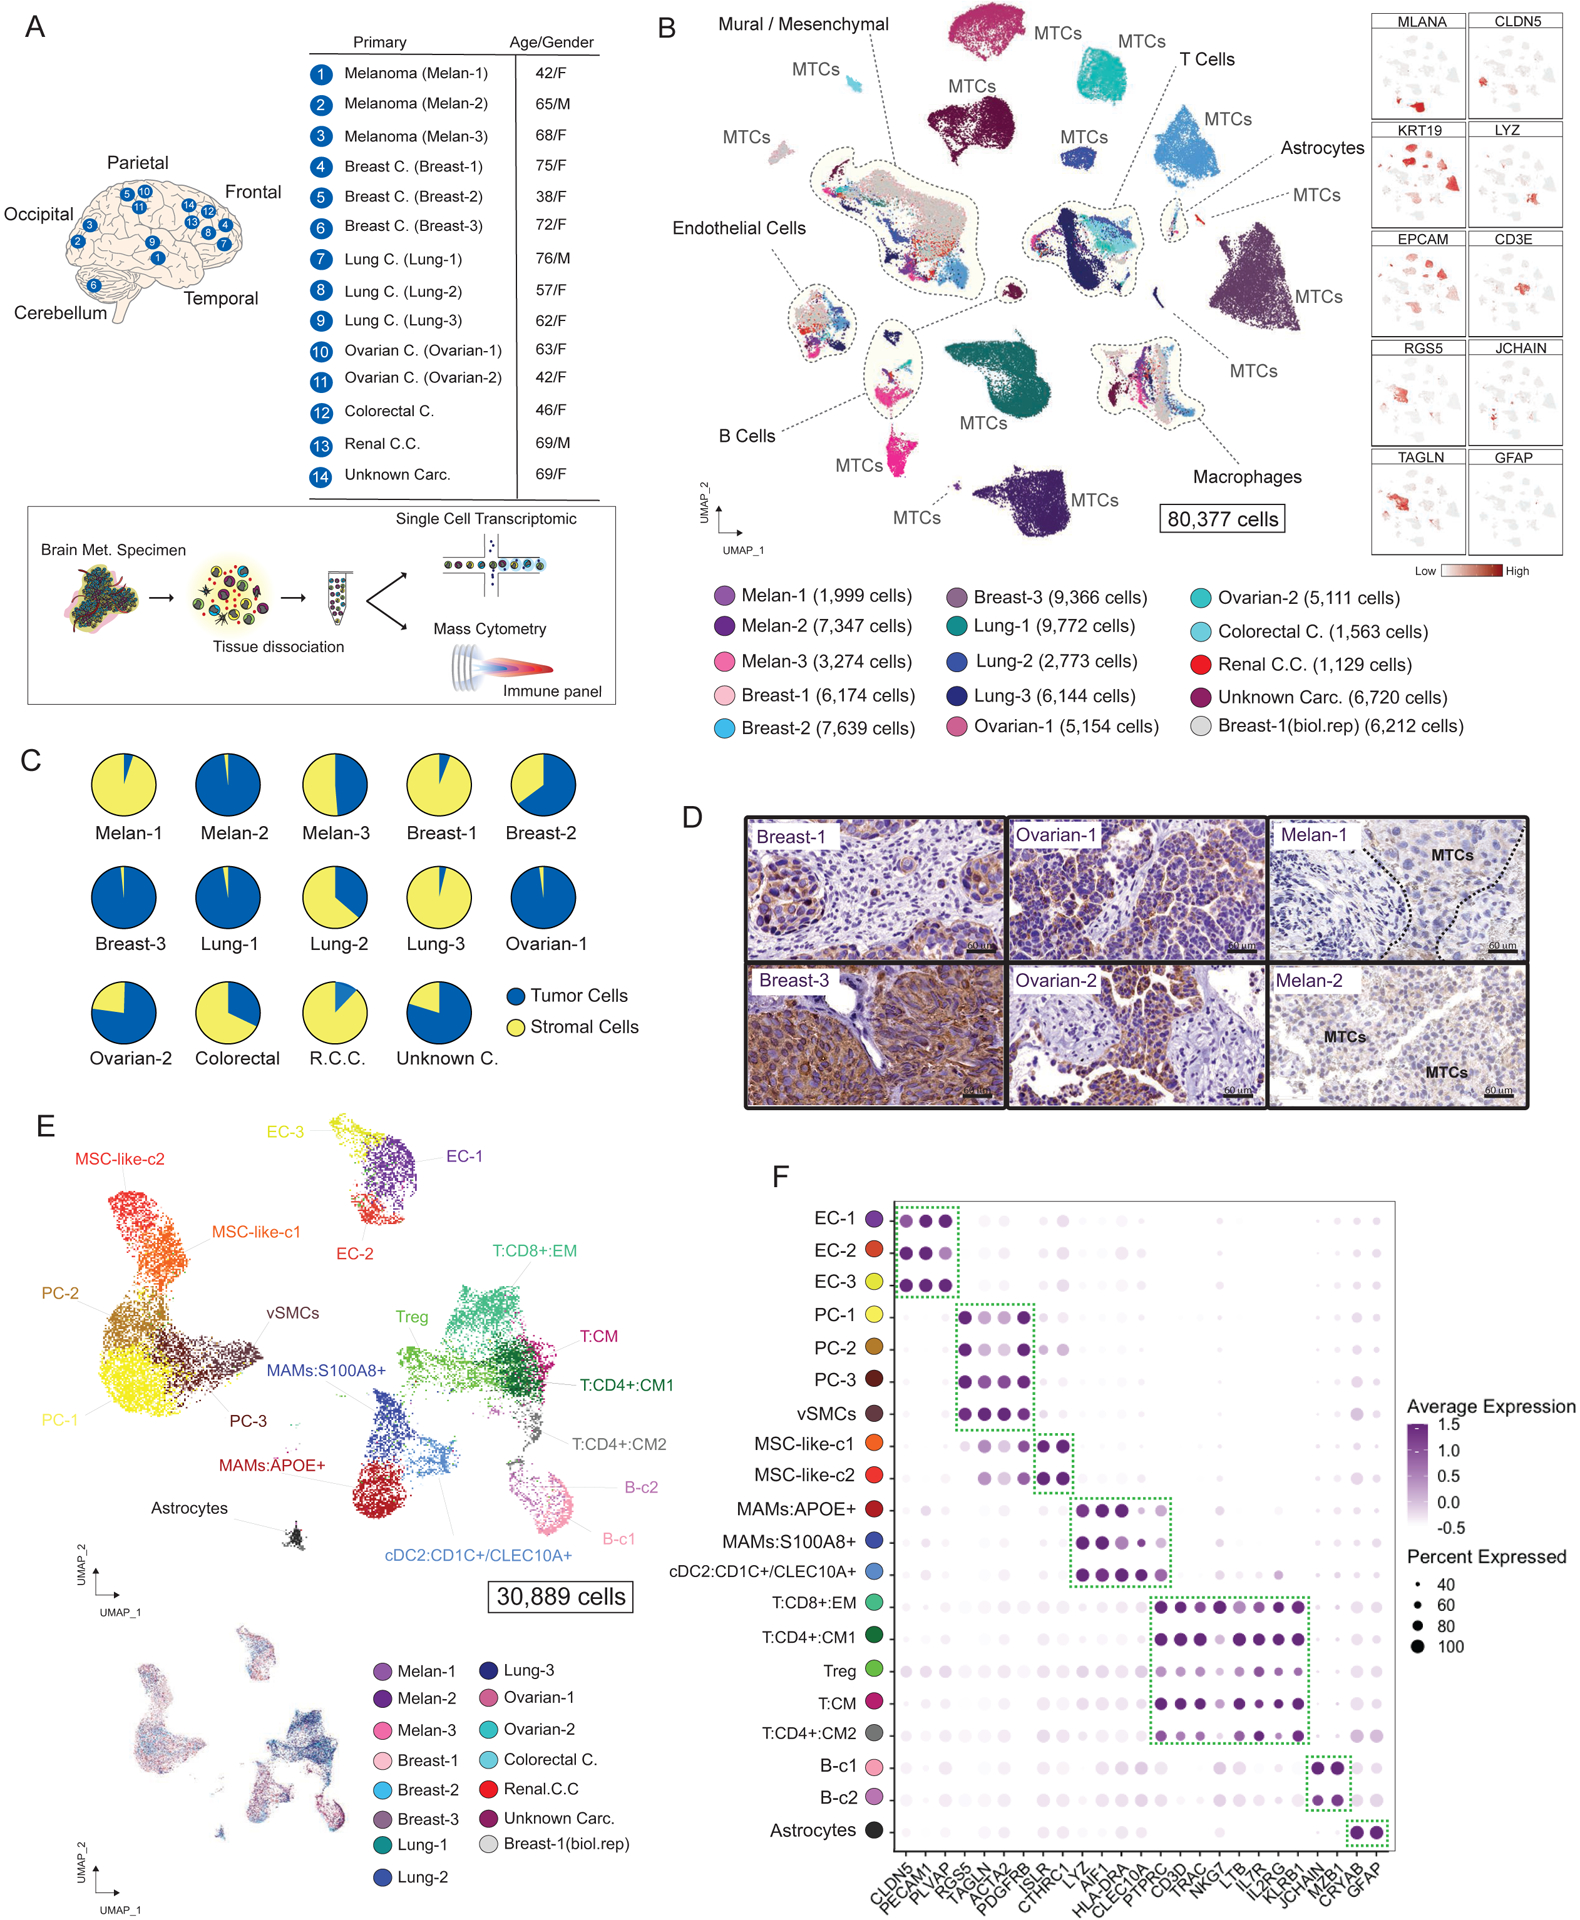
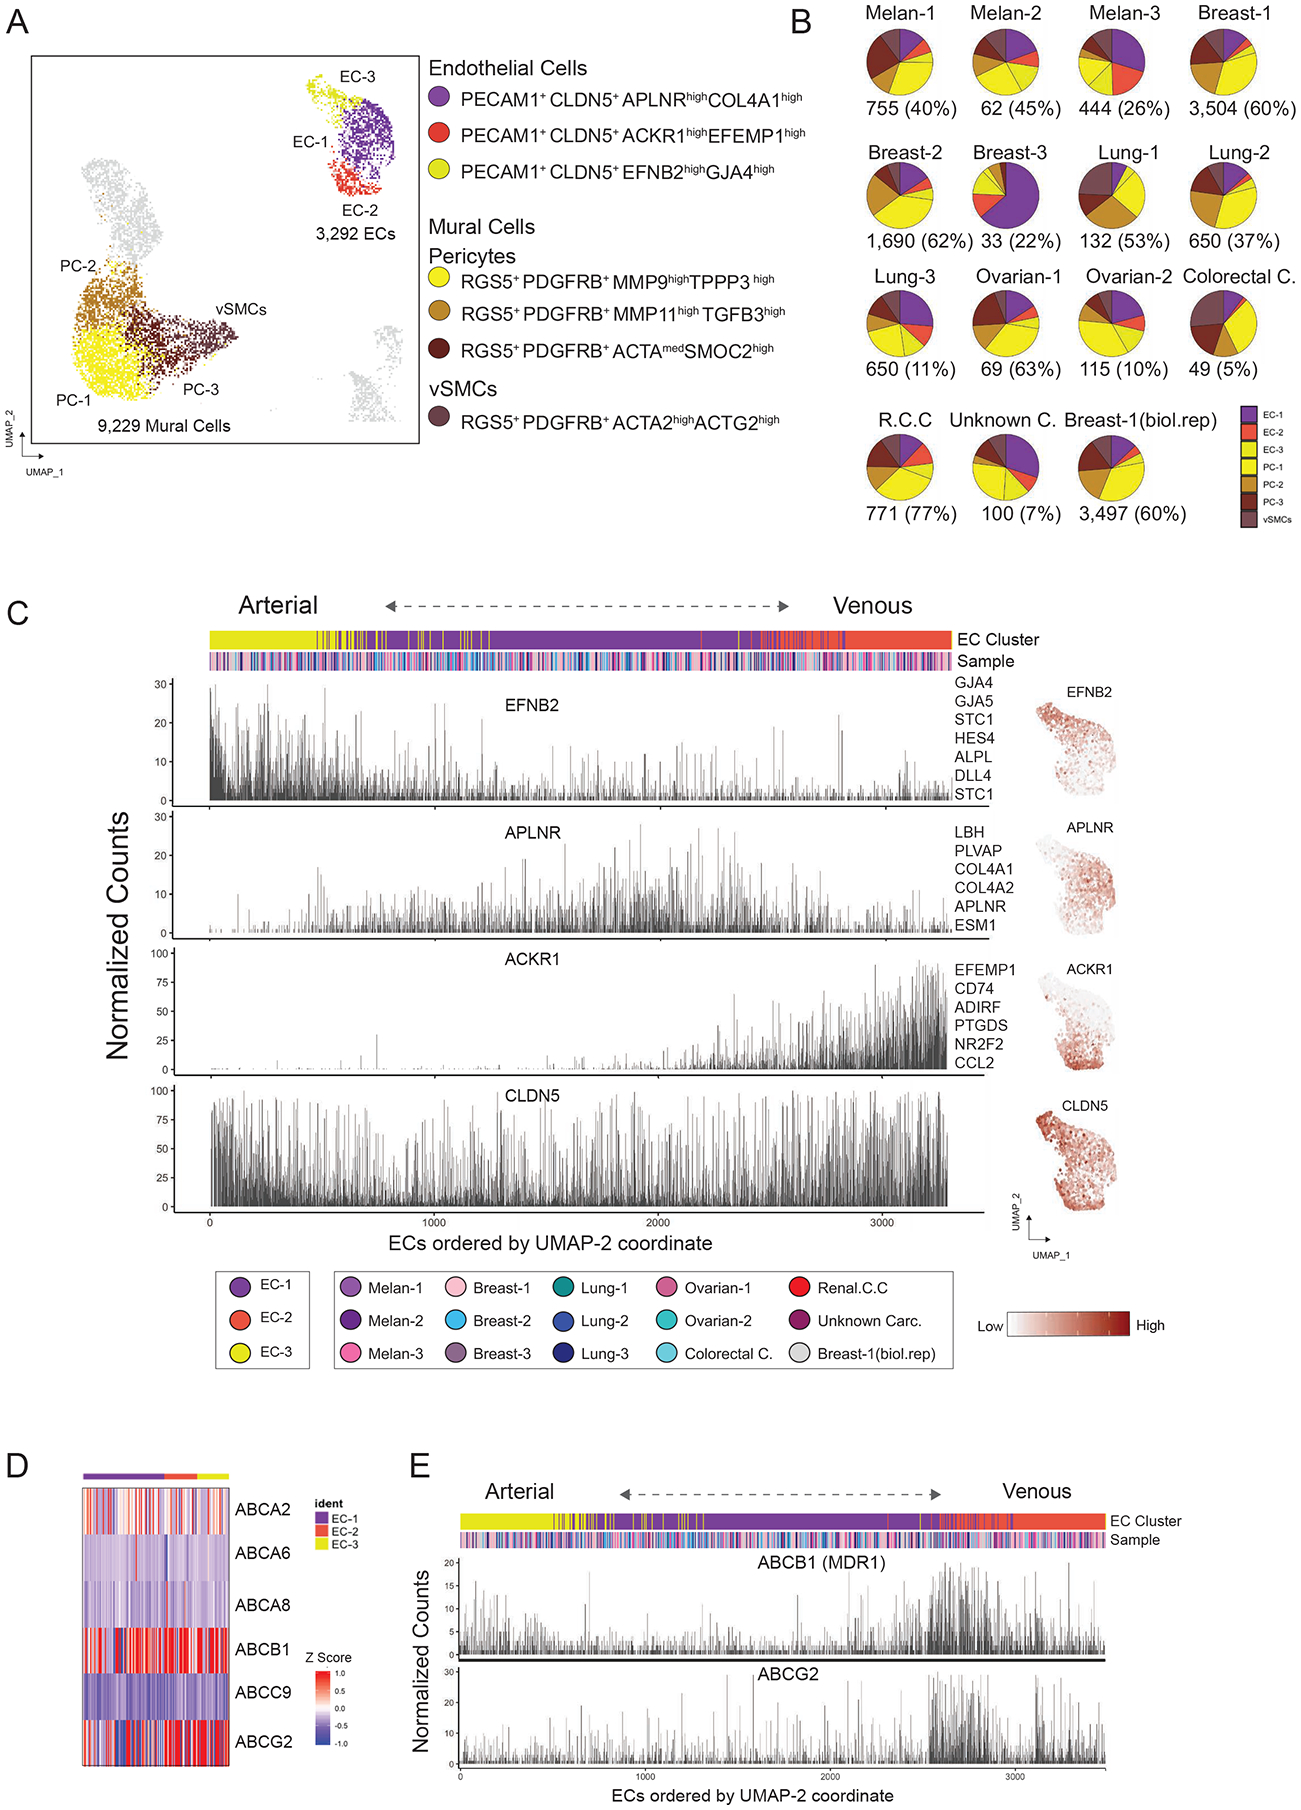
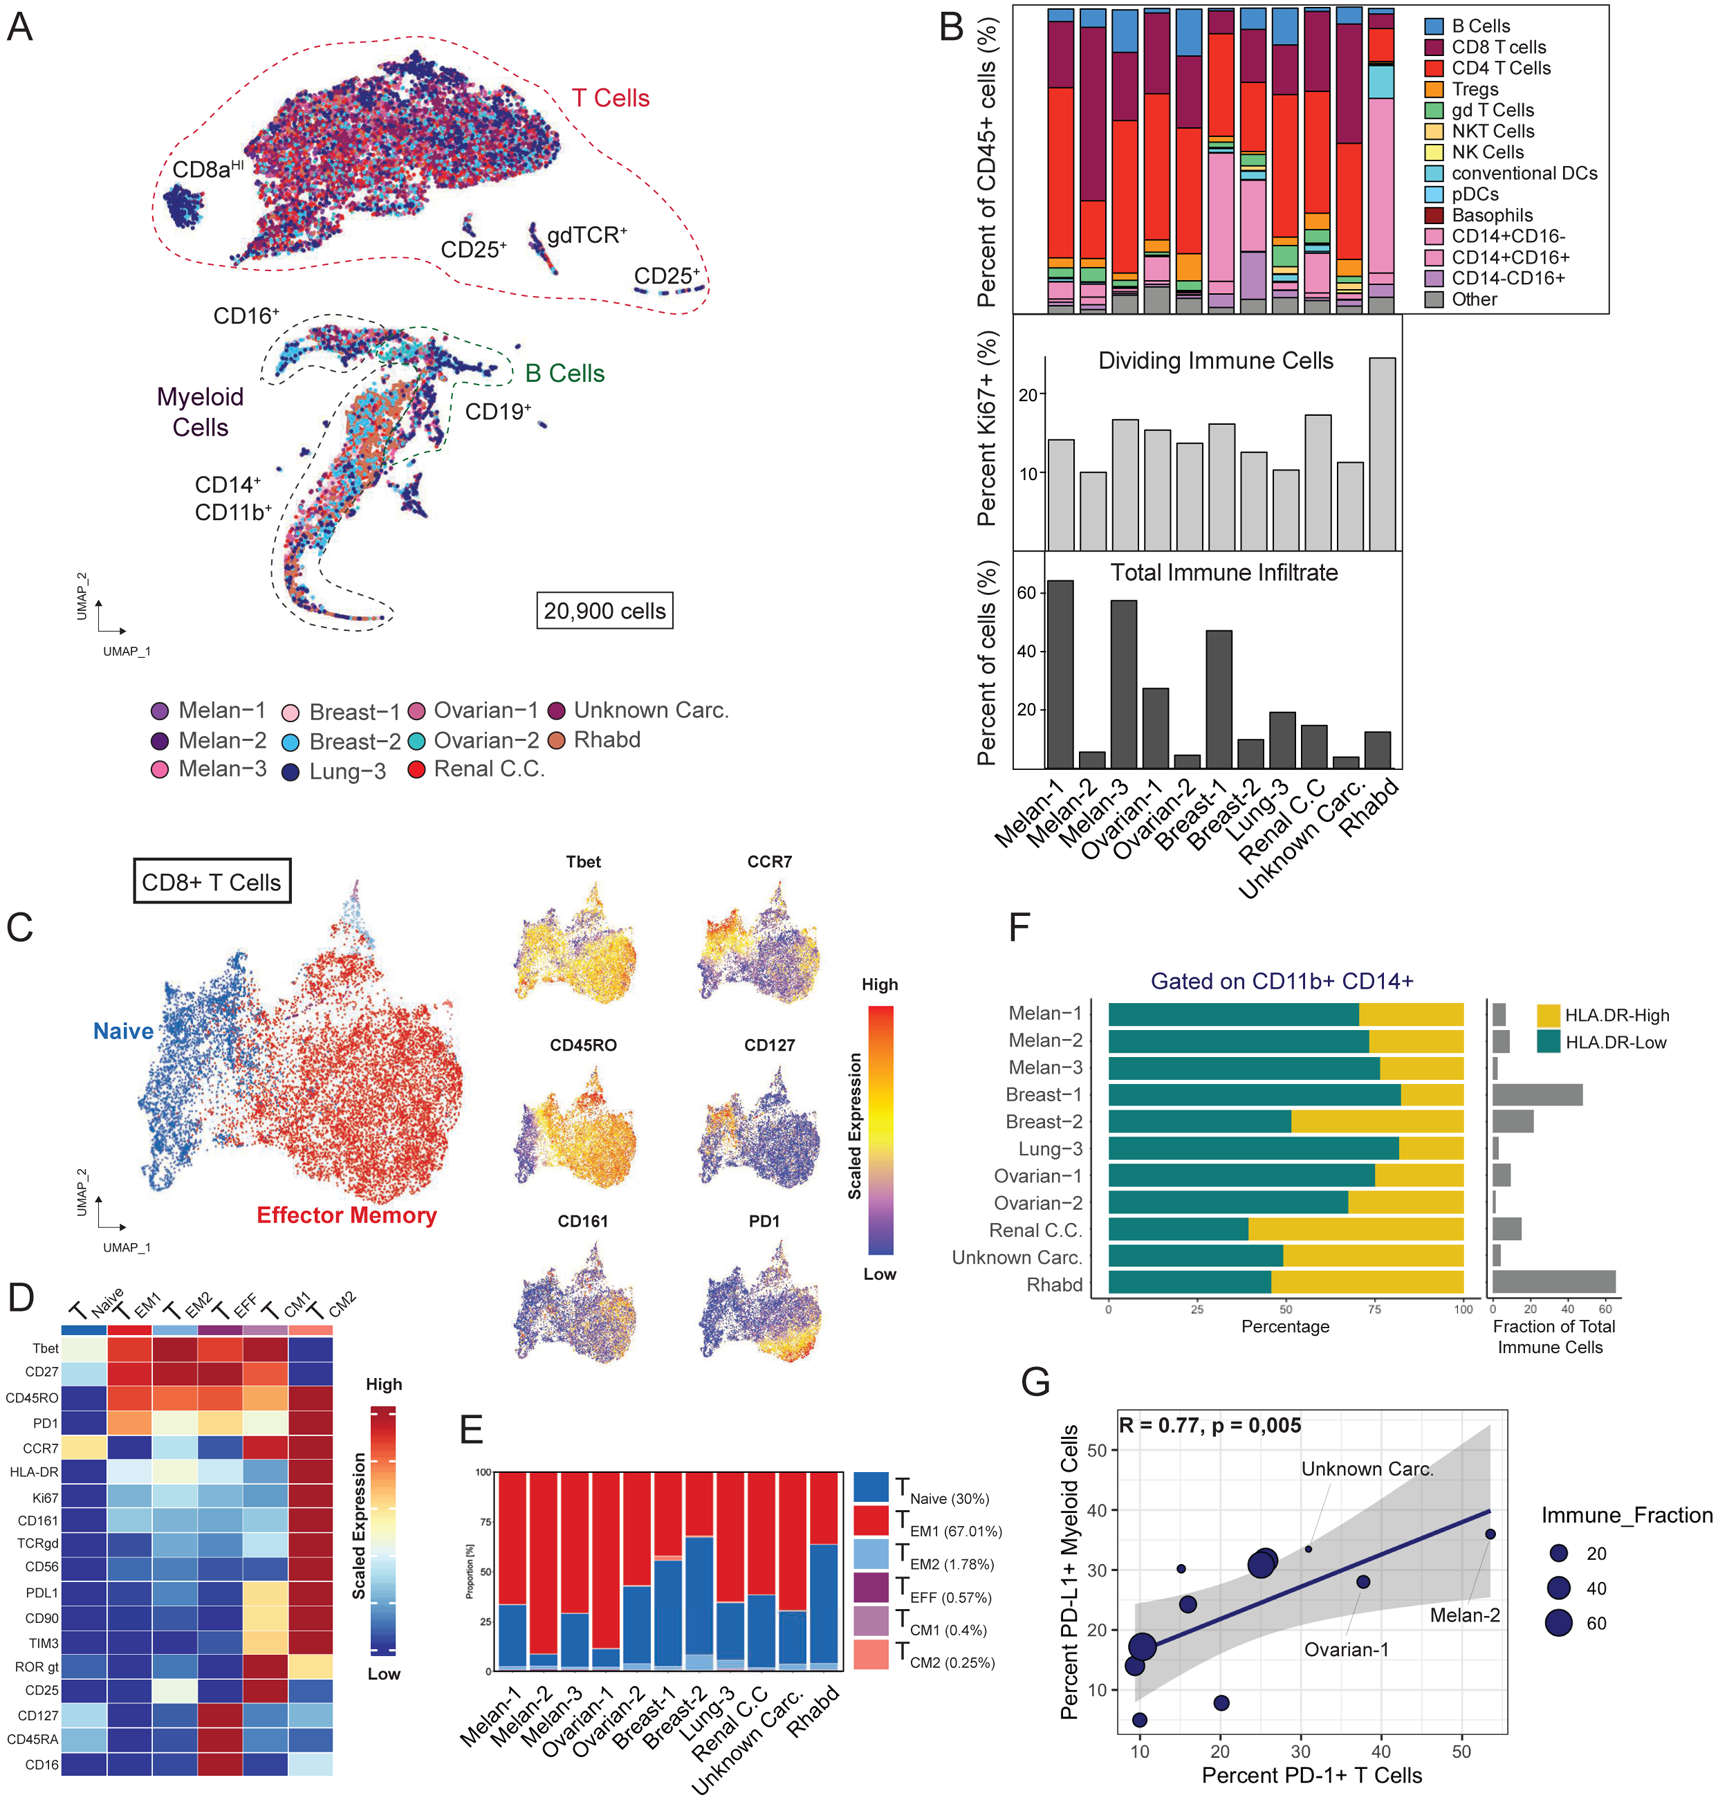
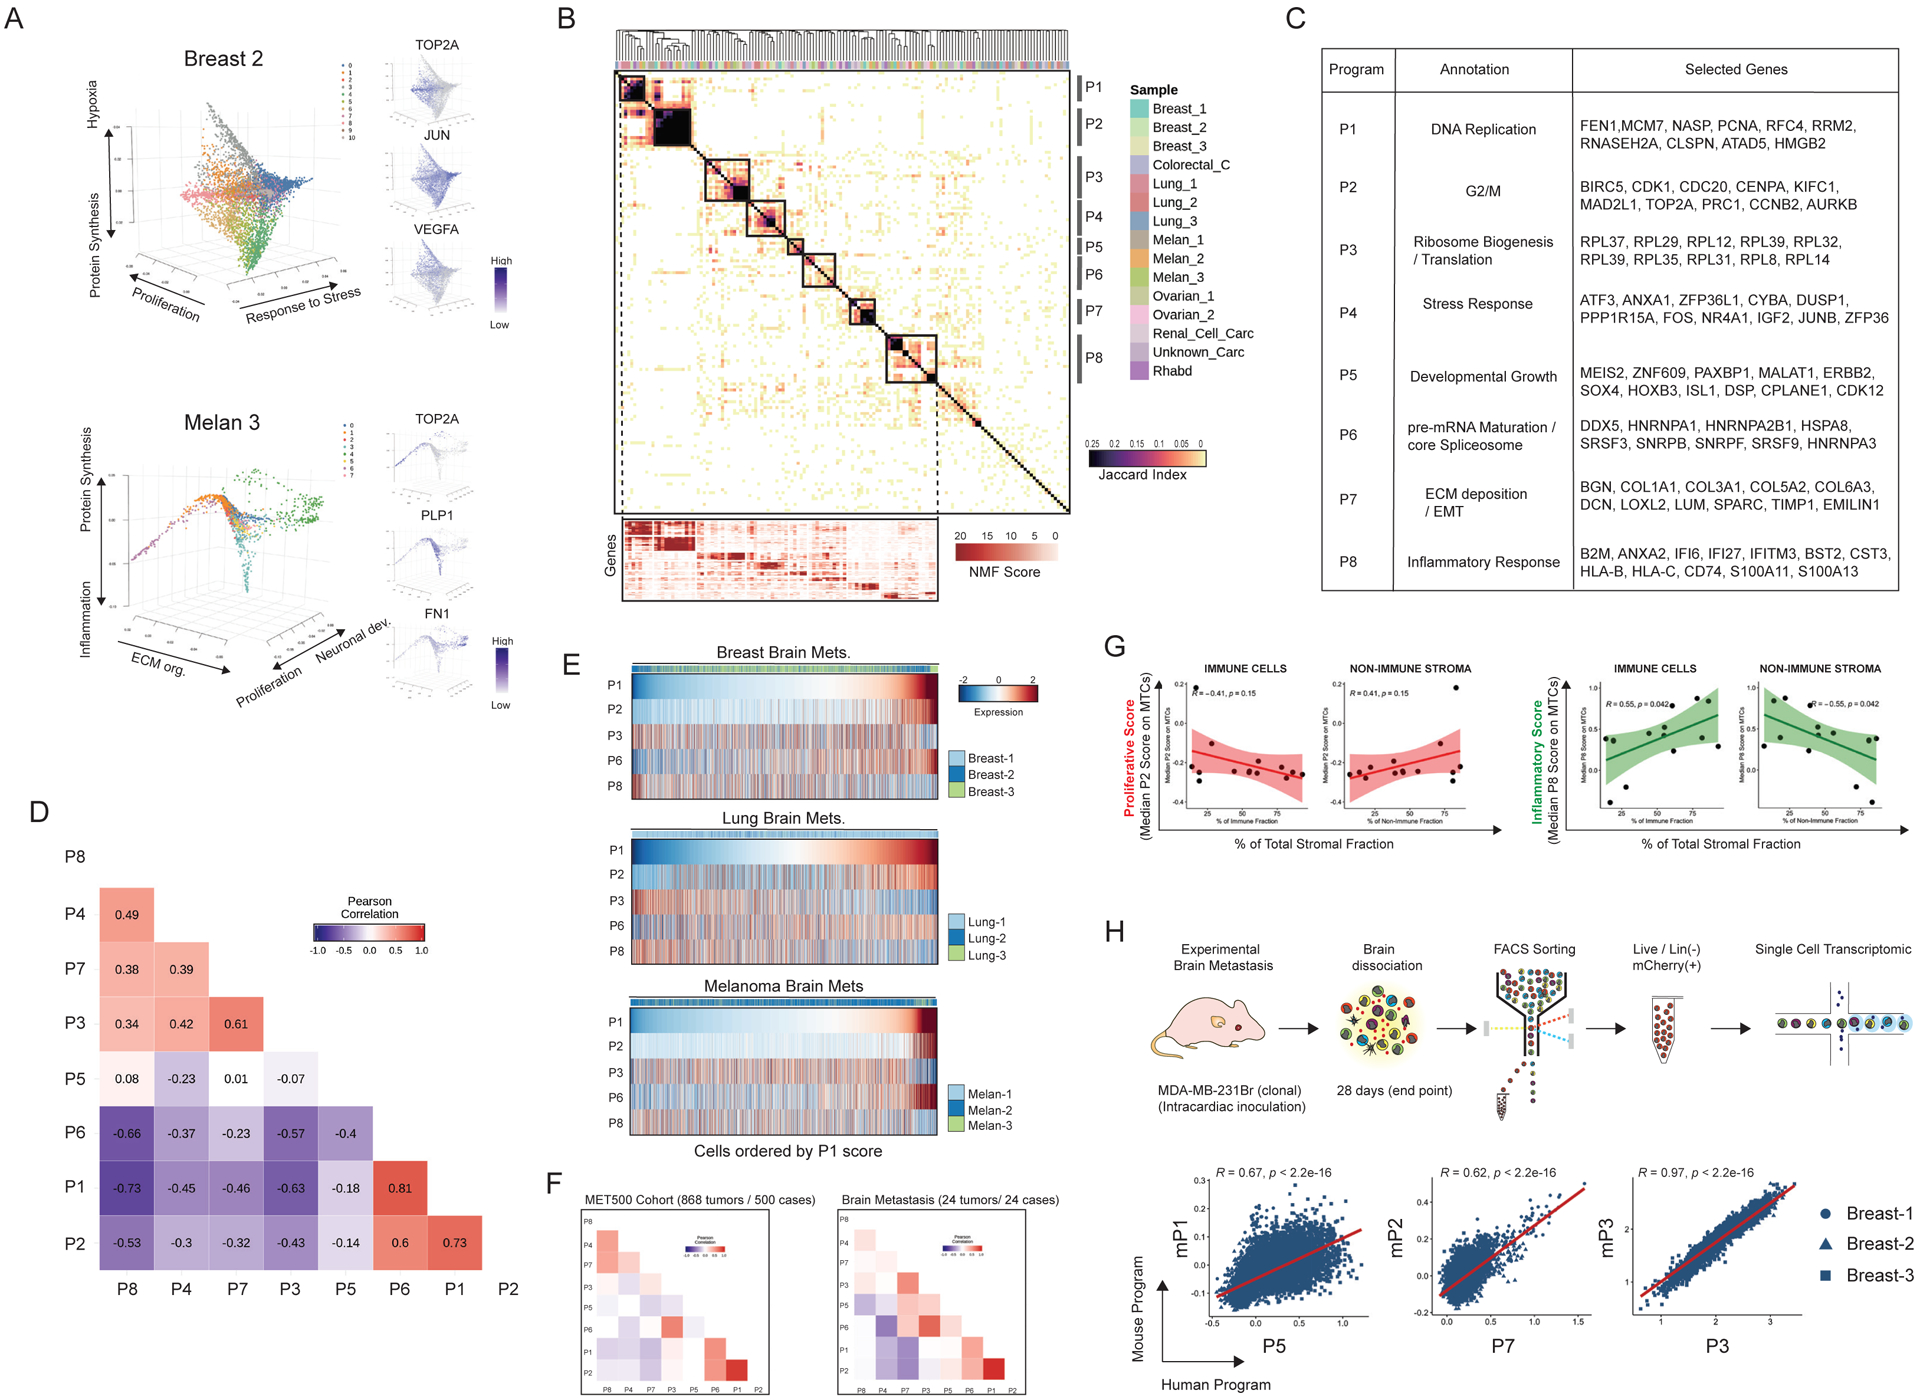
Brain metastasis (BrM) is the most common form of brain cancer, characterized by neurologic disability and an abysmal prognosis. Unfortunately, our understanding of the biology underlying human BrMs remains rudimentary. Here, we present an integrative analysis of >100,000 malignant and non-malignant cells from 15 human parenchymal BrMs, generated by single-cell transcriptomics, mass cytometry, and complemented with mouse model- and in silico approaches. We interrogated the composition of BrM niches, molecularly defined the blood-tumor interface, and revealed stromal immunosuppressive states enriched with infiltrated T cells and macrophages. Specific single-cell interrogation of metastatic tumor cells provides a framework of 8 functional cell programs that coexist or anticorrelate. Collectively, these programs delineate two functional BrM archetypes, one proliferative and the other inflammatory, that are evidently shaped through tumor-immune interactions. Our resource provides a foundation to understand the molecular basis of BrM in patients with tumor cell-intrinsic and host environmental traits.

Keywords: CyTOF; blood tumor barrier; human metastasis; metastasis-associated macrophages; metastasis-infiltrated T cells; metastatic niche; metastatic program; metastatic tumor cells; metastatic tumors; single cell.


Conflict of interest statement

Declaration of interests The authors declare no competing interests.

Figures

Figure 1.
Figure 1.. Cellular Census of Human Brain Metastases Using scRNAseq Analysis
(A) Experimental approach. (B) Visualization of 80,377 malignant (MTCs) and non-malignant single cells. Cells are colored by sample and number of cells per sample are shown. Right panel displays feature plots for selected markers. (C) Pie charts illustrating the tumor purity of each BrM biopsy. (D) IHC staining showing the expression of KRT19 or Melan-A in selected carcinoma or melanoma BrMs (Scale bars, 60 μm). (E) Projection of 30,889 BrM-associated stromal cells including immune and non-immune fractions. (F) Dot plots of conserved and cell-type specific markers in BrM-associated stromal cells. See also Figure S1 and Table S2.
Figure 2.
Figure 2.. Uncovering the BrM-associated Blood-Tumor-Interface (BTI)
(A) Visualization of 3,292 endothelial cells and 9,229 mural vascular cells using UMAP embedding. (B) Pie charts illustrating the endothelial and mural vascular cell frequency per sample. Number of cells and percentage of the stromal fraction per sample are shown. (C) Zonal expression of arterial and venous transcripts across endothelial cells sorted by the UMAP-2 coordinate, with clusters and sample distribution shown above. Right panel illustrates feature plots for selected endothelial markers. (D) Expression of multi-specific ATP-binding cassette (ABC) transporters detected in BrM associated endothelial cells. (E) Expression of ABCB1 (MDR1) and ABCG2 across the arteriovenous axis sorted by the UMAP-2 coordinate. See also Figure S2.
Figure 3.
Figure 3.. Immune Cell Types and Activation States Enriched in Human BrMs
(A) UMAP plot of immune clusters. Bottom panel displays feature plots for selected markers. (B) Frequencies of immune clusters per sample, indicating the number of cells. (C) T cell clusters ordered by the diffusion component 1 score, visualized with density ridgeline plot. (D) Scatterplot showing the co-expression of the diffusion component 1 genes and a curated T cell activation signature (GO:0042110). T cell clusters are labeled colors. (E) Heatmap reporting the average expression of microenvironmental and metabolic gene signatures in each T cell cluster. (F) Boxplots displaying the normalized expression of known and new T cell anergic markers. (G) Heatmap of myeloid clusters, and representative markers. (H) 2D projection of the diffusion map analysis on macrophages clusters, which shows a continuum phenotypic change between two macrophages states. Bottom panel shows the normalized expression of selected markers. (I) RNA velocity analysis embedded in 2D diffusion map plot for samples Breast-1 and Melan-2. (J) Boxplots of transcriptional factors differentially expressed between macrophages clusters, with t-test statistics. (K) Heatmap showing the normalized expression level for selected markers for antigen presentation, inflammatory and migratory related processes in cDC2:CD1C+/CLEC10A+ cluster (879 cells). See also Figures S3, 4, S4 and Table S2.
Figure 4.
Figure 4.. Mass Cytometry Analysis of BrM-associated Immune infiltrates
(A) UMAP projection of 20,900 immune cells showing the major immune cell populations. Cells are colored by sample. (B) Frequencies of major immune cell populations. (C) CD8+ T cell population clustered by FlowSOM and visualized by UMAP (see STAR Methods). (D) Functional and phenotypic median expression profiles for each CD8+ T cell clusters. (E) CD8+ T cell cluster proportions by patients. (F) Frequency of HLA-DR-high and HLA-DR-low cells within the CD11b+CD14+ population. (G) Scatterplot showing the correlated expression of PD-L1 by myeloid cells and PD-1 by T cells. See also Figure S4 and Table S3.
Figure 5.
Figure 5.. Metastatic Cells Acquire Two Well-Defined Functional Archetypes
(A) Intra-tumoral diversity of metastatic cells in two selected samples evaluated by diffusion map analysis and clustering. Right panel shows the normalized expression of selected markers. (B) Hierarchical clustering of pairwise similarities between NMF programs identified across metastatic cells from all the analyzed samples. Bottom panel displays the NMF scores of signature genes (rows) for each metaprogram (columns). (C) Annotation and selected top genes for each metaprogram. (D) Heatmap displays the Pearson correlation coefficients calculated between the single-cell gene signature scores of NMF metaprograms. (E) Heatmap showing the expression of selected metaprograms. Cells were plotted by cancer type (breast, lung, and melanoma) and ordered by the P1 score. (F) Correlation coefficients calculated by scoring the 868 samples from MET500 cohort for the NMF metaprograms. Samples were plotted including all (n: 868) metastatic samples (left) and just BrM (n: 24) (right). (G) Scatter plot comparing the median score value for inflammatory (P8) or proliferative (P2) metaprograms on MTCs, and the composition of the stromal fraction in each sample. (H) Interrogation of the functional equivalence of human vs mouse BrM programs. Top panel shows the schematic illustration of the murine brain metastasis and scRNAseq analysis approach. Scatterplots display the co-expression of human NMF metaprograms scores (x axis) and mouse programs scores (y axis) in single cells from the 3 breast cancer BrM samples. See also Figure S5, Figure S6 and Table S4.
Figure 6.
Figure 6.. Reconstruction of the Transition from Quiescence to Proliferation in Metastatic Cells
(A) Principal component analysis (PCA) of all metastatic cells colored by patient. (B) Immunohistochemical staining of the proliferative marker Ki67 in two selected samples. Two representative images per sample are shown. Scale bars, 100 μm. (C) Heatmap showing the conserved core signature that describes the transition from cell cycle arrest to proliferative reactivation in metastatic cells. Cells are ordered from left to right by cycling score (CS). (D) Validation at protein level of the patterns observed in scRNAseq. Images of dual immunofluorescent staining of Ki67 and PEG10 or S100A6 in multiple BrM samples. DAPI denotes nuclear staining. For each field, representative cells that denote the differential expression of S100A6 and PEG10 in cycling and non-cycling cells-are indicated by arrowheads. Scale bars, 50 μm. See also Figure 7 and Table S5.
Figure 7.
Figure 7.. Immune Evasive State of Proliferating Metastatic Cells
(A) Scatterplots showing the correlation of the expression of genes downregulated and up-regulated in cycling metastatic cells (y axis) with the magnitude of immune infiltration (MimmScore) across 868 metastatic tumors (MET500 cohort) (x axis). (B) Relative proportions of immune infiltrates in MET500 samples with high immune composition evaluated by CIBERSORT with the estimation confidence (empirical p-val <0.05). The color represents the Spearman correlation coefficients between estimated cell type fractions and the expression of a signature called “genes down in cycling MTCs”. (C-D) Immunohistochemical staining and quantification of the proliferative marker Ki67 and the immune marker CD45 in an external cohort of 13 BrM samples (Lung = 5, Melanoma = 5, Breast = 3). Scale bars, 100 μm. Bottom panel shows the correlation between the percentage of proliferation (x axis) and immune infiltration (y axis). (E) Immunohistochemical staining of the proliferative marker Ki67, immune marker CD45, markers down-regulated (CD63) and up-regulated (PEG10) in cycling metastatic tumor cells. Two BrM cases patients are shown. Scale bars, 100 μm. See also Figure 6 and Table S5.

Comment in

References

    1. Achrol AS, Rennert RC, Anders C, Soffietti R, Ahluwalia MS, Nayak L, Peters S, Arvold ND, Harsh GR, Steeg PS, et al. (2019). Brain metastases. Nat Rev Dis Primers 5, 5. - PubMed
    1. Angerer P, Haghverdi L, Buttner M, Theis FJ, Marr C, and Buettner F (2016). destiny: diffusion maps for large-scale single-cell data in R. Bioinformatics 32, 1241–1243. - PubMed
    1. Arvanitis CD, Ferraro GB, and Jain RK (2020). The blood-brain barrier and blood-tumour barrier in brain tumours and metastases. Nat Rev Cancer 20, 26–41. - PMC - PubMed
    1. Azizi E, Carr AJ, Plitas G, Cornish AE, Konopacki C, Prabhakaran S, Nainys J, Wu K, Kiseliovas V, Setty M, et al. (2018). Single-Cell Map of Diverse Immune Phenotypes in the Breast Tumor Microenvironment. Cell 174, 1293–1308 e1236. - PMC - PubMed
    1. Bae S, Bessho Y, Hojo M, and Kageyama R (2000). The bHLH gene Hes6, an inhibitor of Hes1, promotes neuronal differentiation. Development 127, 2933–2943. - PubMed

Publication types

MeSH terms

Substances