

Review
doi: 10.1016/j.molcel.2021.12.022.
Technological advances in super-resolution microscopy to study cellular processes
Affiliations
- PMID: 35063099
- PMCID: PMC8852216
- DOI: 10.1016/j.molcel.2021.12.022
Item in Clipboard
Review
Technological advances in super-resolution microscopy to study cellular processes
Mol Cell.
.
Abstract
Since its initial demonstration in 2000, far-field super-resolution light microscopy has undergone tremendous technological developments. In parallel, these developments have opened a new window into visualizing the inner life of cells at unprecedented levels of detail. Here, we review the technical details behind the most common implementations of super-resolution microscopy and highlight some of the recent, promising advances in this field.
Copyright © 2021 Elsevier Inc. All rights reserved.
Conflict of interest statement
Declaration of interests The authors declare no conflict of interest.
Figures
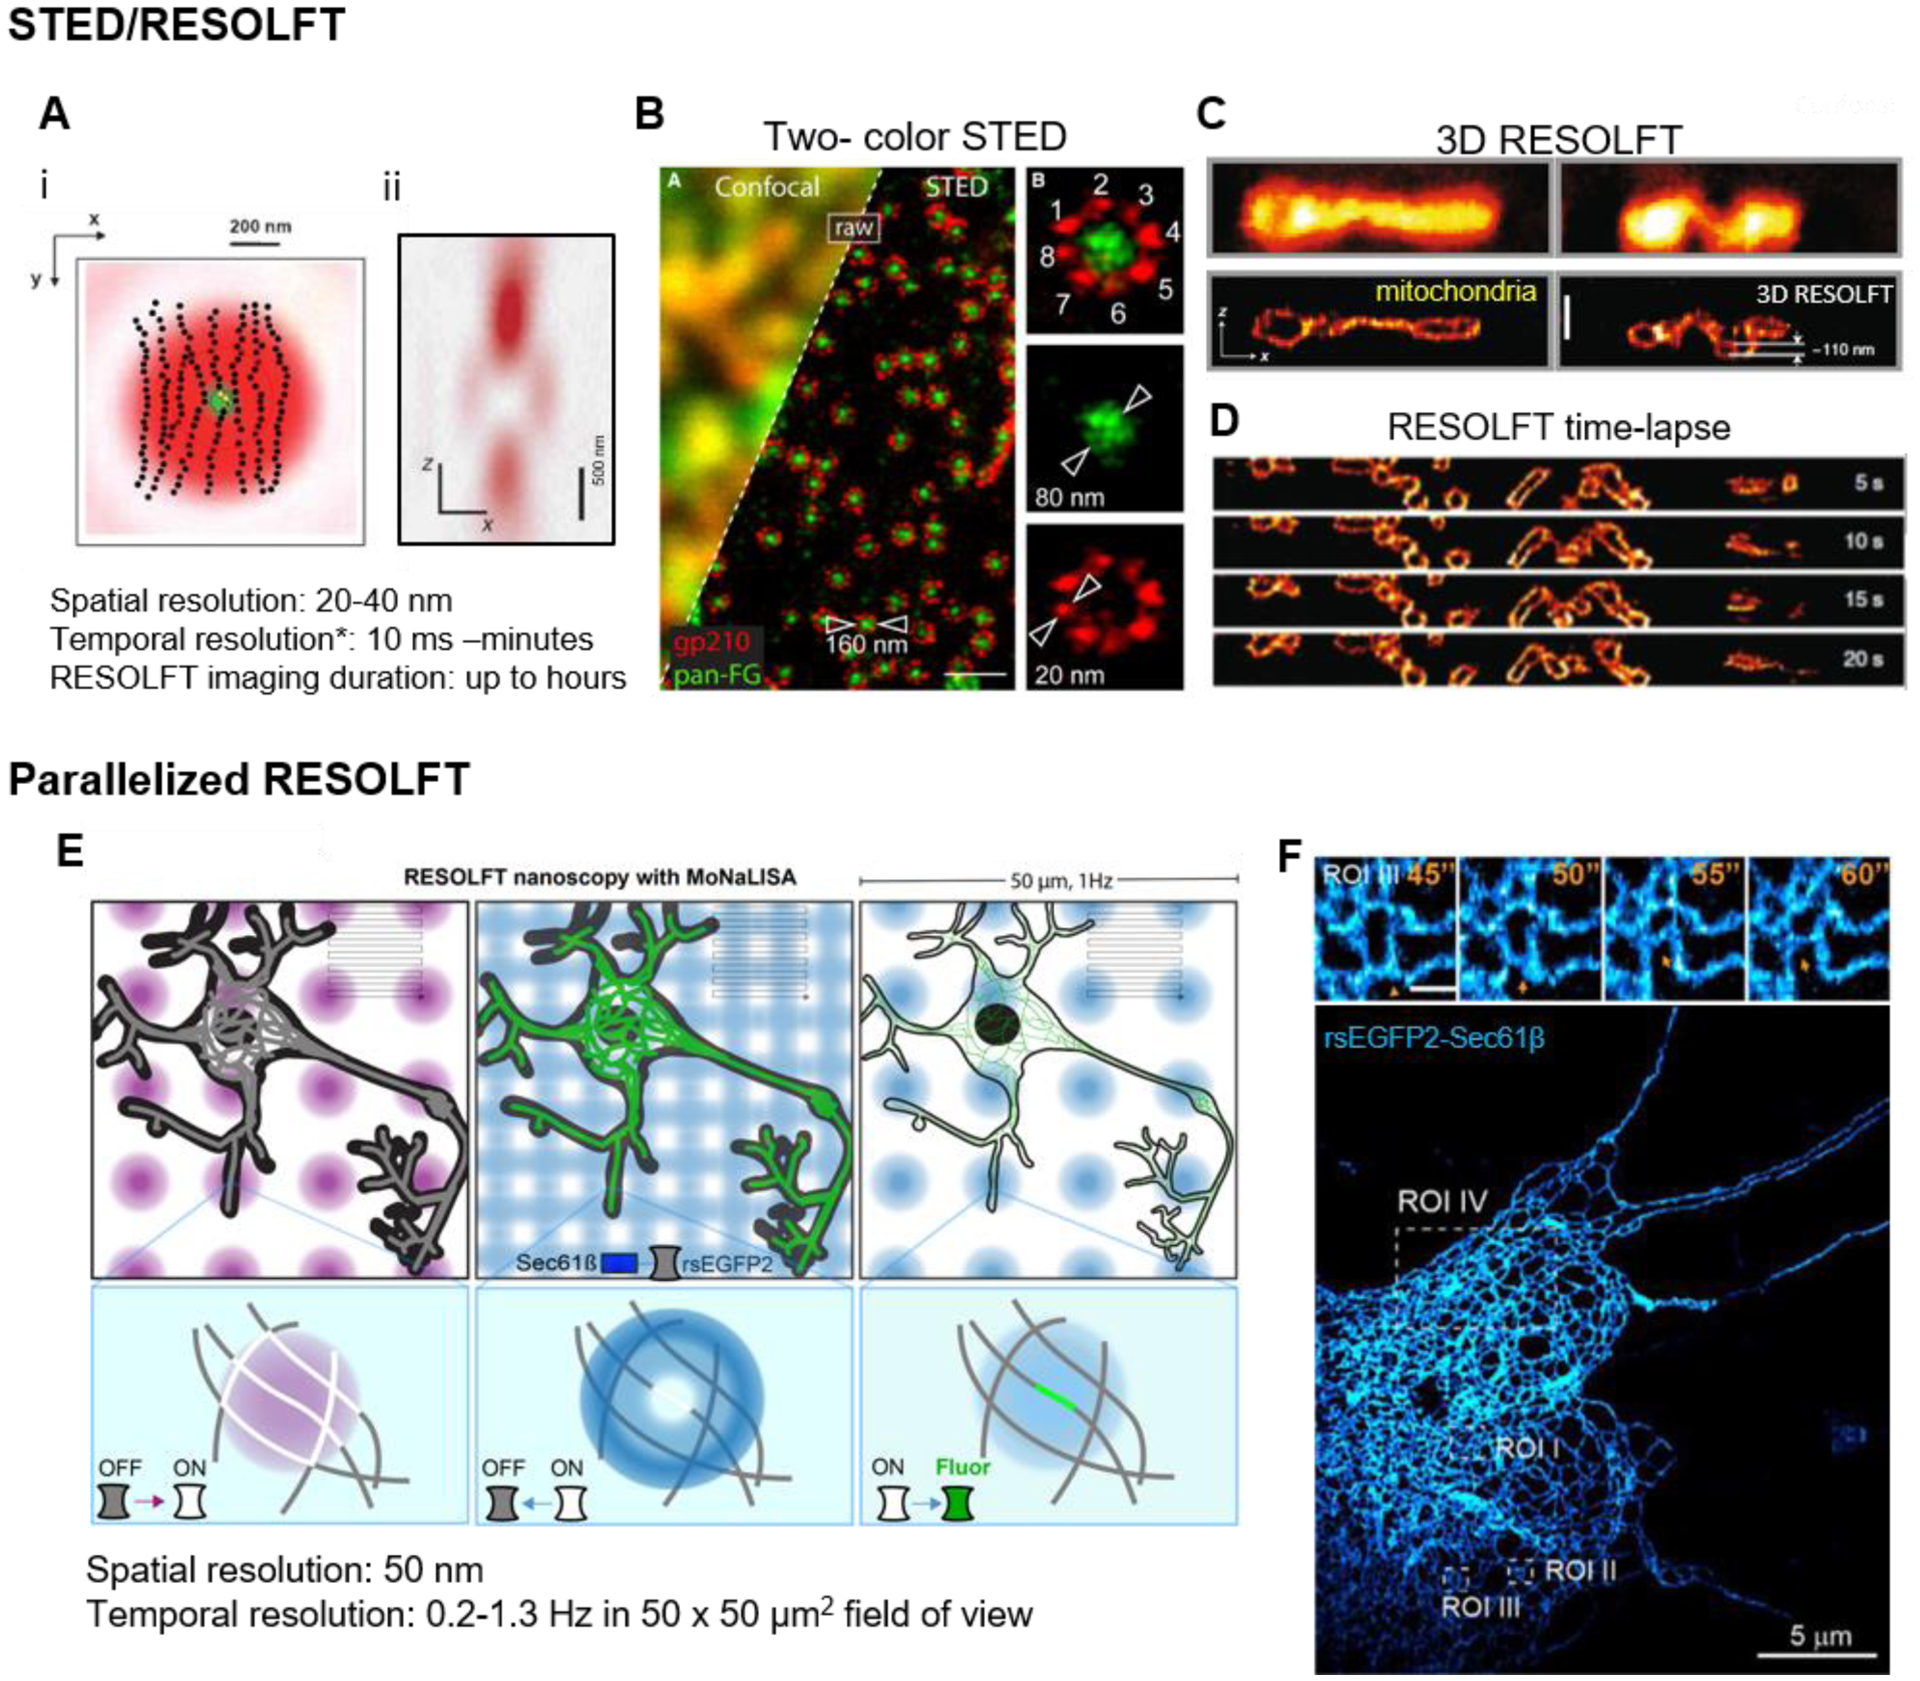
(A) (i) STED depletion beam (red) geometry in lateral (x,y) dimension overlayed with the excitation beam (green), and (ii) cross-section of the z depletion beam to improve axial resolution (Hell, 2015; Willig et al., 2007). The intensity at center of the STED beam is zero, which allows for the few molecules there remain fluorescent (yellow dots) while the surrounding molecules are forced to the dark state (black dots). *temporal resolution scales inversely with the size of the field-of-view. (B) Two-color STED image of Xenopus nuclear pore complex. Scale bar, 500 nm (Göttfert et al., 2013). (C) 3D volumetric RESOLFT image of mitochondria in the axial direction in a U2OS cell expressing rsEGFP2-Omp25. Upper two panels, enhanced confocal images without 3D off-switching. Lower two panels, 3D RESOLFT images. Scale bar, 500 nm (Bodén et al., 2021). (D) Axial mitochondria dynamics (rsEGFP2-Omp25) captured by 3D RESOLFT (Bodén et al., 2021). (E) The scheme of parallelized RESOLFT (MoNaLISA) imaging the neuronal ER labeled with rsEGFP2-Sec61β (Damenti et al., 2021). The imaging setup includes parallelized foci switch-on/off and readout as illustrated. These foci only need to scan a limited fraction of the whole field (indicated by the gray lines) to cover a large 50 μm2 field of view. (F) An extensive ER network (rsEGFP2-Sec61β) in a hippocampal neuron, super-resolved by parallelized RESOLFT. Scale bar, 5 μm. Inset: zoomed in dynamics of ER at 0.2 Hz in the ROI II. Scale bar, 500 nm.
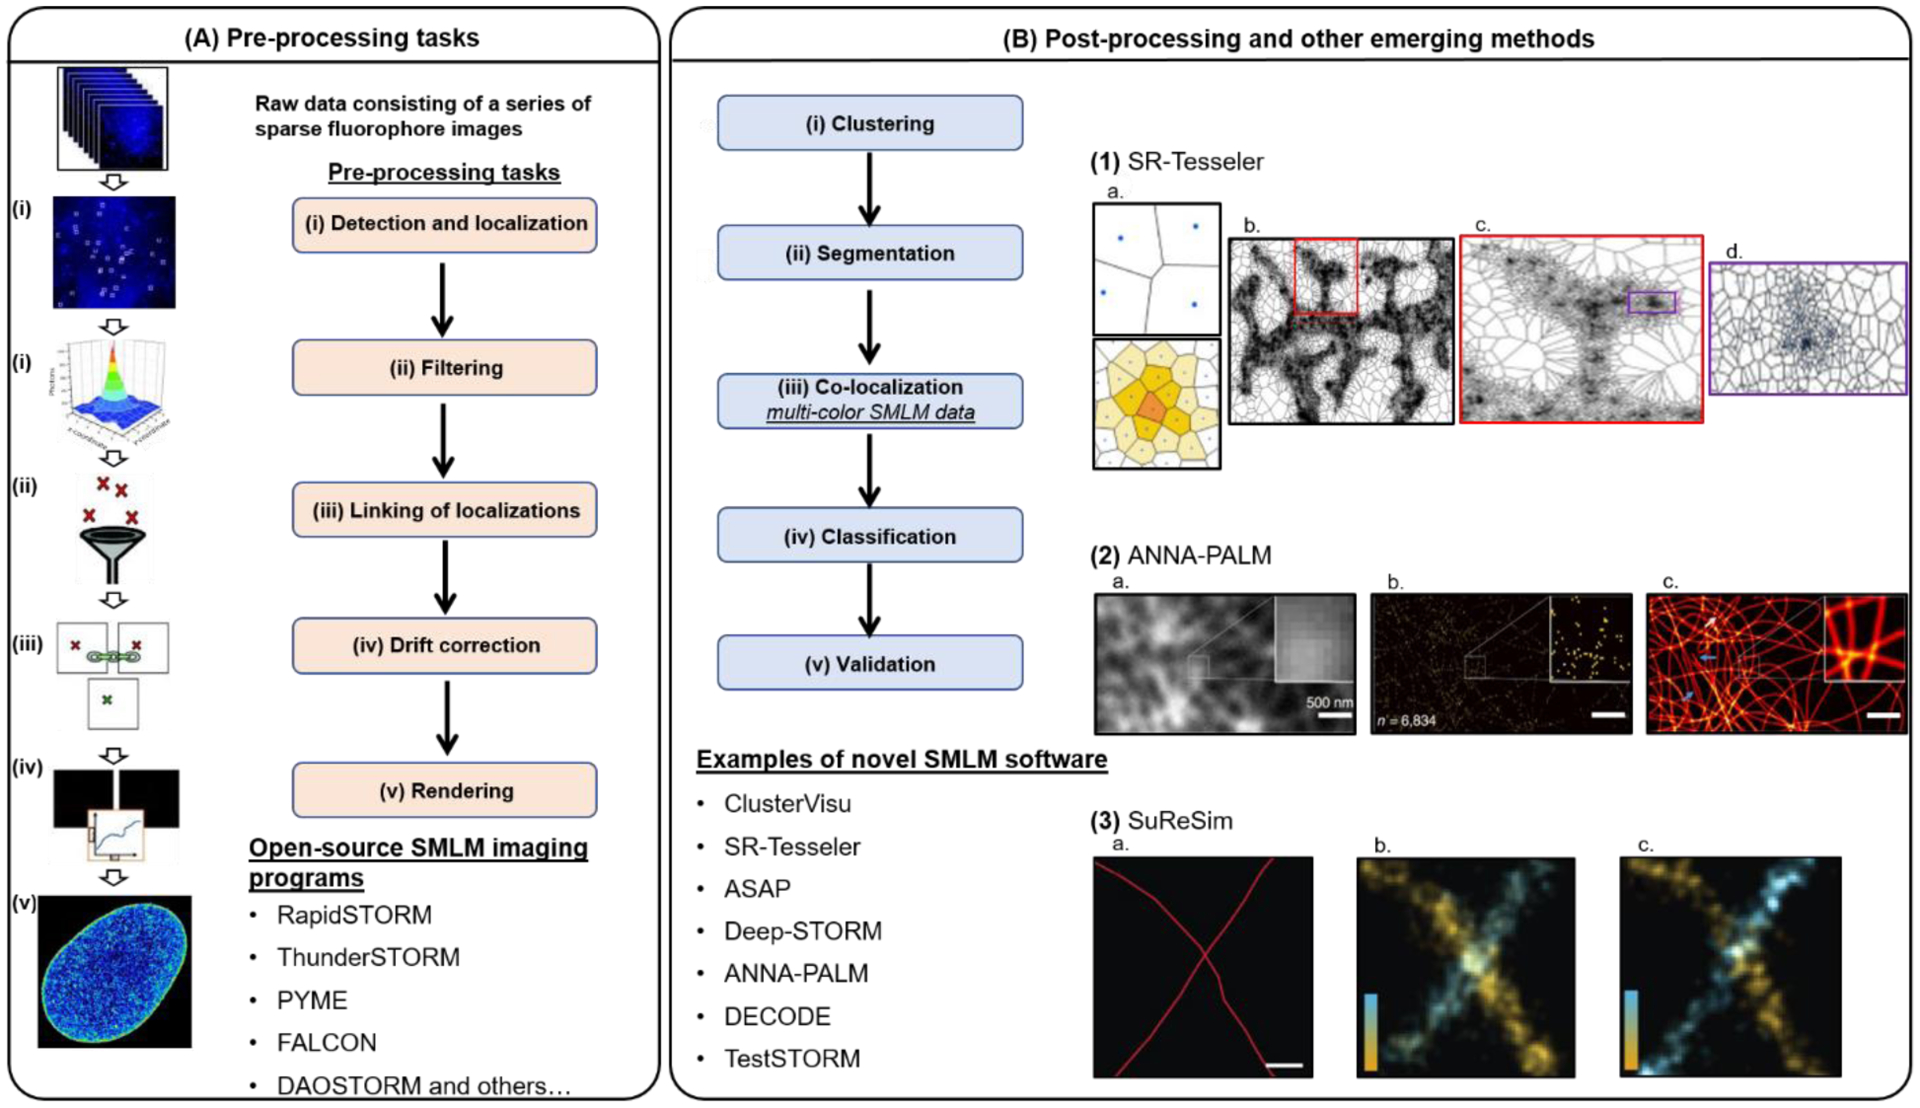
(A) The pre-processing tasks of SMLM data consist of: (i) peak detection and localization, (ii) linking of localizations, (iii) filtering, (iv) drift correction, and (v) rendering. Currently, there are more than 25 open-source software packages that can perform all or some steps of these tasks. Figure was adapted from (Brede and Lakadamyali, 2012) (B) Post-processing of SMLM images include: (i) clustering, (ii) segmentation, (iii) co-localization, (iv) classification, and (v) validation. (1) SR-Tesseler, developed by (Levet et al., 2015), segments SMLM images consisting of a wide-range of shapes and sizes using Voronoi Tessellation (1a), such as entire neuronal processes (1b, c) or nano-clusters (1d). (2) An up-and-coming category of SMLM analysis platforms are those that apply machine- and deep-learning algorithms. For example: ANNA-PALM, developed by (Ouyang et al., 2018), reconstructs super-resolution images (2c) from sparse, rapidly acquired SMLM data (2a,b). (3) Simulation of realistic SMLM data can be used to validate and compare the performance of available SMLM analysis platforms. For example, SuReSim, developed by (Venkataramani et al., 2016), is a software that can simulate biological structures under different experimental conditions; 3a shows the ground truth model, 3b shows the simulated image, and 3c shows the real-experimental data for a pair of crossed-microtubules labeled with antibodies.
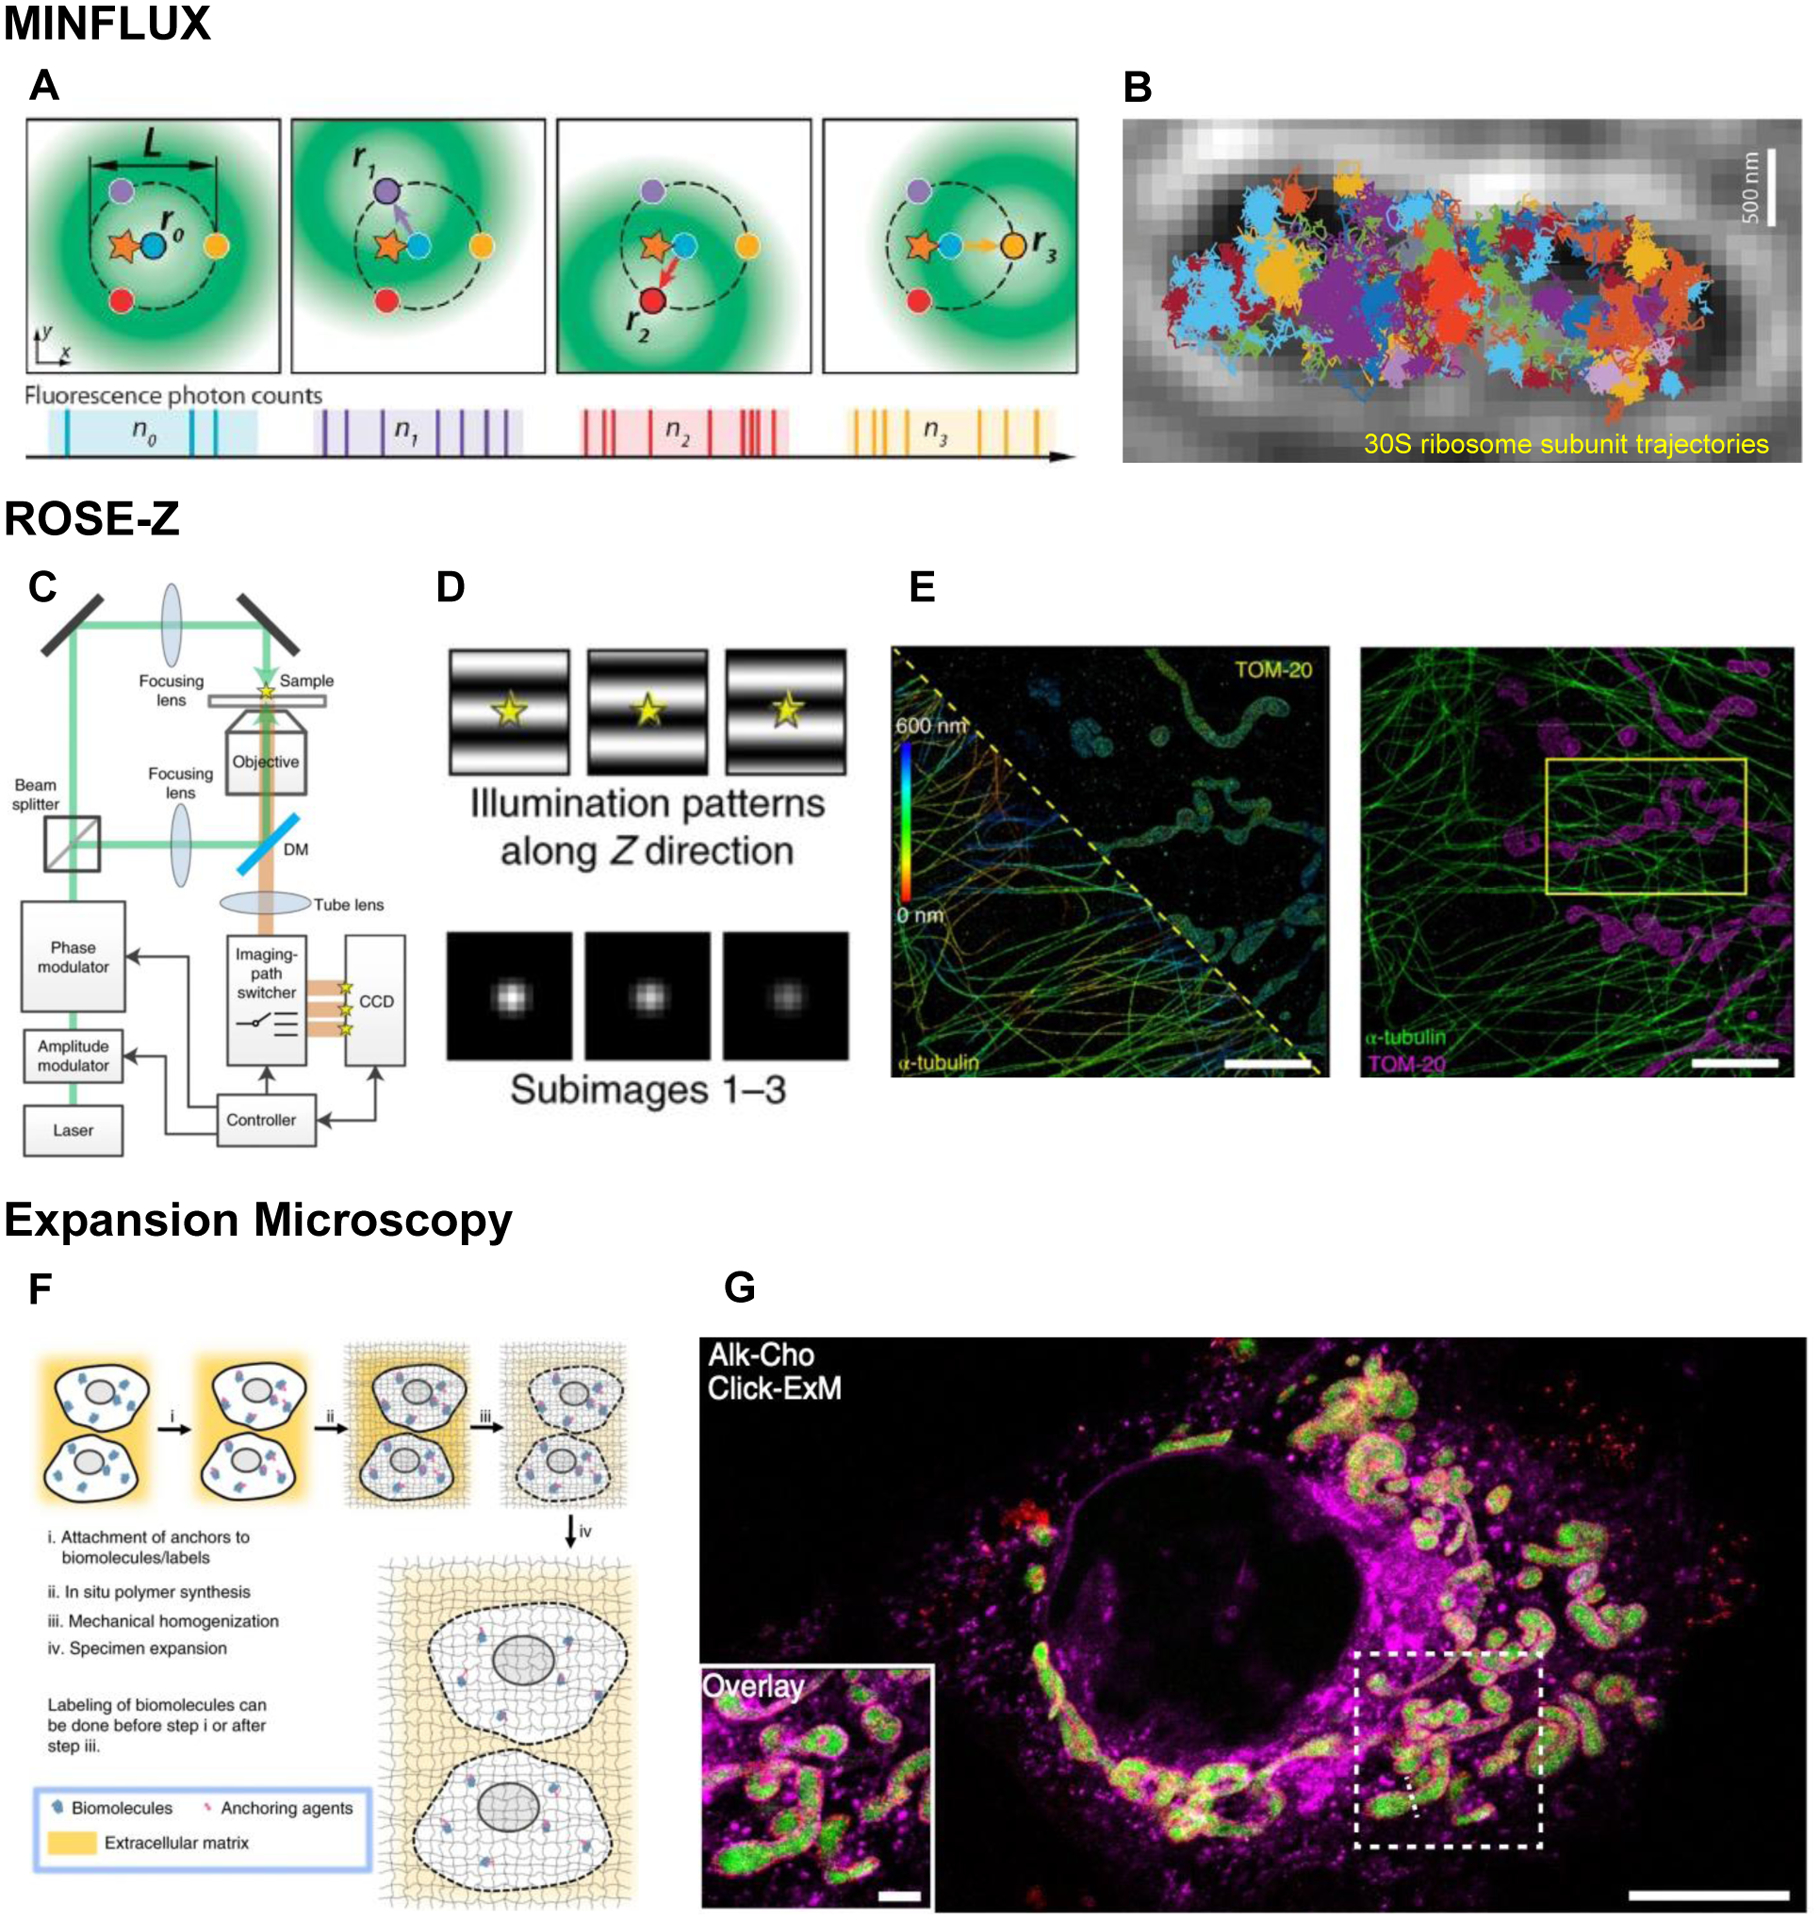
(A) Graphic representation of a fluorescent molecule (star) excited by a moving, donut-shaped excitation beam (green) at 4 different positions (r0, r1, r2, r3) based on the donut minimum in MINFLUX (Balzarotti et al., 2017). Each position is color-coded, and the corresponding photon counts are shown below each panel. (B) Color-coded trajectories of 30S ribosome subunit fused to mEos2 rapidly moving in a E.coli cell (transmission micrograph), captured by MINFLUX at 125 μs temporal resolution and 48 nm localization precision, by detecting on average 9 photons per localization (Balzarotti et al., 2017). Scale bar, 500 nm. (C) Working principle of ROSE-Z. The excitation laser was phase- and amplitude-modulated, split into two paths and interfered at the sample to create an interference fringe pattern. The intensity and phase of the interference fringes are modulated to switch among three different illumination patterns during imaging. In the imaging path, the fluorescence signal is recorded at different areas of the charge-coupled device (CCD) and synchronized with the illumination pattern, resulting in three subimages within a single exposure. DM, dichroic mirror. From (Gu et al., 2021). (D) Illumination patterns along Z direction and corresponding sub-images. (E) ROSE-Z imaging of Tom20 labeled mitochondria and α-tubulin labeled microtubules in a Cos7 cell. Scale bars, 5 μm. (F) General workflow for expansion microscopy. Adapted from (Wassie et al., 2019). (G) Click-ExM image showing mitochondria in a Cos-7 cell labeled with anti-Tom20, Mito-GFP and Alkyne-Choline to label choline-containing lipids. Scale bars, 10 μm in B, 2 μm in inset of B. Adapted from (Sun et al., 2021).
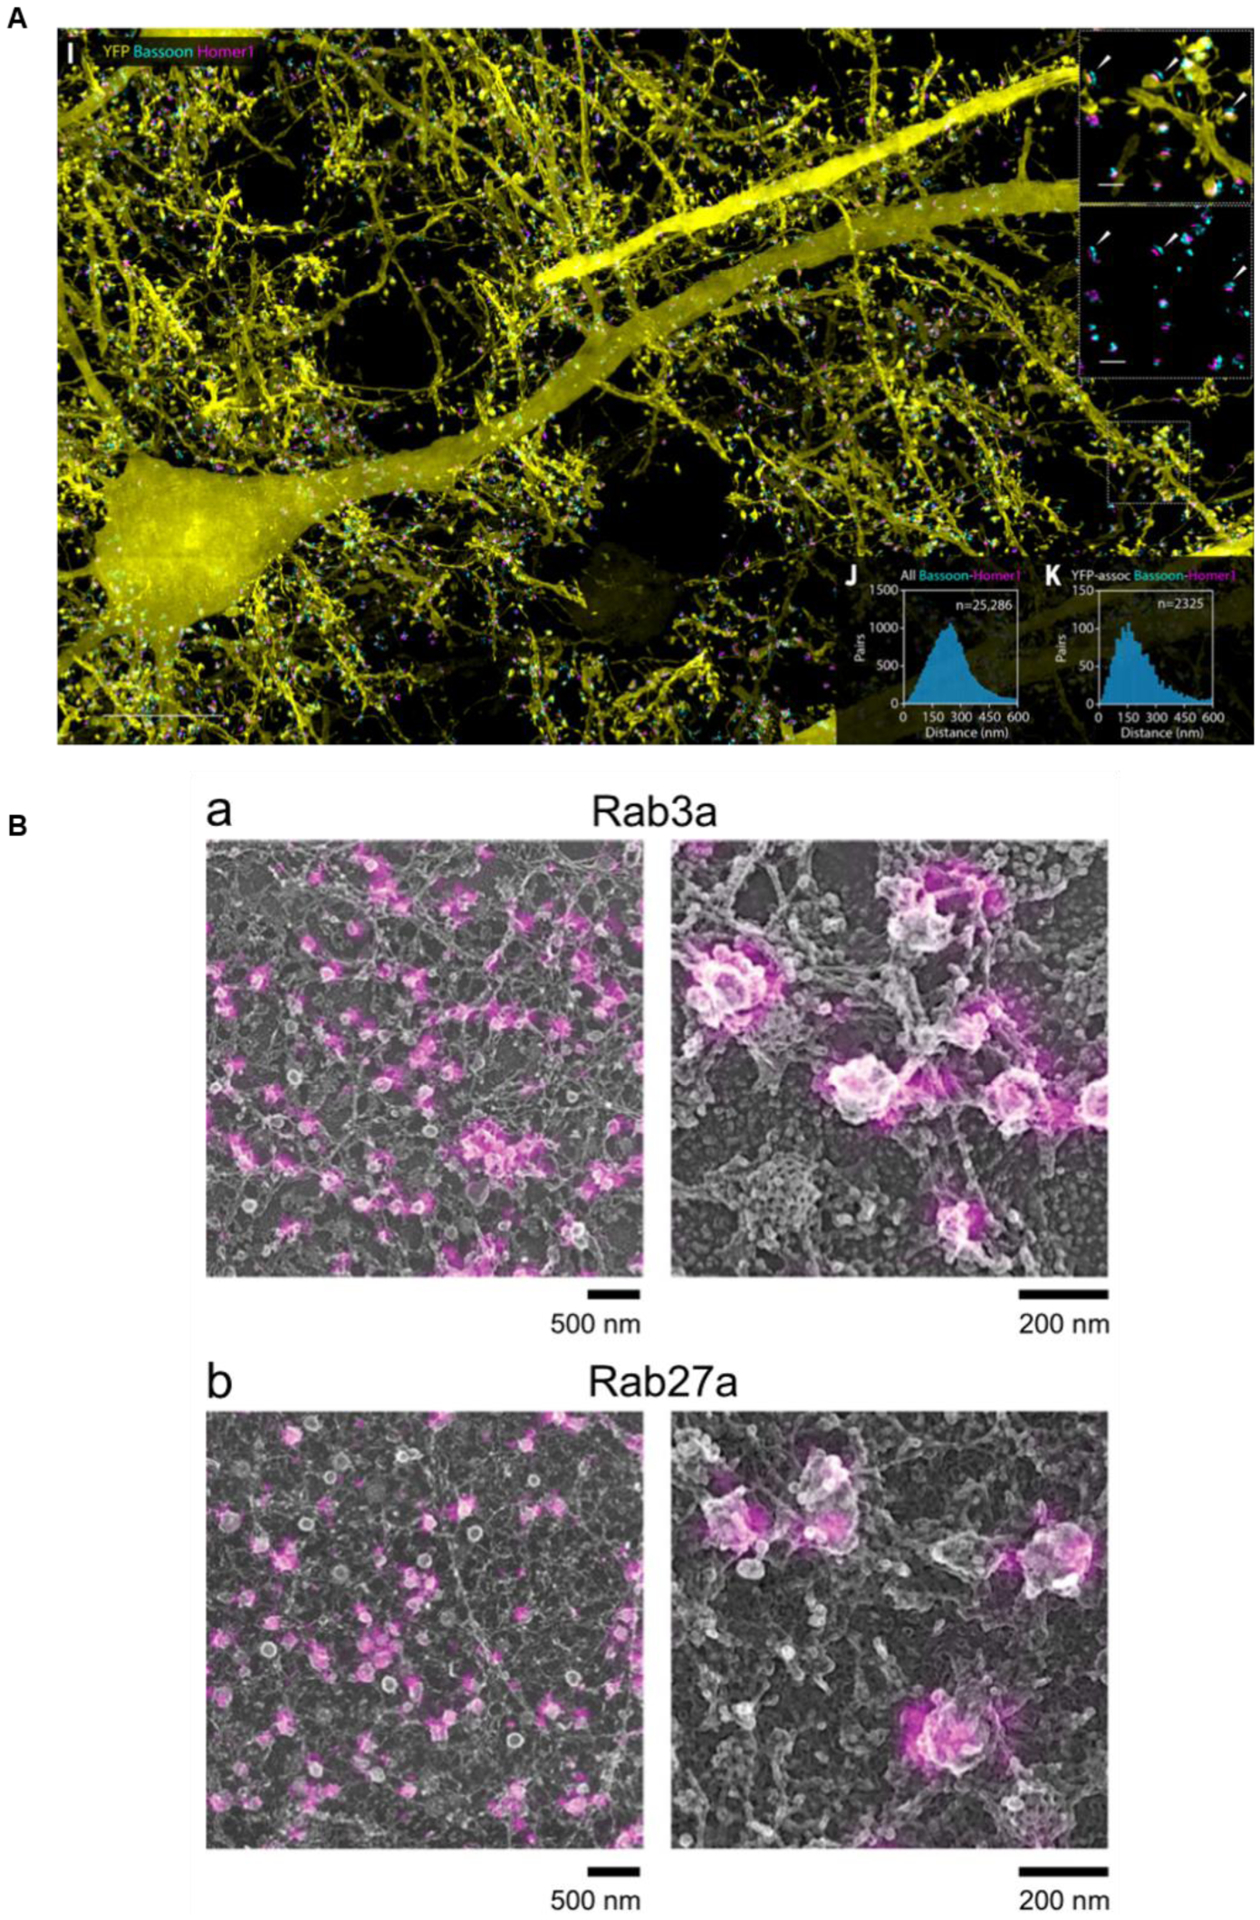
(A) Combined expansion and lattice light sheet microscopy showing individual neurons marked with YFP, as well as two individual synaptic proteins, Bassoon and Homer1, in a mouse cortical brain slice. Adapted from (Gao et al., 2019). (B) Correlative dSTORM and platinum-replica EM of dense core vesicle proteins Rab3a and Rab27a. Adapted from (Prasai et al., 2021)
References
-
- Aquino D, Schonle A, Geisler C, Middendorff CV, Wurm CA, Okamura Y, Lang T, Hell SW, and Egner A (2011). Two-color nanoscopy of three-dimensional volumes by 4Pi detection of stochastically switched fluorophores. Nat Methods 8, 353–359. - PubMed
Publication types
MeSH terms
Grants and funding
LinkOut - more resources
Full Text Sources
Other Literature Sources
