. 2022 Feb 8;17(2):259-275.
doi: 10.1016/j.stemcr.2021.12.010. Epub 2022 Jan 20.

Restoration of hippocampal neural precursor function by ablation of senescent cells in the aging stem cell niche

Affiliations

Restoration of hippocampal neural precursor function by ablation of senescent cells in the aging stem cell niche

Michael P Fatt et al. Stem Cell Reports. .

Abstract

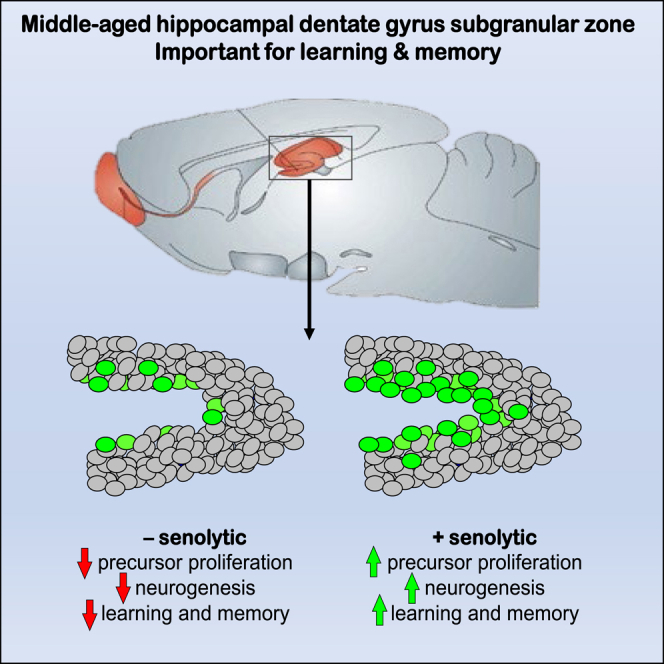
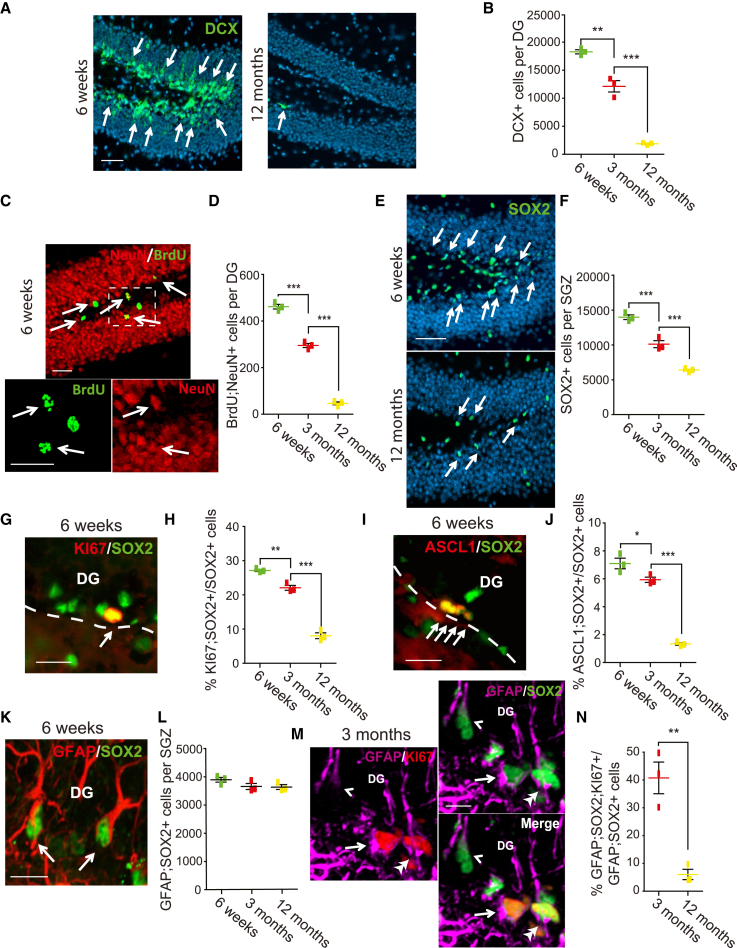
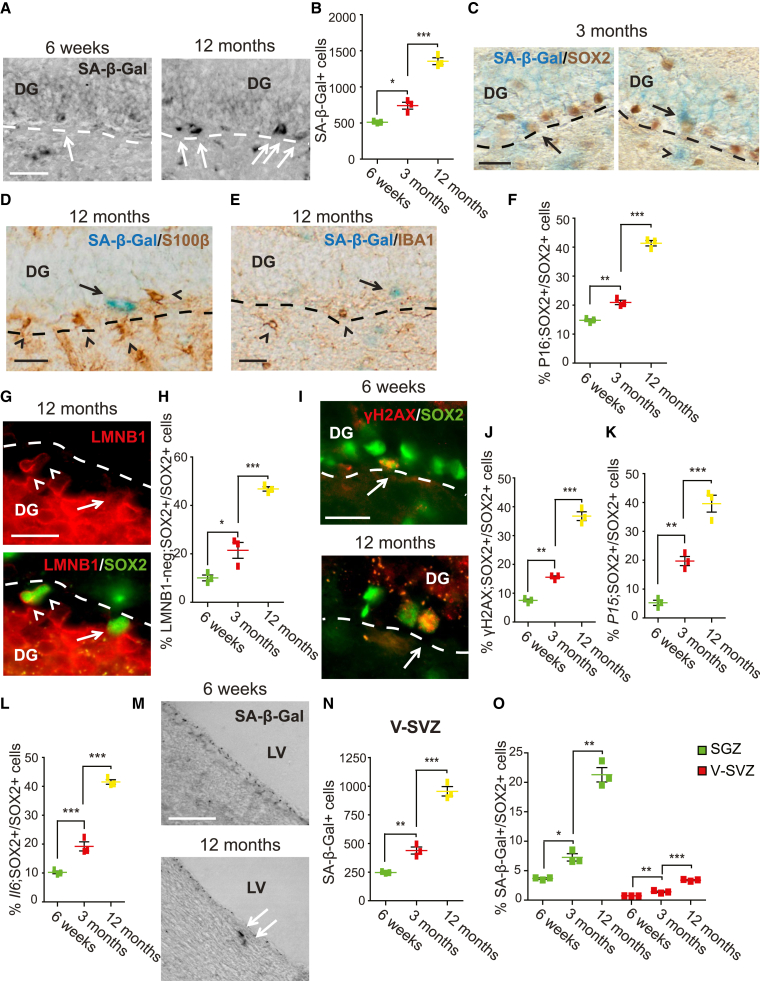
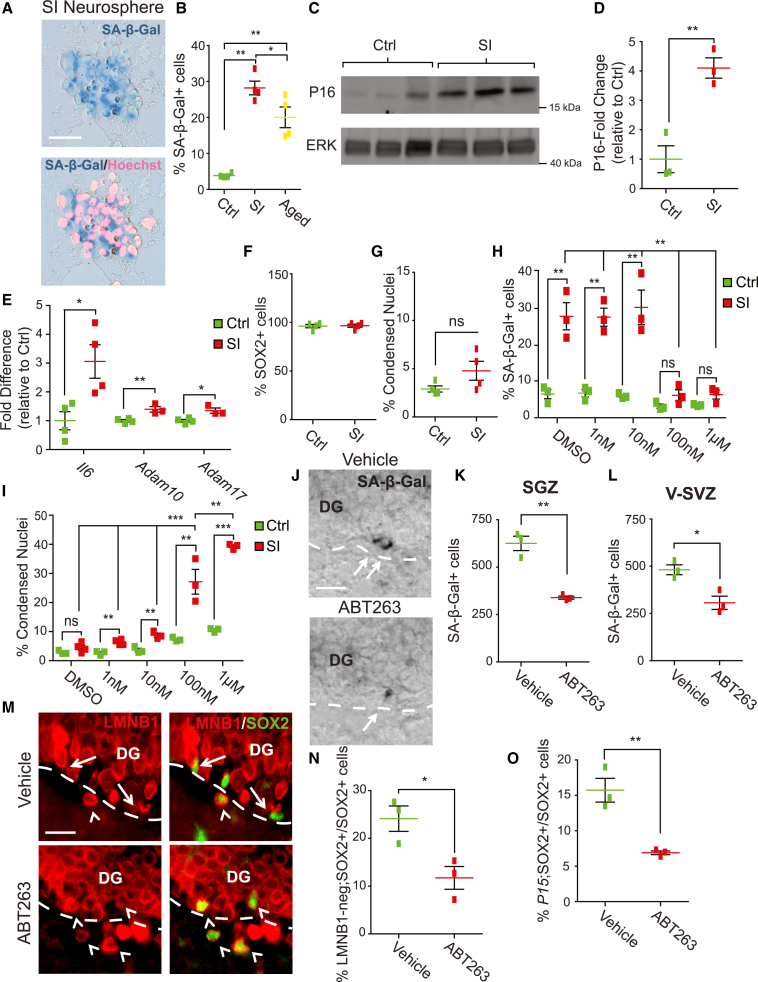
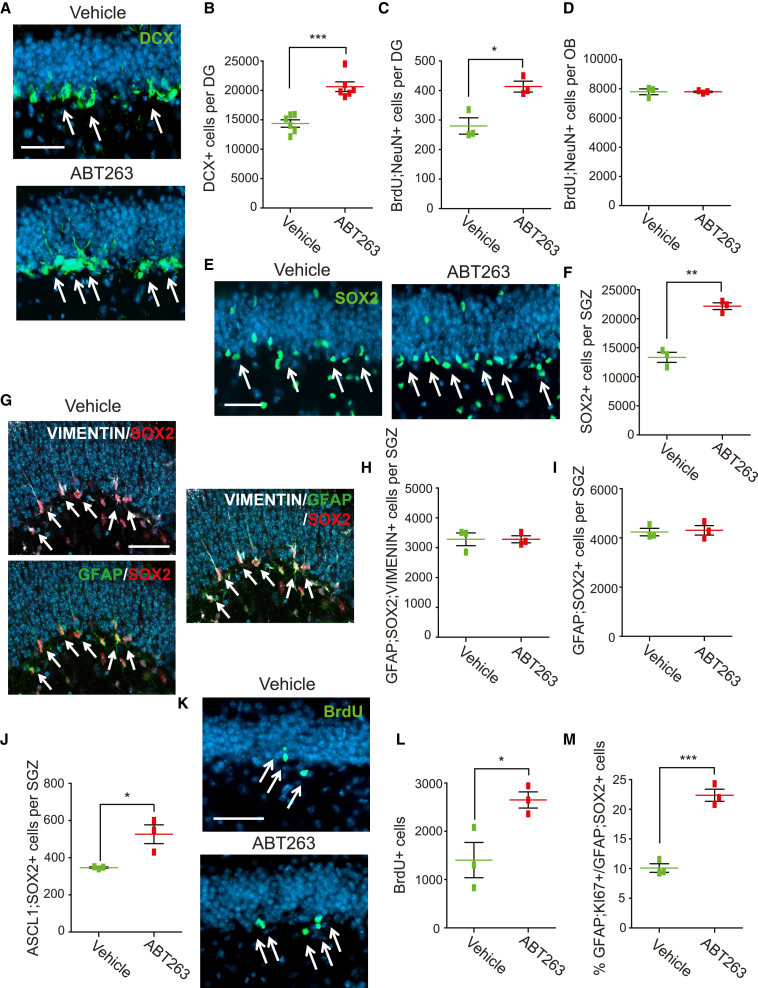
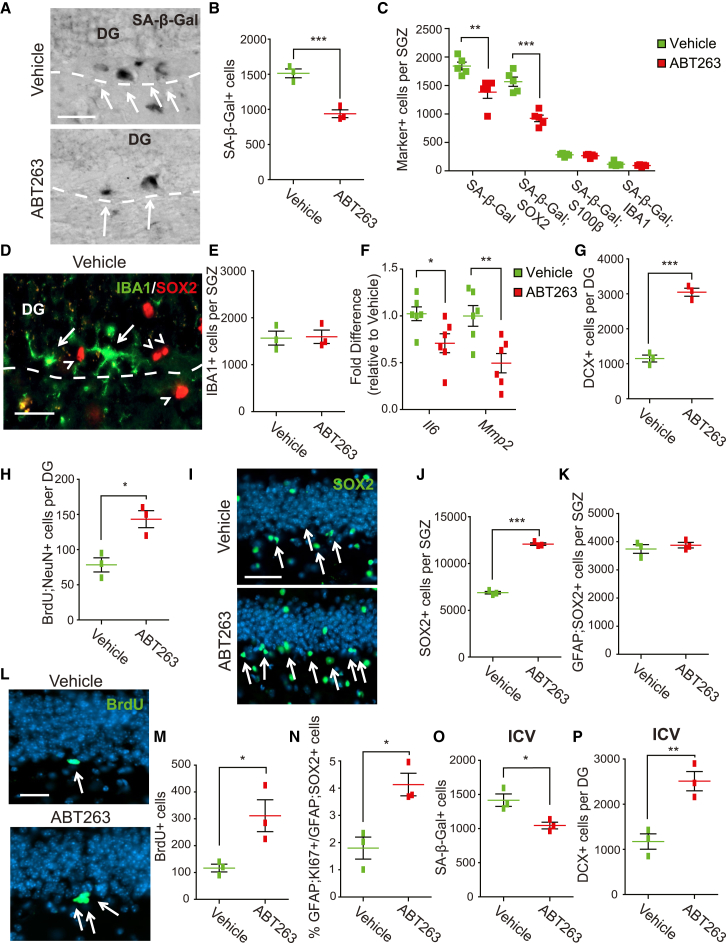
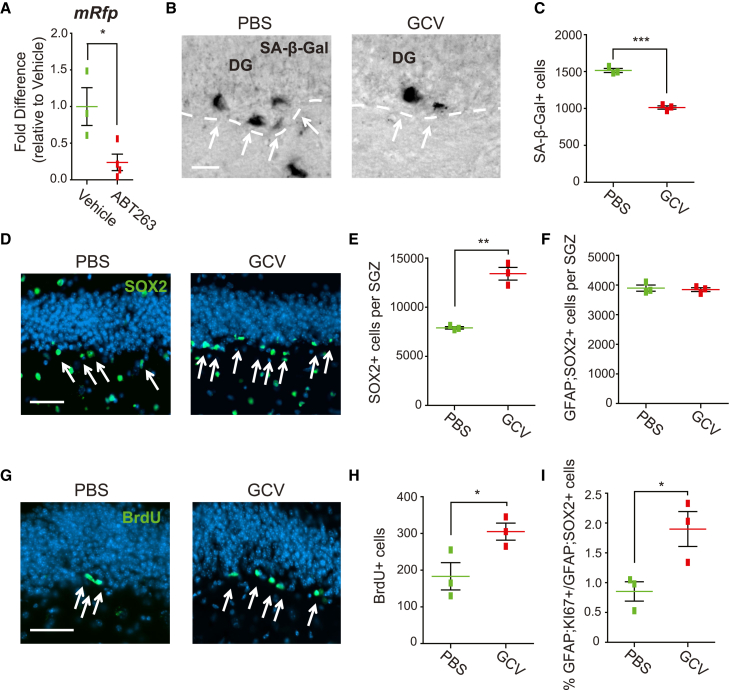
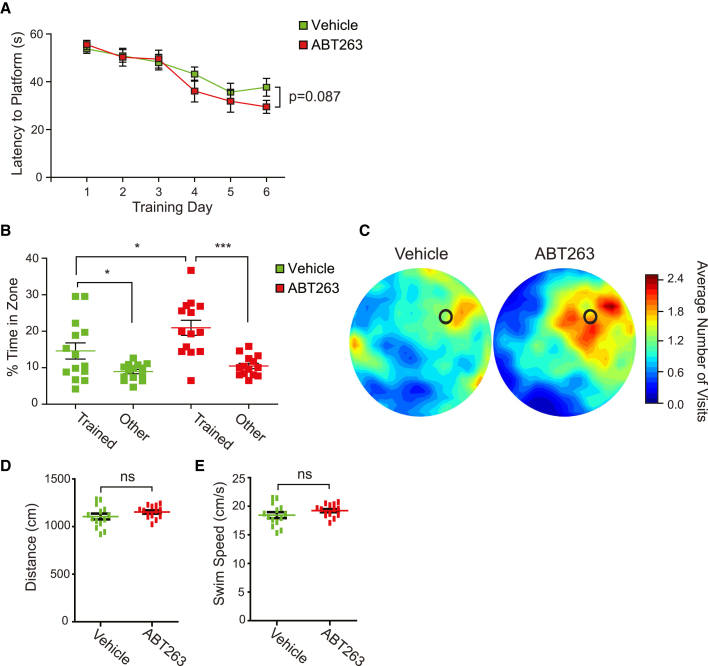
Senescent cells are responsible, in part, for tissue decline during aging. Here, we focused on CNS neural precursor cells (NPCs) to ask if this is because senescent cells in stem cell niches impair precursor-mediated tissue maintenance. We demonstrate an aging-dependent accumulation of senescent cells, largely senescent NPCs, within the hippocampal stem cell niche coincident with declining adult neurogenesis. Pharmacological ablation of senescent cells via acute systemic administration of the senolytic drug ABT-263 (Navitoclax) caused a rapid increase in NPC proliferation and neurogenesis. Genetic ablation of senescent cells similarly activated hippocampal NPCs. This acute burst of neurogenesis had long-term effects in middle-aged mice. One month post-ABT-263, adult-born hippocampal neuron numbers increased and hippocampus-dependent spatial memory was enhanced. These data support a model where senescent niche cells negatively influence neighboring non-senescent NPCs during aging, and ablation of these senescent cells partially restores neurogenesis and hippocampus-dependent cognition.

Keywords: ABT-263; aging; hippcampus; neural stem cells; neurogenesis; senescence; senescence-associated secretory phenotype; senolytic; spatial memory.


Figures

None
Graphical abstract
Figure 1
Figure 1
Hippocampal neurogenesis and precursor number decline during aging Also see Figure S1. Coronal DG sections from 6 week, 3 month, and 12 month old mice were analyzed by immunostaining. (A and B) Sections were immunostained for DCX (A, green, arrows), and total DG DCX-positive cells were quantified (B). (C) DG image from a BrdU-injected 6 week mouse analyzed 1 month later, immunostained for BrdU (green) and NeuN (red). White hatched box is shown at higher magnification at the bottom. Arrows denote double-positive cells. (D) Quantification of sections as in (C) for total DG BrdU-positive, NeuN-positive neurons. (E and F) Sections were immunostained for SOX2 (E, green, arrows), and total SGZ SOX2-positive cells were quantified (F). (G and H) DG sections from 6 week (G) and older mice were immunostained for SOX2 (G, green) and KI67 (G, red; arrow denotes double-labeled cell), and the percentage of SOX2-positive SGZ cells that were also KI67 positive was quantified (H). Dashed line indicates the SGZ/hilus border. (I and J) DG sections of 6 weeks (I) and older mice were immunostained for SOX2 (I, green) and ASCL1 (I, red; arrows denote double-positive cells), and the percentage of SOX2-positive SGZ cells that were also ASCL1 positive was quantified (J). Dashed line indicates the SGZ/hilus border. (K and L) DG sections of 6 week (K) and older mice were immunostained for SOX2 (K, green) and GFAP (K, red; arrows denote double-positive cells), and total SGZ GFAP-positive, SOX2-positive cells were quantified (L). (M and N) Six week (M) and 12-month DG sections were immunostained for GFAP (M, magenta), SOX2 (M, green), and KI67 (M, red; the arrow indicates a triple-positive cell, the arrowhead a SOX2-positive, GFAP-positive cell, and the double arrowhead a SOX2-positive, KI67-positive, GFAP-negative cell), and the percentage of GFAP-positive, SOX2-positive SGZ cells that were also KI67 positive was determined (N). In all cases, error bars indicate standard error of the mean (SEM), n = 3 mice/time point, and p < 0.05, ∗∗p < 0.01, ∗∗∗p < 0.001. Sections in (A and E) were counterstained for Hoechst 33258 (blue). Scale bars: 50 μm (A and E), 30 μm (C), 20 μm (G and I), and 10 μm (K and M).
Figure 2
Figure 2
Senescent NPCs accumulate in the SGZ with age Also see Figure S1. Coronal DG and V-SVZ sections from 6 week, 3 month, and 12 month old mice were analyzed histologically. (A and B) DG sections were stained for SA-β-Gal (A, black; arrows denote positive cells in the bright-field images), and total SGZ SA-β-Gal-positive cells were quantified (B). Dashed lines indicate the hilus/SGZ border. (C–E) Images of the 3 (C) or 12 month (D and E) DG stained for SA-β-Gal (blue) and immunostained for SOX2 (C, brown), S100β (D, brown), or IBA1 (E, brown). In (C) arrows denote double-positive cells, and the arrowhead denotes an SA-β-Gal-only cell. In (D and E) arrows denote cells positive for only SA-β-Gal and the arrowheads those positive for only S100β (D) or IBA1 (E). Dashed lines denote the hilus/SGZ border. (F) Quantification of DG sections for the percentage of SOX2-immunoreactive SGZ cells that also immunostained positive for P16INK4A (see Figure S1C). (G and H) DG sections from 12 month (G) or younger mice were immunostained for SOX2 (G, green) and LAMIN B1 (LMNB1) (G, red; arrows indicate a SOX2-positive, LMNB1-negative cell, and arrowheads double-positive cells), and the percentage of SOX2-positive SGZ cells negative for LMNB1 was determined (H). Dashed lines indicate the SGZ/hilus border. (I and J) DG sections were immunostained for SOX2 (I, green) and γH2AX (I, red; arrows denote double-positive cells), and the percentage of SOX2-positive SGZ cells positive for γH2AX was determined (J). Dashed lines indicate the SGZ/hilus border. (K and L) Quantification of sections analyzed by immunostaining for SOX2 and FISH for P15ink4b (K) or Il6 (L) mRNAs. Shown are percentages of SOX2-positive SGZ NPCs positive for the relevant mRNA (see Figures 1D and 1E). (M and N) V-SVZ sections were stained for SA-β-Gal (M, black; arrows denote positive cells), and total V-SVZ SA-β-Gal-positive cells were quantified (N). LV, lateral ventricle. (O) Quantification of total SA-β-Gal-positive SGZ or V-SVZ cells expressed as a percentage of total SOX2-positive cells at the same time point. In all cases, error bars indicate SEM, n = 3 mice/time point, and p < 0.05, ∗∗p < 0.01, ∗∗∗p < 0.001. Scale bars: 50 μm (A and M), 25 μm (C–E), 20 μm (G and I).
Figure 3
Figure 3
Administration of ABT-263 reduces senescent cells in the DG of young adult mice (A–G) Primary neurospheres cultured from the 6 week V-SVZ were passaged, 2 days later treated for 72 h with 25 nM camptothecin (senescence-induced or SI) or vehicle (Ctrl), and characterized 2 days later.(A and B) Cultures were stained for SA-β-Gal (A, blue) and counterstained with Hoechst 33258 (pink), and the percentage of SA-β-Gal-positive cells was determined (B). For comparison, control neurospheres from the 20 month old V-SVZ were also analyzed (B).(C and D) Western blots of SI or Ctrl neurospheres probed for P16INK4A (C, top) and reprobed for total ERK (bottom; molecular weight markers are shown to the right). P16INK4A levels were normalized to the ERK loading control and expressed as a fold change in SI versus Ctrl cultures (D).(E) qPCR of RNA isolated from SI or Ctrl neurospheres, analyzed for Il6, Adam10, or Adam17 mRNAs. Values were normalized to Gapdh mRNA levels in the same samples and expressed as a fold change in SI versus Ctrl cultures.(F and G) Neurospheres were immunostained, counterstained with Hoechst 33258, and quantified for the percentage of SOX2-positive cells (F) and cells with condensed apoptotic nuclei (G). (H and I) Cultures as in (A) were treated with varying ABT-263 concentrations for 24 h, stained, and analyzed for the percentages of cells that were SA-β-Gal-positive (H) or had condensed, apoptotic nuclei (I). (J–O) Three month old mice were injected with ABT-263 or vehicle, and DG (J, K, M–O) or V-SVZ (L) sections were analyzed 5 days later.(J and K) DG sections were stained for SA-β-Gal (J, black; arrows denote positive cells), and total SGZ SA-β-Gal-positive cells were quantified (K). Dashed lines indicate the hilus/SGZ border. (L) Quantification of stained V-SVZ sections for total SA-β-Gal-positive cells.(M and N) DG sections were immunostained for SOX2 (M, green) and LAMIN B1 (LMNB1) (red; arrows indicate SOX2-positive, LMNB1-negative cells, and arrowheads double-positive cells), and the percentage of SOX2-positive SGZ cells negative for LMNB1 was determined (N). Dashed lines indicate the SGZ/hilus border.(O) Sections were analyzed by immunostaining for SOX2 and FISH for P15ink4b mRNA and quantified for the percentage of SOX2-positive SGZ cells that were P15ink4b positive. In all cases, error bars indicate SEM. ns, not significant; p < 0.05, ∗∗p < 0.01, ∗∗∗p < 0.001. In (B and D–I), n ≥ 3 independent cultures per condition. In (K, L, N, and O), n = 3 mice/condition. Scale bars: 20 μm.
Figure 4
Figure 4
ABT-263 administration enhances hippocampal neurogenesis in adult mice Also see Figure S2. Three month old mice were injected with ABT-263 or vehicle and sections were analyzed 5 days later. In (D and L) mice were also injected with BrdU 4 days post-ABT-263 and analyzed 24 h (L) or 30 days (D) later. (A and B) Sections were immunostained for DCX (A, green, arrows), and total positive DG cells were quantified (B). (C and D) Quantification of DG (C) or olfactory bulb (D) sections of ABT-263 or vehicle-treated mice injected with BrdU and analyzed 30 days later. Shown are total BrdU-positive, NeuN-positive cells. (E and F) DG sections were immunostained for SOX2 (E, green, arrows), and total SGZ SOX2-positive cells were quantified (F). (G and H) DG sections were immunostained for SOX2 (G, red), GFAP (G, green), and VIMENTIN (G, white), and total triple-positive SGZ cells (arrows) were quantified (H). (I and J) Immunostained DG sections were quantified for total SOX2-positive SGZ cells that were also positive for GFAP (I) or ASCL1 (J). (K and L) DG sections from mice injected with ABT-263/vehicle and then BrdU were immunostained 24 h post-BrdU to identify (K, green, arrows) and quantify (L) total BrdU-positive SGZ cells. (M) Immunostained DG sections were analyzed for GFAP-positive, KI67-positive SGZ cells, and numbers were expressed as a percentage of total GFAP-positive, SOX2-positive SGZ cells as determined in (I). In all cases, error bars indicate SEM. p < 0.05, ∗∗p < 0.01, ∗∗∗p < 0.001. n = 3 mice/condition except in (B), where n = 6 mice/condition. In (A, E, G, and K) sections were counterstained with Hoechst 33258 (blue). Scale bars: 50 μm.
Figure 5
Figure 5
ABT-263 administration enhances neurogenesis and NPCs in 12 month old mice (A–N) 12 month old mice were injected with ABT-263 or vehicle and the DG was analyzed 5 days later. In (H and M) mice were also injected with BrdU 4 days post-ABT-263 and analyzed 24 h (M) or 30 days (H) later. (A and B) DG sections were stained for SA-β-Gal (A, black, arrows), and total SA-β-Gal-positive SGZ cells were quantified (B). Dashed lines indicate the SGZ/hilus border. (C) DG sections were stained for SA-β-Gal and immunostained for SOX2, S100β, or IBA1 (as in Figures 2C–2E), and total SA-β-Gal-positive SGZ cells co-expressing each of these markers were quantified. Also quantified were total SA-β-Gal-positive cells. (D and E) DG sections were immunostained for SOX2 (D, red, arrowheads) and IBA1 (D, green, arrows), and total IBA1-positive SGZ cells were quantified (E). The dashed line indicates the hilus/SGZ border. (F) qPCR for Il6 and Mmp2 mRNAs in total DG mRNA. Values were normalized to Gapdh mRNA levels in the same samples and expressed as a fold change in ABT-263 versus vehicle-treated samples. (G) Quantification of immunostained sections for total DCX-positive cells in the DG. (H) Quantification of total BrdU-positive, NeuN-positive cells in the DG of ABT-263 or vehicle-treated mice injected with BrdU and analyzed 30 days later. (I and J) DG sections were immunostained for SOX2 (I, green, arrows), and total SGZ SOX2-positive cells were quantified (J). (K) Quantification of immunostained sections for total GFAP-positive, SOX2-positive SGZ cells. (L and M) DG sections from mice injected with ABT-263/vehicle and then BrdU were immunostained 24 h post-BrdU to identify (L, green, arrows) and quantify (M) total BrdU-positive SGZ cells. (N) Quantification of immunostained DG sections for GFAP-positive, KI67-positive SGZ cells, expressed as a percentage of total GFAP-positive, SOX2-positive SGZ cells as determined in (K). (O and P) 12 month old mice were injected ICV with 50 ng of ABT-263 or vehicle, and coronal DG sections were analyzed 5 days later for total SA-β-Gal-positive SGZ cells (O) or total DCX-positive DG cells (P). In all cases, error bars indicate SEM. p < 0.05, ∗∗p < 0.01, ∗∗∗p < 0.001. n = 3 mice/condition in all cases, except for (C), where n = 5 mice/condition, and (F), where n = 6 mice/condition. Scale bars: 50 μm (A, I), 25 μm (D), 20 μm (L). In (I and L) sections were counterstained with Hoechst 33258 (blue).
Figure 6
Figure 6
Genetic reduction of senescent cells in aged p16-3MR mice enhances hippocampal precursor proliferation and numbers (A) qPCR for mRfp mRNA in total mRNA from the DG of 22 month old P16-3MR mice 5 days after intraperitoneal (i.p.) injection with ABT-263 or vehicle. Values are normalized to Gapdh mRNA in the same samples and expressed as a fold change relative to vehicle-injected mice. (B–I) Twelve month old P16-3MR mice were infused ICV for 7 days with PBS or ganciclovir (GCV), and DG sections were analyzed. In (H) mice were also injected with BrdU after 6 days of infusion. (B and C) DG sections were stained for SA-β-Gal (B, black, arrows), and total SA-β-Gal-positive SGZ cells were quantified (C). Dashed lines indicate the SGZ/hilus border. (D and E) DG sections were immunostained for SOX2 (D, green, arrows), and total positive SGZ cells were quantified (E). (F) Quantification of immunostained DG sections for total GFAP-positive, SOX2-positive SGZ cells. (G and H) DG sections from mice injected with BrdU during GCV or PBS infusion were immunostained 24 h post-BrdU to identify (G, green, arrows) and quantify (H) total BrdU-positive SGZ cells. (I) Quantification of immunostained DG sections for GFAP-positive, KI67-positive SGZ cells, expressed as a percentage of total GFAP-positive, SOX2-positive SGZ cells as determined in (F). In all cases, error bars indicate SEM and n ≥ 3 mice/condition. In (D and G) sections were counterstained with Hoechst 33258 (blue). Scale bars: 20 μm (B) and 50 μm (D and G). p < 0.05, ∗∗p < 0.01, ∗∗∗p < 0.001.
Figure 7
Figure 7
A single injection of ABT-263 enhances spatial memory in 12 month old mice Twelve month old mice were treated with ABT-263 or vehicle and 30 days later were trained for 6 days on the hidden platform version of the Morris water maze. (A) Average time to find the hidden platform on each day of training. (B and C) Twenty-four hours following training, the platform was removed and a probe test performed to assess average amounts of time spent in the trained zone versus the other three equal-sized zones (B). Also shown are density plots of grouped data (C) showing where mice concentrated their searches, with the color scale representing average number of visits per mouse per 5 × 5 cm area. During training, the platform was located in the top right quadrant (C, black circle). (D and E) Quantification of total distance traveled (D) and average swim speed (E) during the probe test. All results are representative of three independent experiments, and in all cases error bars indicate SEM. ns, not significant, p > 0.05; p < 0.05; ∗∗∗p < 0.001. n = 14 mice/condition.

References

    1. Ahlenius H., Visan V., Kokaia M., Lindvall O., Kokaia Z. Neural stem and progenitor cells retain their potential for proliferation and differentiation into functional neurons despite lower number in aged brain. J. Neurosci. 2009;29:4408–4419. - PMC - PubMed
    1. Baker D.J., Childs B.G., Durik M., Wijers M.E., Sieben C.J., Zhong J., Saltness R.A., Jeganathan K.B., Verzosa G.C., Pezeshki A., et al. Naturally occurring p16(Ink4a)-positive cells shorten healthy lifespan. Nature. 2016;530:184–189. - PMC - PubMed
    1. Beckervordersandforth R., Ebert B., Schäffner I., Moss J., Fiebig C., Shin J., Moore D.L., Ghosh L., Trinchero M.F., Stockburger C., et al. Role of mitochondrial metabolism in the control of early lineage progression and aging phenotypes in adult hippocampal neurogenesis. Neuron. 2017;93:560–573. - PMC - PubMed
    1. Ben Abdallah N.M.B., Slomianka L., Vyssotski A.L., Lipp H.P. Early age-related changes in adult hippocampal neurogenesis in C57 mice. Neurobiol. Aging. 2010;31:151–161. - PubMed
    1. Bussian T.J., Aziz A., Meyer C.F., Swenson B.L., van Deursen J.M., Baker D.J. Clearance of senescent glial cells prevents tau-dependent pathology and cognitive decline. Nature. 2018;562:578–582. - PMC - PubMed

Publication types

LinkOut - more resources