. 2022 Feb 8;17(2):307-320.
doi: 10.1016/j.stemcr.2021.12.011. Epub 2022 Jan 20.

The blood-brain barrier is dysregulated in COVID-19 and serves as a CNS entry route for SARS-CoV-2

Affiliations

The blood-brain barrier is dysregulated in COVID-19 and serves as a CNS entry route for SARS-CoV-2

Susanne Krasemann et al. Stem Cell Reports. .

Abstract

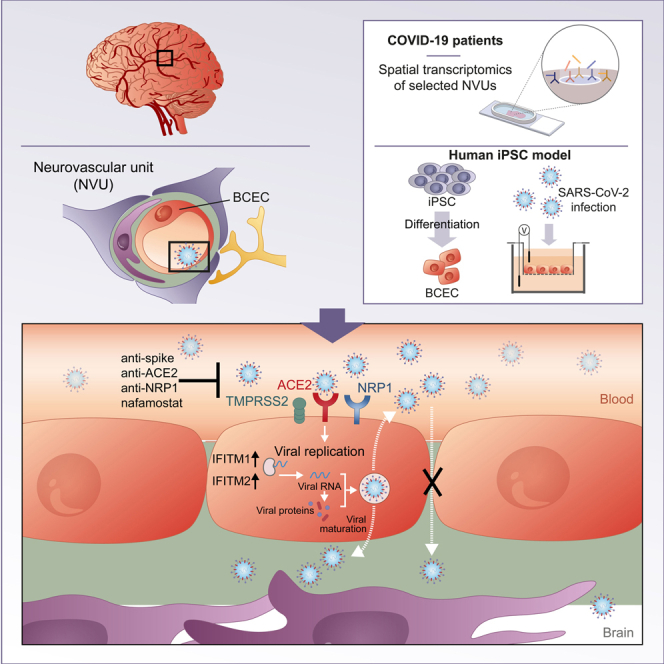
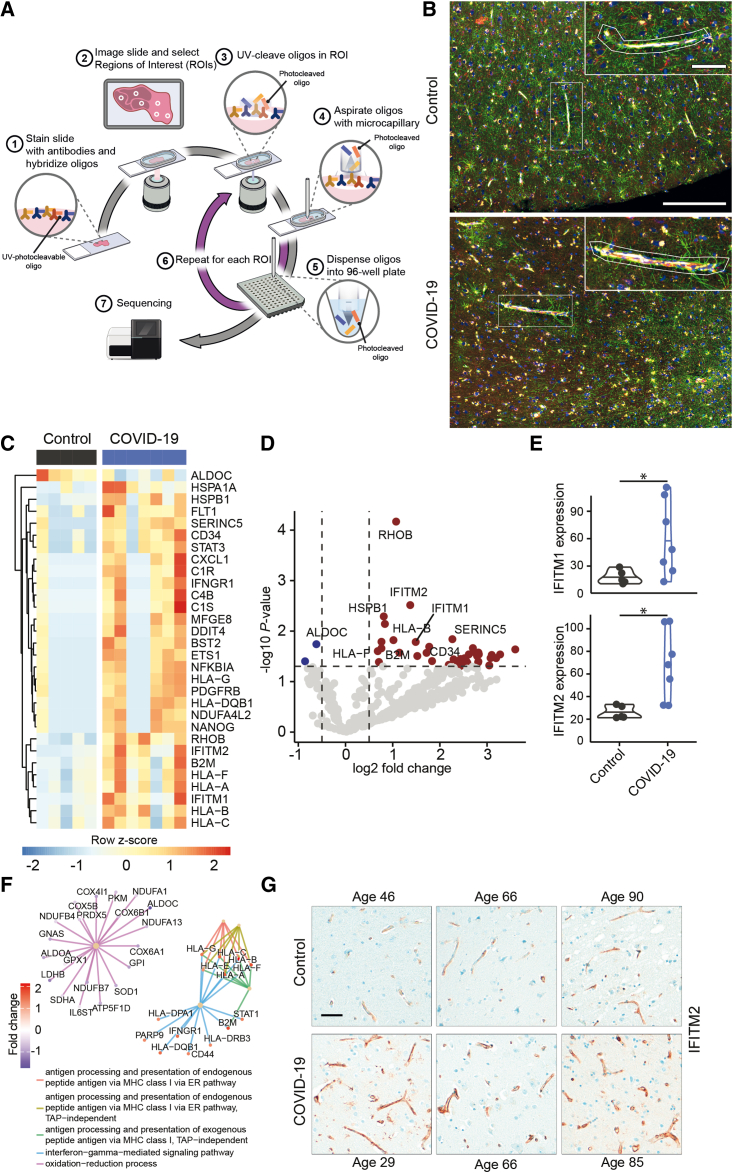
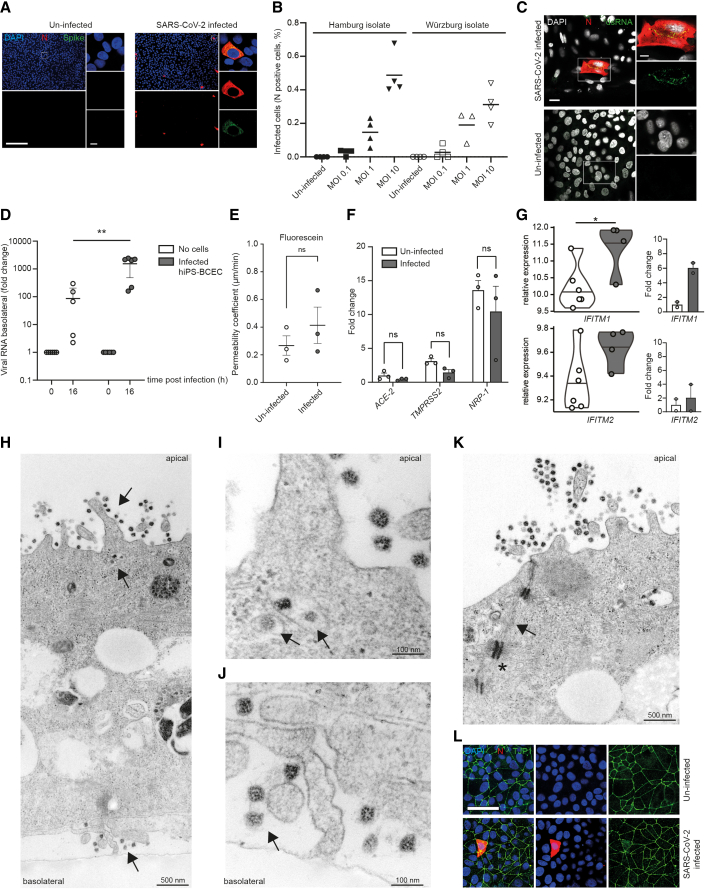
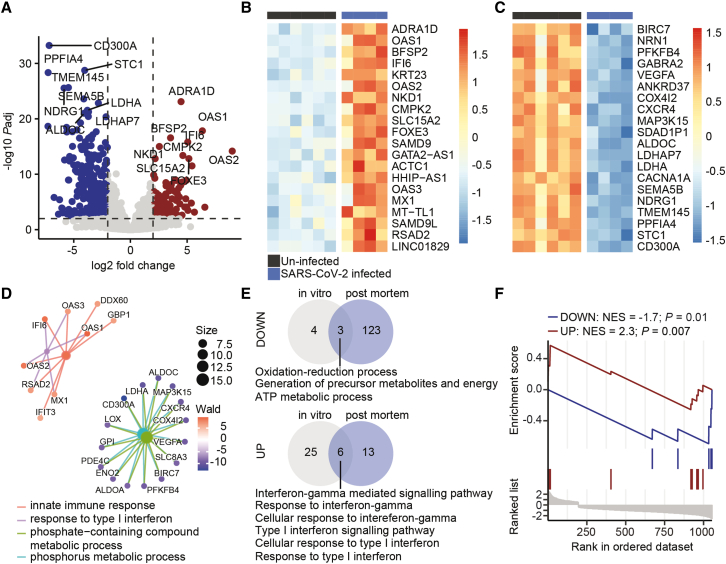
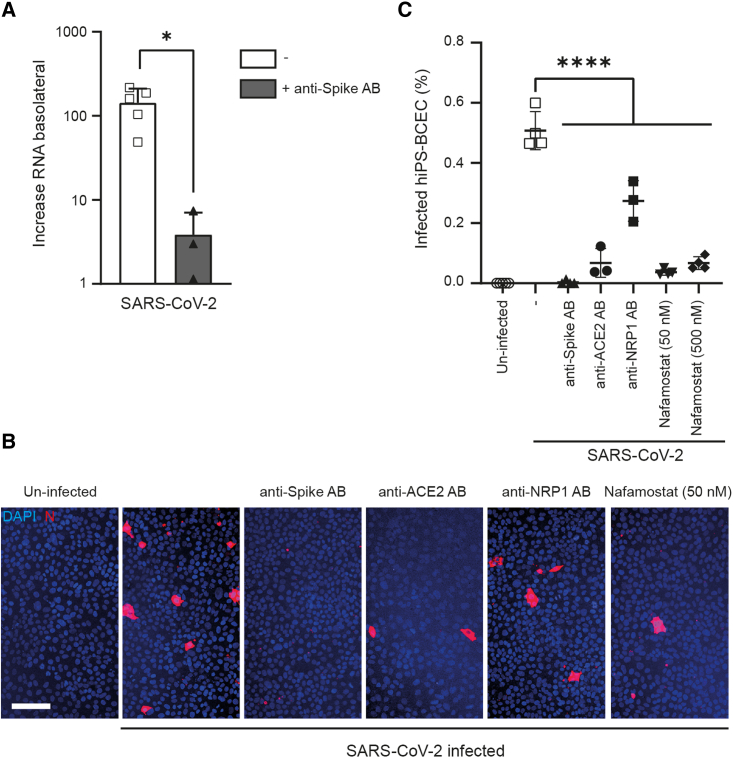
Neurological complications are common in COVID-19. Although SARS-CoV-2 has been detected in patients' brain tissues, its entry routes and resulting consequences are not well understood. Here, we show a pronounced upregulation of interferon signaling pathways of the neurovascular unit in fatal COVID-19. By investigating the susceptibility of human induced pluripotent stem cell (hiPSC)-derived brain capillary endothelial-like cells (BCECs) to SARS-CoV-2 infection, we found that BCECs were infected and recapitulated transcriptional changes detected in vivo. While BCECs were not compromised in their paracellular tightness, we found SARS-CoV-2 in the basolateral compartment in transwell assays after apical infection, suggesting active replication and transcellular transport of virus across the blood-brain barrier (BBB) in vitro. Moreover, entry of SARS-CoV-2 into BCECs could be reduced by anti-spike-, anti-angiotensin-converting enzyme 2 (ACE2)-, and anti-neuropilin-1 (NRP1)-specific antibodies or the transmembrane protease serine subtype 2 (TMPRSS2) inhibitor nafamostat. Together, our data provide strong support for SARS-CoV-2 brain entry across the BBB resulting in increased interferon signaling.

Keywords: COVID-19; SARS-CoV-2; blood-brain barrier; hiPSC; infection model; neurovascular unit.


Figures

None
Graphical abstract
Figure 1
Figure 1
Transcriptional profiling of the neurovascular unit of COVID-19 and control brains (A) Schematic representation of the spatial transcriptomic analysis of the neurovascular unit in human brain tissue with the Nanostring DSP platform. Brain tissue sections were stained for abundant cell populations (here: CD31, CD45, GFAP, and nuclei) and hybridized with a library of photocleavable probes for a specific gene panel. Regions of interest are chosen and illuminated, and the hybridized probes are collected only there. Downstream analyses of the collected probes provide a representative picture of RNA expression of genes of interest in this specific location, here, the neurovascular unit. (B) Representative images of cortical regions of control (top) and COVID-19 brains (bottom), stained for GFAP (green), CD31 (yellow), CD45 (red), and DNA (blue). Two representative ROIs that were used for transcriptional analyses are shown. Scale bar, 250 μm; close up, 75 μm. (C) Heatmap summarizing all differentially regulated genes. Gene-dependent h-clustering was performed. Color shows row Z score. (D) Volcano plot showing differentially up- (red) and downregulated (blue) genes. Top differentially regulated genes are labeled. (E) Normalized expression of IFITM1 (top) and IFITM2 (bottom). Shapiro-Wilk tests followed by Mann-Whitney U tests were performed. p = 0.03 for IFITM1, p = 0.01 for IFITM2. (F) Gene set enrichment analysis of all detected genes. Color shows log2 fold change. (G) Representative images for IFITM2 staining in brain tissue of control and COVID-19 patients. Images of age-matched pairs are displayed, demonstrating expression of IFITM2 in the neurovascular unit and its upregulation in fatal COVID-19. Scale bar, 50 μm.
Figure 2
Figure 2
SARS-CoV-2 infects and replicates in hiPS-BCECs (A) Representative overview images that were used for subsequent quantification and respective close ups of N and spike protein double staining after infection with SARS-CoV-2 for 24 h (MOI 10) are shown. In the overview images, N protein is oversaturated to enable easy counting of infected cells; the close ups display the subcellular localization of N and spike protein in infected cells. Uninfected cells served as control and did not show any staining with SARS-CoV-2-specific antibodies. SARS-CoV-2 N protein (red), SARS-CoV-2 spike protein (green), counterstained by DAPI (blue). Scale bar, 200 μm; close up, 7.5 μm. (B) Infected hiPS-BCECs (MOI 0.1, 1, and 10 each for Hamburg and Würzburg isolates) stained for N protein, indicating a dose-dependent rate of infection; n = 2 independent experiments, three or four technical replicates per condition. (C) Representative immunofluorescence of SARS-CoV-2-infected hiPS-BCECs stained for N protein (red) and double-stranded RNA (dsRNA, green) (MOI 10), counterstained by DAPI (white). Uninfected hiPS-BCECs served as control. Scale bar, 25 μm; close up, 10 μm. (D) In transwell assays, SARS-CoV-2 is applied from the apical side to infect hiPS-BCECs (MOI 10). Mean ± SEM of n = 3 independent experiments, three technical replicates per condition. A significant increase in viral RNA was detected in the basolateral compartment by qRT-PCR. Two-way ANOVA with post hoc Sidak's multiple comparison test, ∗∗p = 0.001. (E) Fluorescein transport study. The permeability coefficient is comparable 24 h post-infection for SARS-CoV-2 (MOI 10) or control-treated samples. Mean ± SEM from n = 3 independent experiments. Unpaired Student’s t test, p > 0.05. (F) Host factors required for SARS-CoV-2 uptake are expressed in hiPS-BCECs and are diminished 24 h post-infection (MOI 10) compared with uninfected cells. Normalized to ACE2 in uninfected cells. Mean ± SEM from n = 3 individual experiments. Two-way ANOVA with post hoc Sidak's multiple comparison test, p > 0.05. (G) Normalized expression of IFITM1 and IFITM2. Left: differential expression analysis of RNA-sequencing data with false discovery rate (FDR) correction for multiple comparisons. p = 0.031 for IFITM1, p = 0.403 for IFITM2. Violin plots and mean of n = 6 independent experiments (uninfected) and n = 4 independent experiments (infected) are shown. Right: differential expression analysis of qRT-PCR data. Mean ± SEM of n = 2 experiments with independent virus isolates, three technical replicates per condition. (H–K) TEM micrographs of SARS-CoV-2-infected hiPS-BCECs. (H) Overview of a TEM cross section of a hiPS-BCEC monolayer. After infection (MOI 10) from the apical side (top black arrow), virus is taken up, is evident in intracellular vesicles (middle black arrow), and is released from the cells on the basolateral side (bottom black arrow). (I and J) Detailed areas in higher resolution from (H). (I) Virus is evident in intracellular vesicles (black arrows). (J) Virus is released from the cells on the basolateral side (black arrow). (K) Neighboring hiPS-BCEC monocultures are connected by complex TJs constricting the paracellular space (black arrows). Furthermore, adhesion points (punctum adherens, black asterisk in K) anchored within the actin filament network were detected, indicating the integrity of cell-cell contacts. Scale bars as indicated. (L) Representative immunofluorescence of SARS-CoV-2-infected hiPS-BCECs stained for SARS-CoV-2 N (red) and TJP1 (green) proteins show intact cell connectivity 24 h post-infection (MOI 10), counterstained by DAPI (blue). Scale bar, 50 μm.
Figure 3
Figure 3
Transcriptional profiling of SARS-CoV-2-infected hiPS-BCECs (A) Volcano plot depicting differentially up- (red) and downregulated (blue) genes. Horizontal line shows −log10 of 0.01; vertical lines show log2 fold change of −1 and 1. (B) Heatmap depicting top 20 upregulated genes in SARS-CoV-2-infected hiPS-BCECs (MOI 10). Color shows row Z score. (C) Heatmap depicting top 20 downregulated genes in SARS-CoV-2-infected hiPS-BCECs. Color shows row Z score. (D) GSEA of top 200 upregulated and top 200 downregulated genes. Color shows results of Wald statistics; size shows number of identified genes for each gene ontology (GO) term. (E) Overlap of downregulated (top) and upregulated (bottom) biological themes of SARS-CoV-2-infected hiPS-BCECs (MOI 10) and blood vessels from COVID-19 brains. (F) Enrichment analysis of upregulated (NES = 2.3, ∗∗p = 0.007) and downregulated (NES = −1.7, p = 0.01) biological themes of blood vessels from COVID-19 brains in SARS-CoV-2-infected blood hiPS-BCECs. NES, normalized enrichment score. Data from n = 3 independent differentiation experiments, one or two replicates each.
Figure 4
Figure 4
SARS-CoV-2 infection of hiPS-BCECs can be diminished by blocking antibodies and small-molecule protease inhibitors (A) In transwell assays, SARS-CoV-2 was used to infect hiPS-BCECs from the apical side (MOI 10). An increase in viral RNA was detected in the basolateral compartment by qRT-PCR. This effect could be significantly diminished by administration of anti-spike antibodies. Mean ± SEM of n = 3 independent experiments, one or two technical replicates each. Unpaired Student’s t test, p = 0.0132. (B) Image-based assessment of hiPS-BCECs after SARS-CoV-2 infection (MOI 10). Anti-spike, anti-ACE2, and anti-NRP1 antibodies and nafamostat (50 and 500 nM) were applied to counteract infection. Cell counting was performed using ImageJ software after staining SARS-CoV-2 N-protein-positive cells (red), counterstained by DAPI (blue). Scale bar, 100 μm. (C) Quantification of (B). Mean ± SEM of n = 3 independent experiments, one or two technical replicates each. One-way ANOVA followed by Dunnett’s multiple comparisons test, ∗∗∗∗p < 0.0001.

Comment in

References

    1. Alimonti J.B., Ribecco-Lutkiewicz M., Sodja C., Jezierski A., Stanimirovic D.B., Liu Q., Haqqani A.S., Conlan W., Bani-Yaghoub M. Zika virus crosses an in vitro human blood brain barrier model. Fluids Barriers CNS. 2018;15:15. - PMC - PubMed
    1. Appelt-Menzel A., Cubukova A., Gunther K., Edenhofer F., Piontek J., Krause G., Stuber T., Walles H., Neuhaus W., Metzger M. Establishment of a human blood-brain barrier co-culture model mimicking the neurovascular unit using induced pluri- and multipotent stem cells. Stem Cell Rep. 2017;8:894–906. - PMC - PubMed
    1. Bao L., Deng W., Huang B., Gao H., Liu J., Ren L., Wei Q., Yu P., Xu Y., Qi F., et al. The pathogenicity of SARS-CoV-2 in hACE2 transgenic mice. Nature. 2020;583:830–833. - PubMed
    1. Butowt R., Meunier N., Bryche B., von Bartheld C.S. The olfactory nerve is not a likely route to brain infection in COVID-19: a critical review of data from humans and animal models. Acta Neuropathol. 2021;141:809–822. - PMC - PubMed
    1. Buzhdygan T.P., DeOre B.J., Baldwin-Leclair A., Bullock T.A., McGary H.M., Khan J.A., Razmpour R., Hale J.F., Galie P.A., Potula R., et al. The SARS-CoV-2 spike protein alters barrier function in 2D static and 3D microfluidic in-vitro models of the human blood-brain barrier. Neurobiol. Dis. 2020;146:105131. - PMC - PubMed

Publication types

MeSH terms