. 2022 Feb 8;17(2):337-351.
doi: 10.1016/j.stemcr.2021.12.016. Epub 2022 Jan 20.

Modeling reduced contractility and impaired desmosome assembly due to plakophilin-2 deficiency using isogenic iPS cell-derived cardiomyocytes

Affiliations

Modeling reduced contractility and impaired desmosome assembly due to plakophilin-2 deficiency using isogenic iPS cell-derived cardiomyocytes

Hiroyuki Inoue et al. Stem Cell Reports. .

Abstract

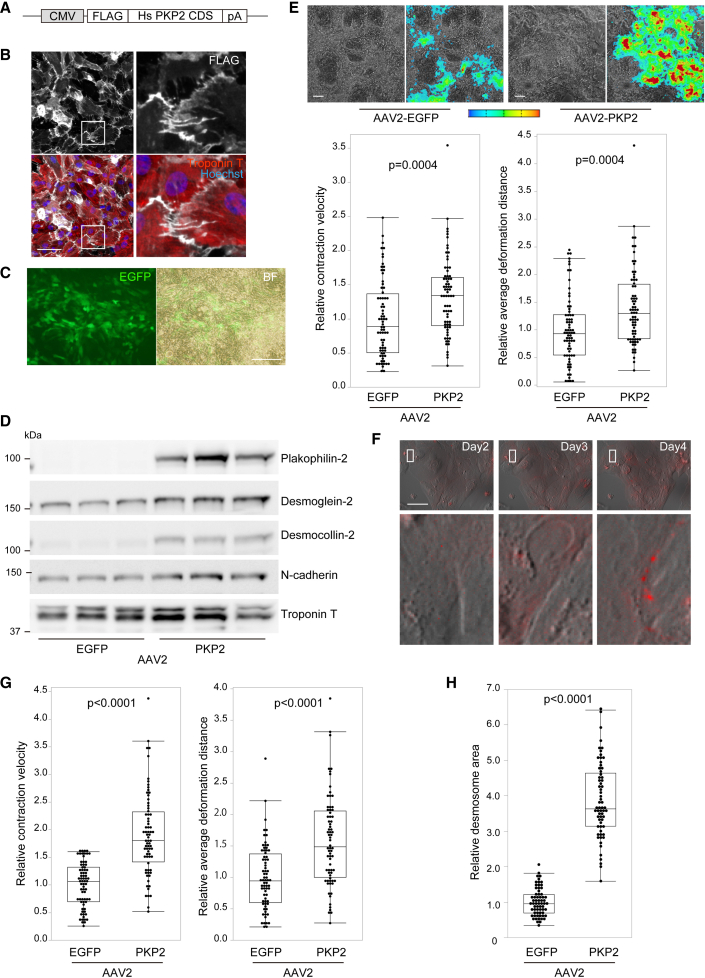
Loss-of-function mutations in PKP2, which encodes plakophilin-2, cause arrhythmogenic cardiomyopathy (AC). Restoration of deficient molecules can serve as upstream therapy, thereby requiring a human model that recapitulates disease pathology and provides distinct readouts in phenotypic analysis for proof of concept for gene replacement therapy. Here, we generated isogenic induced pluripotent stem cell-derived cardiomyocytes (iPSC-CMs) with precisely adjusted expression of plakophilin-2 from a patient with AC carrying a heterozygous frameshift PKP2 mutation. After monolayer differentiation, plakophilin-2 deficiency led to reduced contractility, disrupted intercalated disc structures, and impaired desmosome assembly in iPSC-CMs. Allele-specific fluorescent labeling of endogenous DSG2 encoding desmoglein-2 in the generated isogenic lines enabled real-time desmosome-imaging under an adjusted dose of plakophilin-2. Adeno-associated virus-mediated gene replacement of PKP2 recovered contractility and restored desmosome assembly, which was sequentially captured by desmosome-imaging in plakophilin-2-deficient iPSC-CMs. Our isogenic set of iPSC-CMs recapitulates AC pathology and provides a rapid and convenient cellular platform for therapeutic development.

Keywords: adeno-associated virus; arrhythmogenic cardiomyopathy; desmosome; genome editing; human induced pluripotent stem cell-derived cardiomyocytes; plakophilin-2.


Figures

None
Graphical abstract
Figure 1
Figure 1
Generation of isogenic iPSCs and differentiation to cardiomyocytes (A) Family pedigree chart of the proband. Cases who presented with ventricular arrhythmia are shown as black circles (females) or black boxes (males). The proband is indicated by an arrow. The proband's father was diagnosed with AC with a PKP2 mutation. (B) Direct Sanger sequence analysis using genomic DNA extracted from the peripheral blood of the patient. (C) Relative copy number of PKP2 transcripts in iPSCs and iPSC-CMs was calculated and normalized to that of TATA binding protein (TBP) transcripts in each sample. Relative copy number was calculated as the ratio normalized to the levels of WT transcripts in iPSCs (Mann-Whitney test, four independent experiments). (D) Scheme for generating isogenic iPSCs and the predicted length of plakophilin-2 protein in isogenic iPSC clones. (E) The targeted site of genome editing around the 1228 dupG mutation in exon 5 of human PKP2. gRNA #1 used a mutant AGG sequence as the PAM sequence, and gRNA #2 contained a 20-bp sequence corresponding to the mutant sequence at its 5′ region. gRNA #3 and #4 target the downstream sequence of 1228 dupG. (F) Representative positive droplet signals from ddPCR analysis are shown in the top. The concentration (copies/l) of each PKP2 transcript in the cDNA samples was normalized to that of the TBP transcript. Relative copy number was calculated as the ratio normalized to the value of the WT transcript in Hetero-iPSCs (Kruskal-Wallis test followed by Steel-Dwass test, five independent experiments). (G) Whole-cell lysates were extracted from each iPSC clone and analyzed using western blotting with the indicated antibodies. (H) Quantification of protein expression normalized to GAPDH expression (Kruskal-Wallis test followed by Steel-Dwass test, four to six independent experiments).
Figure 2
Figure 2
Plakophilin-2 insufficiency decreases the contractility of the differentiated monolayer iPSC-CMs (A) Bright-field image of the monolayer Hetero-, HDR-, or NHEJ-iPSC-CMs at day 10 after induction of differentiation. Scale bar: 1 mm. (B) Sequential observation of the monolayer of iPSC-CMs using motion vector analysis. Bright-field images of fixed positions at specific coordinates on days 14, 18, and 28 are shown. Scale bar: 200 μm. (C) Contraction velocity (CV) and deformation distance (DD) in HDR- and NHEJ-iPSC-CMs on days 14 and 28 were analyzed using motion vector analysis (Kruskal-Wallis test followed by Steel-Dwass test). Number of analyzed regions of interest (ROI) for Hetero: 129, HDR: 148, and NHEJ: 96 on day 14. Number of analyzed ROI for Hetero: 117, HDR: 94, NHEJ: 94 on day 28. Data were collected from three independent experiments. (D) Label-free detection of excitation propagation using motion vector analysis excitation. Excitation propagation through the oriented fiber structure was sequentially observed in NHEJ-iPSC-CMs on days 14 and 19. Serial consecutive fluorescence images obtained every 50 ms are shown. Scale bar: 200 μm. Color range from blue to red represents motion velocity from 0 to 30 μm/s, respectively. (E) Whole-cell lysates were extracted from Hetero-, HDR-, and NHEJ-iPSC-CMs at 28 days after differentiation and analyzed using western blotting with the indicated antibodies.
Figure 3
Figure 3
Plakophilin-2 insufficiency disrupts intercalated disc structures (A) Sarcomere structure in isogenic iPSC-CMs 28 days after differentiation was observed using transmission electron microscopy (TEM). Scale bar: 500 nm. (B) Representative desmosome structures and dissociated intercalated discs (arrowheads) in NHEJ-iPSC CMs are shown. The area enclosed within the white dotted square is enlarged on the right. Scale bar: 500 nm. (C) Desmosomal gap width was calculated using TEM images by a blinded operator (Kruskal-Wallis test followed by Steel-Dwass test). Number of analyzed regions in Hetero-iPSC-CMs: 76, HDR-iPSC-CMs: 95, NHEJ-iPSC-CMs: 39. Data were collected from three independent experiments. (D) Representative desmosome structures in Hetero- and HDR-iPSC-CMs. Scale bar: 500 nm. (E) Cytosolic accumulation of lipid droplets in NHEJ-iPSC-CMs (arrowhead). Scale bar: 500 nm.
Figure 4
Figure 4
Plakophilin-2 haploinsufficiency leads to impaired desmosome assembly in iPSC-CMs (A) Whole-cell lysates were extracted from Hetero-, HDR-, and NHEJ-iPSC-CMs on days 14 and 28 after differentiation and analyzed by western blotting using the indicated antibodies. (B) Quantified protein expression levels normalized by GAPDH expression are shown (Kruskal-Wallis test followed by Dunn's test, four to six independent experiments). (C and D)Hetero-, HDR-, and NHEJ-iPSC-CMs were replated on 96-well plates at day 10 after differentiation and subsequently fixed and immunostained at day 14 with the indicated antibodies. Scale bar: 50 μm. Areas enclosed within white squares are enlarged at the bottom. (E) The images shown in (D) were quantitatively analyzed using high-content imaging. Top: raw immunostained images and captured intensity images detected using high-content imaging. Relative desmosome area of each fluorescent signal in HDR-iPSC-CMs was normalized to that in Hetero-iPSC-CMs (Mann-Whitney test, n = 32 images in each iPSC-CM from four independent experiments).
Figure 5
Figure 5
Allele-specific fluorescent labeling of DSG2 captures desmosome dynamics in isogenic iPSC-CMs (A) The targeted site of genome editing around the 3′ terminus of exon 15 of human DSG2. The repair template DNA contained T at the SNP site in the 5′-homology arm to distinguish the knocked-in allele after genome editing. The 3′-homology arm contained PAM sequence modification from CC to AA to avoid recleavage by Cas9. Arrows indicate the positions of the PCR primers used to distinguish the knocked-in allele. (B) Electrophoresis of PCR products using genomic DNA extracted from Hetero-, HDR-, NHEJ-tdT-iPSCs, or original isogenic iPSCs. PCR products at 2,277 bp were derived from the knocked-in allele, and those at 632 bp were derived from the non-edited allele. (C) Scheme showing isogenic iPSCs containing the identical set of DSG2 alleles in which tdTomato was introduced specifically into the SNP: T allele; the other SNP: C allele remained intact. (D) Whole-cell lysates were extracted from each iPSC line and analyzed using western blotting with the indicated antibodies. Arrowheads indicate the desmoglein-2-tdTomato fusion protein. (E) Isogenic tdT-iPSCs were fixed, and nuclei were stained with Hoechst stain. Scale bar: 50 μm. (F) Live-cell images (bright-field and fluorescence images) of HDR-tdT-iPSCs and HDR-tdT-iPSC-CMs on day 14 after differentiation. Scale bar: 50 μm. (G) Isogenic tdT-iPSCs were fixed and immunostained with anti-troponin T and desmoglein-2 antibodies. Nuclei were stained with Hoechst stain. Scale bar: 50 μm. (H) Live-cell images of Hetero- and HDR-tdT-iPSC-CMs 14 days after differentiation were obtained using high-content imaging. Areas enclosed within white squares in the middle are enlarged in at the right. Scale bars: 50 μm. (I) The images shown in (H) were quantitatively analyzed using high-content imaging. The relative desmosome area of each fluorescent signal in HDR-tdT-iPSC-CMs was normalized to that in Hetero-tdT-iPSC-CMs (Mann-Whitney test, n = 108 images in each iPSC-CM from four independent experiments).
Figure 6
Figure 6
AAV-mediated gene delivery of PKP2 recovered contractility and desmosome assembly in plakophilin-2-deficient iPSC-CMs (A) N-terminal FLAG-tagged full-length human PKP2 coding sequence (Hs PKP2 CDS) was subcloned into the expression vector with a CMV promoter and poly(A) sequence to generate the AAV2 vector. (B) NHEJ-iPSC-CMs transduced with AAV2 encoding FLAG-tagged PKP2 were fixed and immunostained with the indicated antibodies 5 days after transduction. Areas enclosed within white squares in the left are enlarged in the panels on the right. Scale bar: 50 μm. (C) Monolayer contracting NHEJ-iPSC-CMs cultured in 12-well plates at day 10 after differentiation were transduced with approximately 1.0 × 104 vg/cell of AAV2-EGFP or AAV2-PKP2. Fourteen days after transduction, EGFP expression in contracting NHEJ-iPSC-CMs was observed through fluorescence microscopy. Scale bar: 200 μm. (D) NHEJ-iPSC-CMs were treated as described in (C). Whole-cell lysates were extracted from iPSC-CMs 14 days after transduction and analyzed by western blotting using the indicated antibodies. (E) Bright-field images and excitation propagation were detected by motion vectors in NHEJ-iPSC-CMs 14 days after transduction, either with AAV2-EGFP or with AAV2-PKP2. Color range from blue to red represents motion velocity from 0 to 30 μm/s, respectively. Scale bar: 100 μm. CV and DD in iPSC-CMs were calculated using motion vector analysis (Mann-Whitney test, number of analyzed ROIs, AAV2-EGFP: 72, AAV2-PKP2: 72). Data were collected from three independent experiments. (F) Sequential merged images of bright-field and tdTomato fluorescence after AAV2-PKP2 transduction in NHEJ-tdT-iPSC-CMs. Scale bar: 50 μm. (G) Hetero-iPSC-CMs were treated as described (C). CV and DD in iPSC-CMs were calculated using motion vector analysis (Mann-Whitney test, number of analyzed ROIs, AAV2-EGFP: 72, AAV2-PKP2: 72). Data were collected from three independent experiments. (H) Hetero-tdT-iPSC-CMs at day 10 after differentiation were replated and transduced with AAV2-EGFP or AAV2-PKP2. Fourteen days after transduction; desmosome area was assessed using live-cell high-content imaging. Relative desmosome area of each fluorescence signal in Hetero-iPSC-CMs transduced with AAV2-PKP2 were normalized to those with AAV2-EGFP (Mann-Whitney test, n = 64 images in each iPSC-CM from four independent experiments).

References

    1. Al-Jassar C., Bikker H., Overduin M., Chidgey M. Mechanistic basis of desmosome-targeted diseases. J. Mol. Biol. 2013;425:4006–4022. - PMC - PubMed
    1. Austin K.M., Trembley M.A., Chandler S.F., Sanders S.P., Saffitz J.E., Abrams D.J., Pu W.T. Molecular mechanisms of arrhythmogenic cardiomyopathy. Nat. Rev. Cardiol. 2019;16:519–537. - PMC - PubMed
    1. Awad M.M., Calkins H., Judge D.P. Mechanisms of disease: molecular genetics of arrhythmogenic right ventricular dysplasia/cardiomyopathy. Nat. Clin. Pract. Cardiovasc. Med. 2008;5:258–267. - PMC - PubMed
    1. Burridge P.W., Matsa E., Shukla P., Lin Z.C., Churko J.M., Ebert A.D., Lan F., Diecke S., Huber B., Mordwinkin N.M., et al. Chemically defined generation of human cardiomyocytes. Nat. Methods. 2014;11:855–860. - PMC - PubMed
    1. Calkins H., Corrado D., Marcus F. Risk stratification in arrhythmogenic right ventricular cardiomyopathy. Circulation. 2017;136:2068–2082. - PMC - PubMed

Publication types

MeSH terms