. 2022 Apr:54:101071.
doi: 10.1016/j.dcn.2022.101071. Epub 2022 Jan 15.

Spectral pattern similarity analysis: Tutorial and application in developmental cognitive neuroscience

Affiliations

Spectral pattern similarity analysis: Tutorial and application in developmental cognitive neuroscience

Verena R Sommer et al. Dev Cogn Neurosci. 2022 Apr.

Abstract

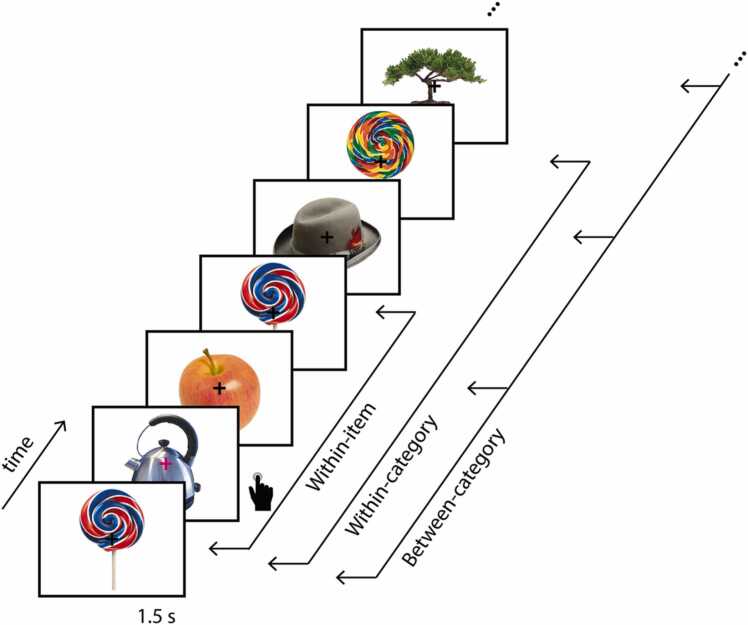
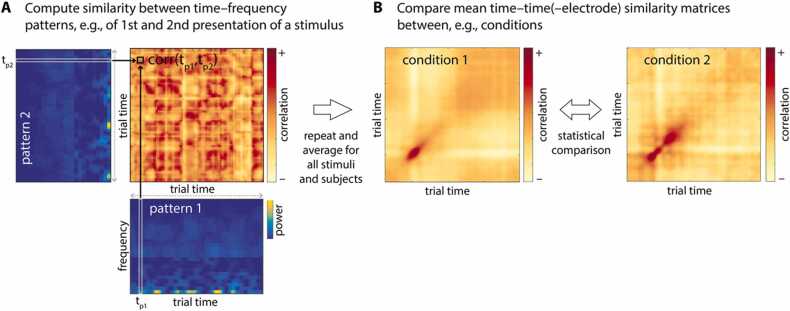
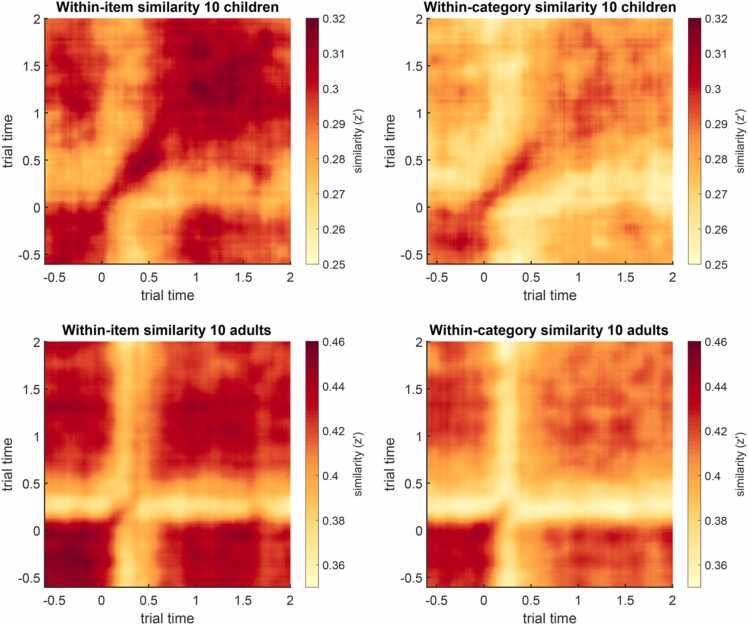
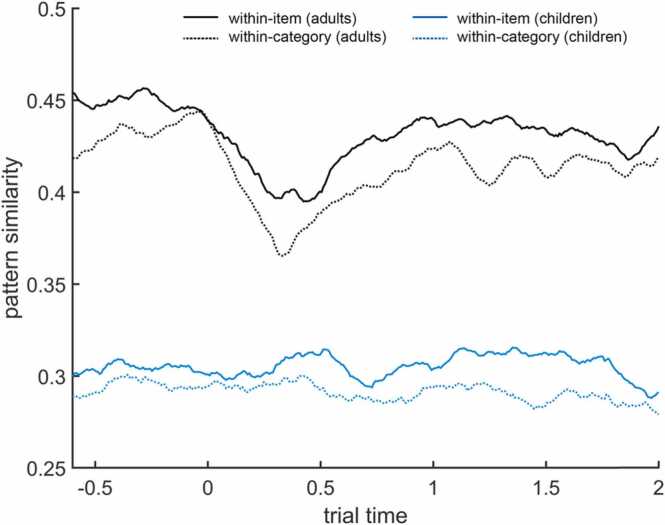
The human brain encodes information in neural activation patterns. While standard approaches to analyzing neural data focus on brain (de-)activation (e.g., regarding the location, timing, or magnitude of neural responses), multivariate neural pattern similarity analyses target the informational content represented by neural activity. In adults, a number of representational properties have been identified that are linked to cognitive performance, in particular the stability, distinctiveness, and specificity of neural patterns. However, although growing cognitive abilities across childhood suggest advancements in representational quality, developmental studies still rarely utilize information-based pattern similarity approaches, especially in electroencephalography (EEG) research. Here, we provide a comprehensive methodological introduction and step-by-step tutorial for pattern similarity analysis of spectral (frequency-resolved) EEG data including a publicly available pipeline and sample dataset with data from children and adults. We discuss computation of single-subject pattern similarities and their statistical comparison at the within-person to the between-group level as well as the illustration and interpretation of the results. This tutorial targets both novice and more experienced EEG researchers and aims to facilitate the usage of spectral pattern similarity analyses, making these methodologies more readily accessible for (developmental) cognitive neuroscientists.

Keywords: Electroencephalography (EEG); Neural distinctiveness; Neural stability; Representational pattern similarity analysis; Time-frequency representations (TFR).


Conflict of interest statement

The authors declare that they have no known competing financial interests or personal relationships that could have appeared to influence the work reported in this paper.

Figures

Fig. 1
Fig. 1
Overview of the encoding phase of the memory task paradigm (Sommer et al., 2021) and representational similarity levels. In the encoding task, objects were sequentially presented, and participants were asked to press a button whenever the fixation cross changed color. The sample dataset contains trials of two repetitions of two exemplars from each object category. Within-item similarity is the similarity of the neural patterns elicited by seeing identical objects. Within-category similarity is the similarity of the neural patterns evoked by different exemplars from the same object category. Between-category similarity is the mean pairwise similarity of the neural patterns evoked by all of the different object categories. Both within-category and between-category similarity are also called between-item similarity.
Fig. 2
Fig. 2
Illustration of spectral EEG pattern similarity analysis. A. Representational similarity is operationalized as pairwise correlations of the frequency patterns at each trial time point, separately for each electrode and subject. B. The resulting time–time similarity matrices contain the individual similarity at all trial time point combinations and can be averaged across trials, electrodes, and/or participants, and compared between conditions or groups, for instance. To assess differences in similarity patterns across conditions or groups, non-parametric cluster-based permutation statistics can be applied.
Fig. 3
Fig. 3
Time–time pattern similarity matrices of within-item similarity (left) and between-item (within-category) similarity (right), averaged across trials, electrodes, 10 children (CH; top), and 10 young adults (YA, bottom). Similarity is measured in Fisher-z transformed Pearson correlation coefficients (z’). These figures can be created with step3_plot_sim_matrices. Note that the color scales differ between age groups.
Fig. 4
Fig. 4
Diagonals of the time–time pattern similarity matrices (see Fig. 3) for within-item similarity (solid line) and within-category similarity (dotted line) in children (blue) and adults (black). These plots can be created with step3_plot_sim_matrices (separately for children and adults).
Fig. 5
Fig. 5
Visualization of effect sizes (t-values) in clusters identified to show item specificity (i.e., reliable differences between within-item and between-item similarity) in children (top) and adults (bottom). Left: Effect sizes within time × time cluster dimensions, averaged across significant electrodes. Right: Topographic representations of effect sizes across electrodes, averaged over significant time points. Highlighted channels (asterisks) are included in the cluster. Note that different EEG systems were used for children and adults, resulting in different electrode layouts. These images can be created with step5_plot_clusters.
Fig. 6
Fig. 6
Pattern similarity matrices (identical to Fig. 2) plus outlines of identified clusters (see Fig. 5) showing at what time–time coordinates within-item (left) and within-category (right) similarities may show reliable differences, averaged across electrodes, for children (top) and adults (bottom). These images can be created with step5_plot_clusters.
Fig. 7
Fig. 7
Comparison of mean within-item and between-item (within-category) pattern similarities extracted from identified clusters in individual children (blue, x) and adults (black, o). This figure can be created with step6_plot_sim_comparison.
Fig. 8
Fig. 8
Item specificity (computed as the difference between within-item and within-category similarity) in children (blue) and adults (black). Group distributions as un-mirrored violin plots (probability density functions), boxplots with 1st, 2nd (median), and 3rd quartiles, whiskers with 2nd and 98th percentiles, and individual (vertically jittered) data points. This figure can be created with step6_plot_sim_comparison, which uses the raincloud_plot function (Allen et al., 2019).
Fig. 9
Fig. 9
Between-subject association of item specificity and item memory in children (blue, x) and adults (black, o) indicated by least-squares lines. This figure can be created with step7_correlation_with_behavior.

References

    1. Abbate A., DeCusatis C.M., Das P.K. In: Wavelets and Subbands: Fundamentals and Applications. Abbate A., DeCusatis C.M., Das P.K., editors. Applied and Numerical Harmonic Analysis; 2002. Time-frequency analysis of signals; pp. 103–187. - DOI
    1. Akam T., Kullmann D.M. Oscillations and filtering networks support flexible routing of information. Neuron. 2010;67:308–320. doi: 10.1016/j.neuron.2010.06.019. - DOI - PMC - PubMed
    1. Allefeld C., Görgen K., Haynes J.D. Valid population inference for information-based imaging: From the second-level t-test to prevalence inference. NeuroImage. 2016;141:378–392. doi: 10.1016/j.neuroimage.2016.07.040. - DOI - PubMed
    1. Allen M., Poggiali D., Whitaker K., Marshall T.R., Kievit R.A. Raincloud plots: a multi-platform tool for robust data visualization. Wellcome Open Res. 2019;4:63. doi: 10.12688/wellcomeopenres.15191.1. - DOI - PMC - PubMed
    1. Axmacher N., Henseler M.M., Jensen O., Weinreich I., Elger C.E., Fell J. Cross-frequency coupling supports multi-item working memory in the human hippocampus. Proc. Natl. Acad. Sci. USA. 2010;107:3228–3233. doi: 10.1073/pnas.0911531107. - DOI - PMC - PubMed

Publication types

LinkOut - more resources