. 2022 Mar 9;42(10):2103-2115.
doi: 10.1523/JNEUROSCI.1256-21.2022. Epub 2022 Jan 21.

Mechanisms and Consequences of Cerebellar Purkinje Cell Disinhibition in a Mouse Model of Duchenne Muscular Dystrophy

Affiliations

Mechanisms and Consequences of Cerebellar Purkinje Cell Disinhibition in a Mouse Model of Duchenne Muscular Dystrophy

Wan-Chen Wu et al. J Neurosci. .

Abstract

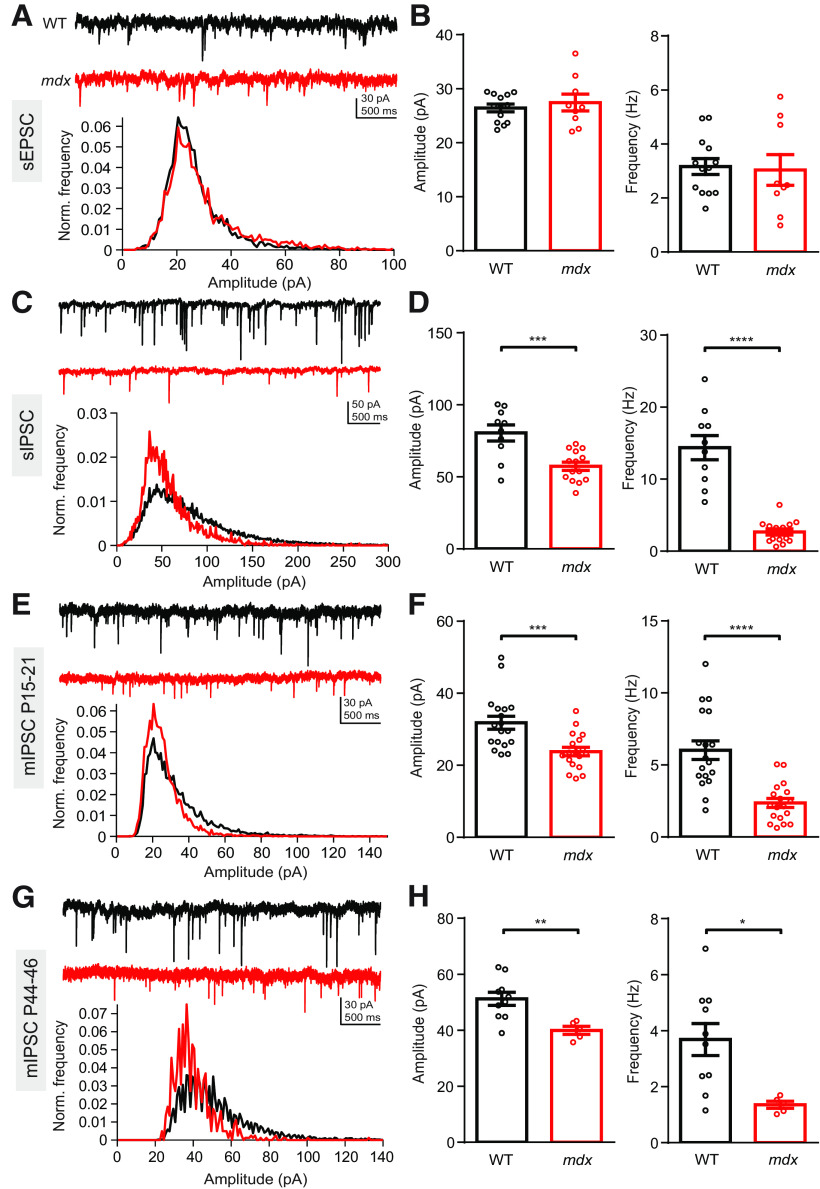
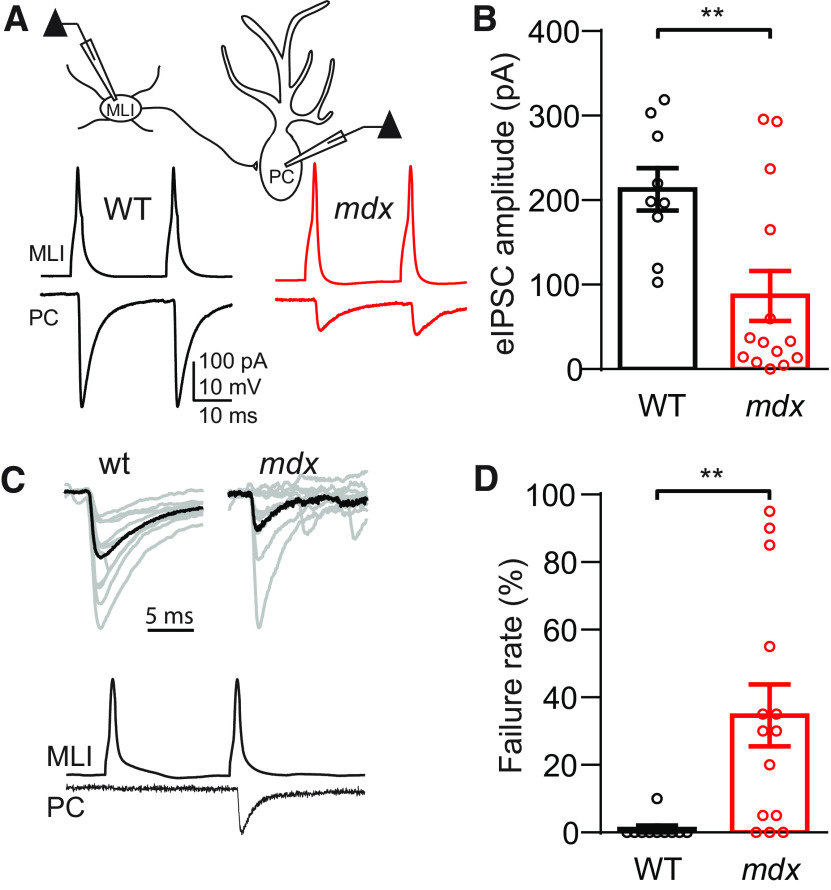
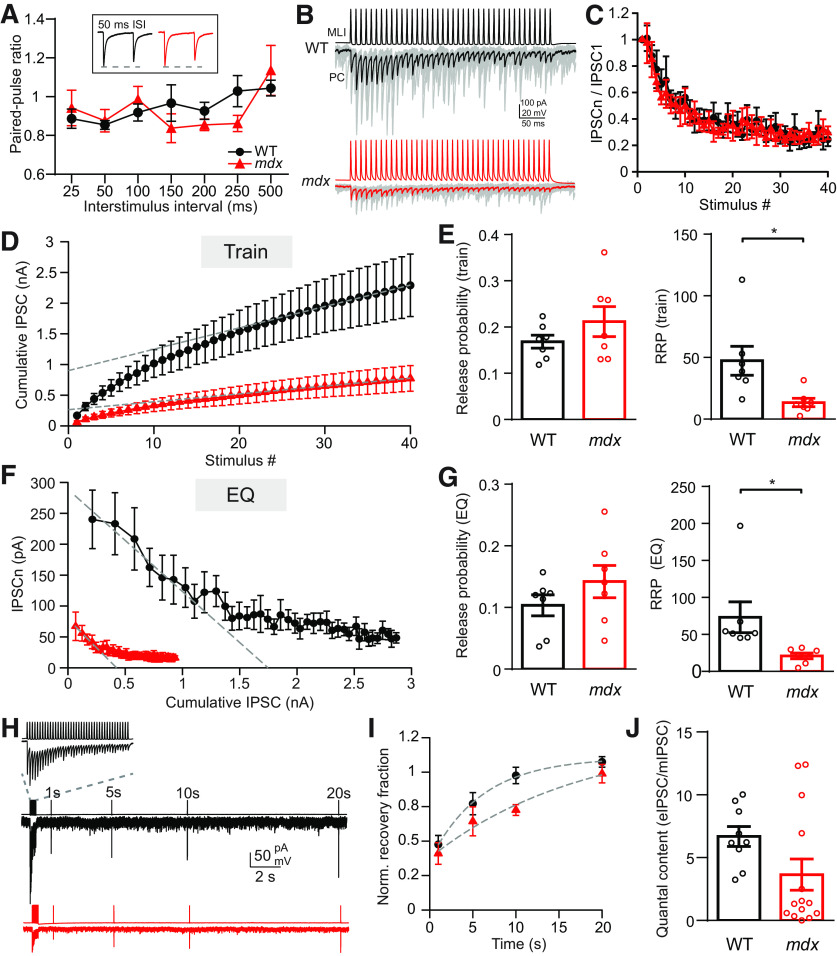
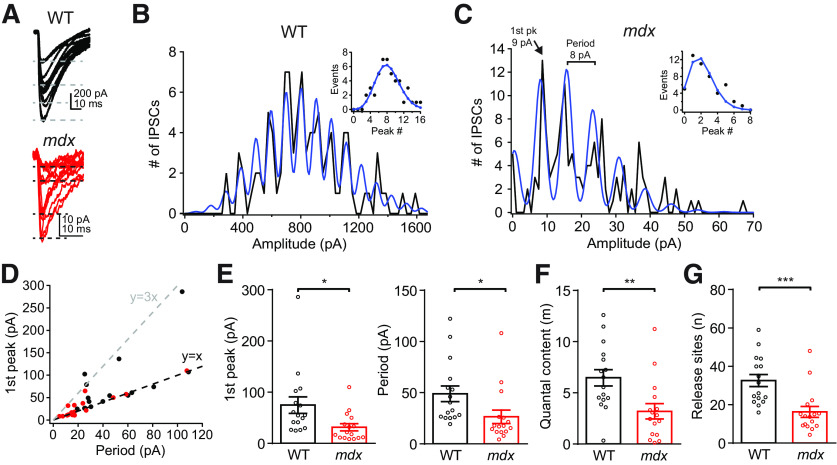
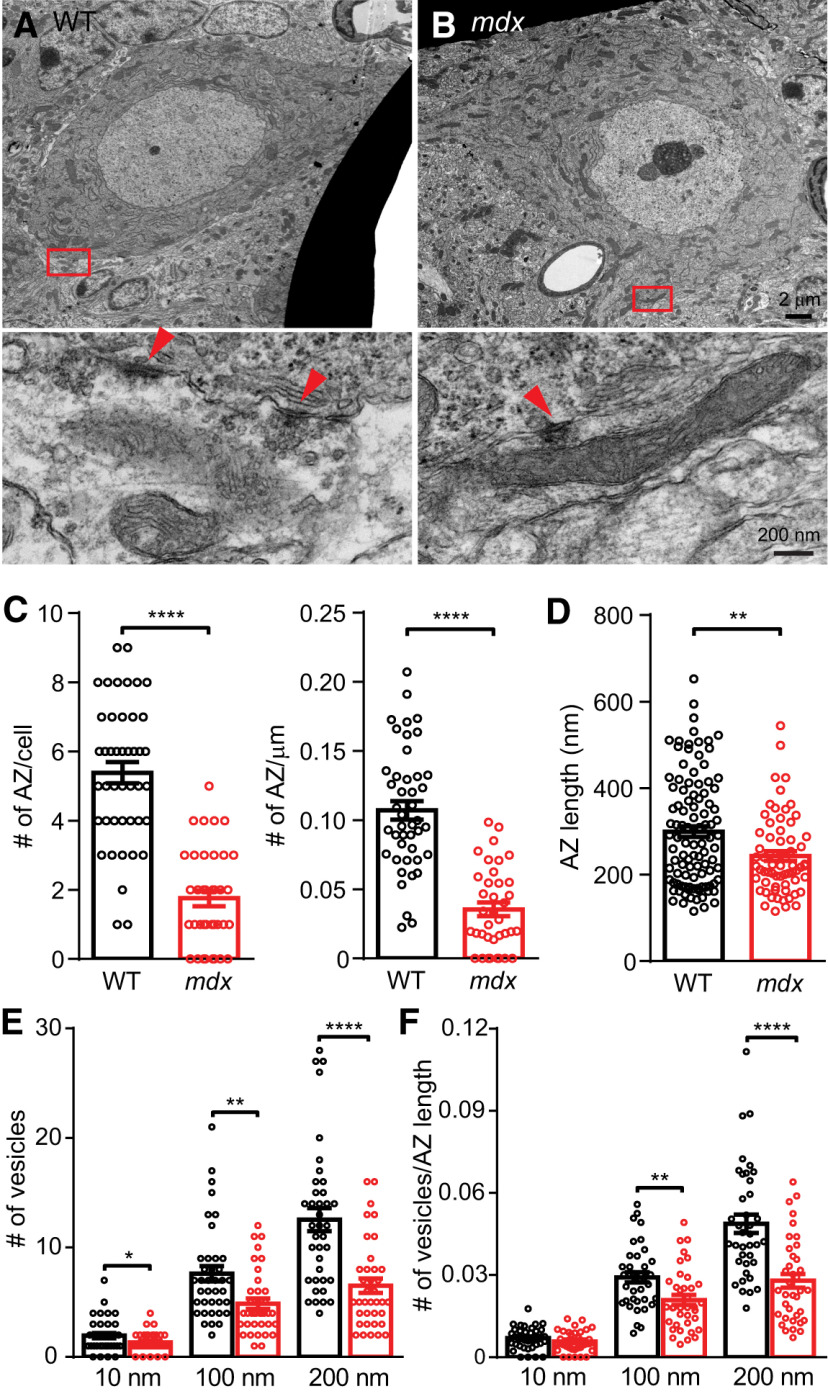
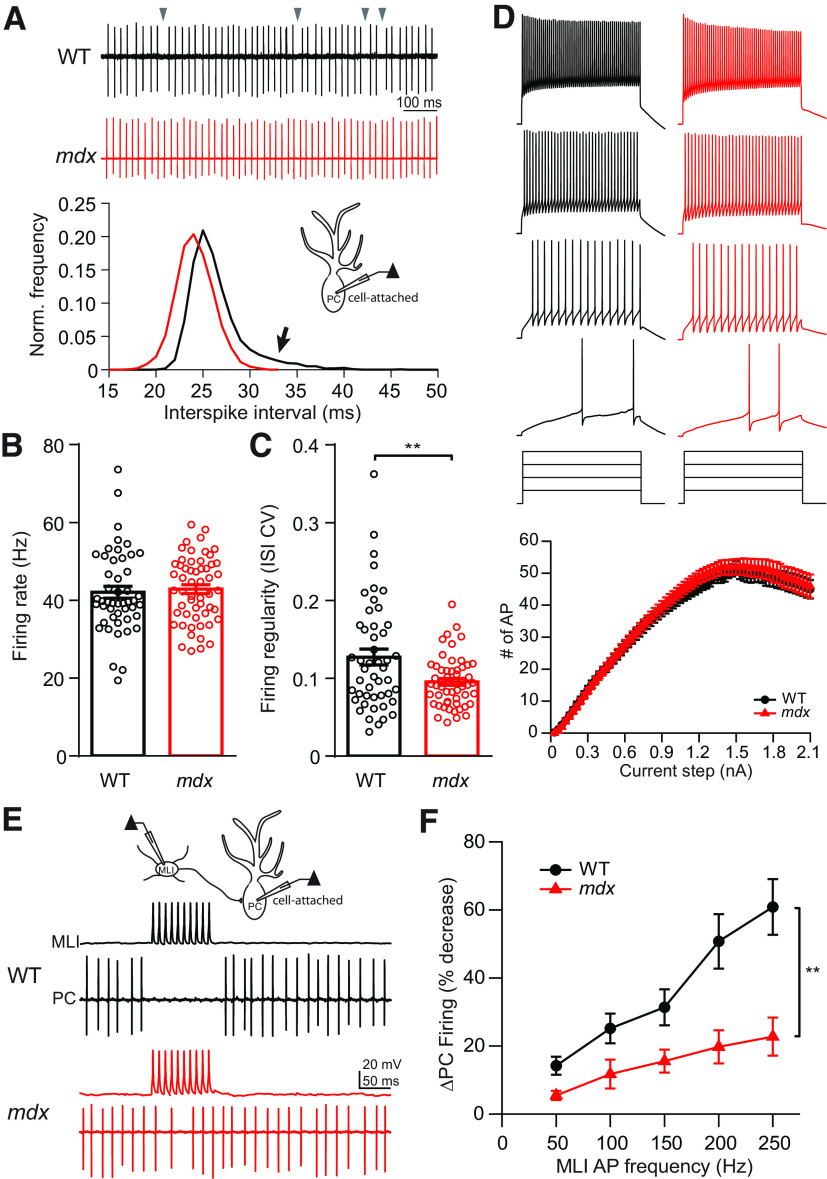
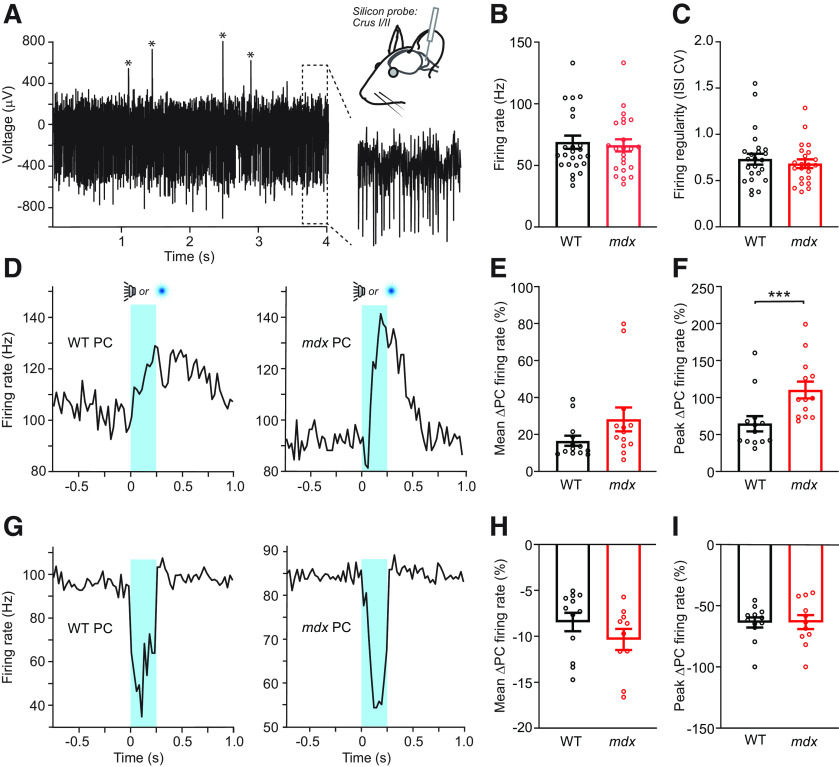
Duchenne muscular dystrophy (DMD), the most common form of childhood muscular dystrophy, is caused by mutations in the dystrophin gene. In addition to debilitating muscle degeneration, patients display a range of cognitive deficits thought to result from the loss of dystrophin normally expressed in the brain. While the function of dystrophin in muscle tissue is well characterized, its role in the brain is still poorly understood. The highest expression of dystrophin in the mouse brain is in cerebellar Purkinje cells (PCs), where it colocalizes with GABAA receptor clusters. Using ex vivo electrophysiological recordings from connected molecular layer interneuron (MLI)-PC pairs, we investigated changes in inhibitory synaptic transmission caused by dystrophin deficiency. In male mdx mice (which lack long-form dystrophin), we found that responses at MLI-PC pairs were reduced by ∼60% because of both decreased quantal response amplitude and a reduced number of functional vesicle release sites. Using electron microscopy, we found significantly fewer and smaller anatomically defined inhibitory synapses contacting the soma of PCs in mdx mice, suggesting that dystrophin may play a critical role in synapse formation and/or maintenance. Functionally, we found reduced MLI-evoked pauses in PC firing in acute slices. In vivo recordings from awake mdx mice showed increased sensory-evoked simple spike firing in positively modulating PCs, consistent with reduced feedforward inhibition, but no change in negatively modulating PCs. These data suggest that dystrophin deficiency in PCs disrupts inhibitory signaling in the cerebellar circuit and PC firing patterns, potentially contributing to cognitive and motor deficits observed in mdx mice and DMD patients.SIGNIFICANCE STATEMENT Duchenne muscular dystrophy (DMD) is primarily characterized by progressive muscle weakening caused by genetic mutations in the gene for dystrophin. Dystrophin is also normally expressed in the CNS, and DMD patients experience a range of nonprogressive cognitive deficits. The pathophysiology of CNS neurons resulting from loss of dystrophin and the function of dystrophin in neurons are still poorly understood. Using cerebellar PCs as a model, we found that the loss of dystrophin specifically disrupts the number and strength of inhibitory synaptic connections, suggesting that dystrophin participates in formation and/or maintenance of these synapses. This work provides insight into the function of dystrophin in the CNS and establishes neuronal and synaptic dysfunction, which may underlie cognitive deficits in DMD.

Keywords: DMD; Purkinje; dystrophin; inhibition; mdx; synapse.


Figures

Figure 1.
Figure 1.
Inhibitory synaptic currents are impaired in mdx PCs. A, Top, Representative sEPSC traces from a WT (black) and mdx (red) PC. Bottom, Normalized event distribution plot showing all sEPSC events recorded from WT and mdx PCs. B, Average sEPSC amplitude (left) and frequency (right) in WT and mdx PCs. C, Top, Representative sIPSC traces from a WT (black) and mdx (red) PC. Bottom, Normalized sIPSC distribution plots. D, Average sIPSC amplitude (left) and frequency (right) in WT and mdx PCs. E, Top, Representative mIPSC traces from a WT (black) and mdx (red) PC from P15 to P21 mice. Bottom, Normalized mIPSC distribution plots. F, Average mIPSC amplitude (left) and frequency (right) in P15 to P21 WT and mdx PCs. G, Top, Representative mIPSC traces from a WT (black) and mdx (red) PC from P44 to P46 mice. Bottom, Normalized mIPSC distribution plots. H, Average mIPSC amplitude (left) and frequency (right) in P44 to P46 WT and mdx PCs. Circles in bar graphs represent individual data points. * p < 0.05, ** p < 0.01, *** p < 0.001 and **** p < 0.0001.
Figure 2.
Figure 2.
Evoked IPSCs are reduced in MLI–PC paired recordings. A, Top, Simplified diagram of simultaneous MLI–PC paired recording. Bottom, Representative traces of MLI APs and resulting eIPSCs in connected PCs from a WT (black) and mdx (red) animal. B, Average eIPSC amplitude in WT and mdx PCs. C, Top, Ten consecutive eIPSC traces (gray) and average eIPSC trace (black) from WT and mdx PCs, showing synaptic failures in mdx. Bottom, Traces from a connected MLI–PC pair showing a synaptic failure following the first AP. D, Average synaptic failure rate in WT and mdx PCs. Circles in bar graphs represent individual data points. ** p < 0.01.
Figure 3.
Figure 3.
RRP, but not release probability, is reduced at MLI–PC synapses. A, Average paired-pulse ratio (IPSC2/IPSC1) measured over a range of ISIs in WT (black) and mdx (red) PCs. Inset, Example traces showing pairs of IPSCs (50 ms ISI). B, Representative traces of AP trains (100 Hz) in MLIs and evoked IPSCs (thin gray lines are individual sweeps, thick lines are average traces) in connected WT (black) and mdx (red) PCs. C, Plots of IPSC amplitudes (normalized to the first IPSC) during a 100 Hz train of stimuli from WT (black) and mdx (red). The profiles of short-term plasticity and steady-state depression were not different between genotypes. D, Average cumulative IPSC from WT (black) and mdx (red) MLI–PC synapses plotted against stimulus number. Linear fits to the last 15 points of each curve and the extrapolated y-intercept are also shown (gray dashed lines). E, Average release probability (left) and readily releasable pool size (right) calculated from cumulative IPSC plots (train method). F, Average IPSC amplitude from WT (black) and mdx (red) MLI–PC synapses plotted against cumulative IPSC amplitude. Linear fits to the first 5 points of each curve and extrapolated x-intercepts are also shown (gray dashed lines). G, Average release probability (left) and readily releasable pool size (right) calculated from cumulative IPSC plots (EQ method). H, Example traces of IPSC amplitude recovery following vesicle depletion in WT (black) and mdx (red) PCs. Inset, Expanded view of 100 Hz MLI AP train and resulting PC IPSCs used to deplete vesicles at MLI–PC synapses. I, Plot of IPSC recovery over time (normalized to the first IPSC in the 100 Hz stimulus train) in WT (black) and mdx (red) PCs. Single exponential fits to recovery data points (gray dashed lines) are also shown. J, Estimate of quantal content measured by dividing the first IPSC amplitude of each MLI–PC pair by the average mIPSC amplitude for each genotype. Circles in bar graphs represent individual data points. * p < 0.05.
Figure 4.
Figure 4.
Quantal analysis of eIPSCs from MLI–PC pairs. A, Examples of 15 consecutive eIPSC traces from WT (top) or mdx (bottom) MLI–PC paired recordings, showing quantal increases in IPSC amplitude. B, C, Frequency histogram of IPSC amplitudes and fit using the sum of Gaussian functions (blue) from WT (B) and mdx (C) PCs. Data from the same cells shown in A. Inset, Histogram peaks (circles) and curve fit using a binomial function (blue line). D, Plot showing correlation of the distance between histogram peaks (determined by the period of the Gaussian fitting function) and the value of the first histogram peak greater than zero for each MLI–PC pair. E, Average amplitude of eIPSCs in the first histogram peak (left) and average period of Gaussian fit (right) in WT (black) and mdx (red) MLI–PC pairs. F, G, Average quantal content (m) of eIPSC and number of functional release sites (n) between WT (black) and mdx (red) MLI–PC pairs. Circles in bar graphs represent data from individual cells. * p < 0.05, ** p < 0.01, and *** p < 0.001.
Figure 5.
Figure 5.
Reduced number of anatomically defined inhibitory synapses on mdx PC soma. A, B, Top, WT and mdx PC soma imaged at 4000×. Bottom, 50,000× magnification of the red boxes in the top panels. Red arrowheads indicate individual synaptic structures. C, Average number of AZs per PC soma (left), and average number of AZs per micrometer of surface membrane (right). D, Average AZ length. E, Average number of synaptic vesicles within 10, 100, or 200 nm of the AZ in WT and mdx. F, Average number of synaptic vesicles within 10, 100, or 200 nm of the AZ normalized to AZ length. Circles in bar graphs represent data from individual cells/synapses. * p < 0.05, ** p < 0.01, *** p < 0.001, and **** p < 0.0001.
Figure 6.
Figure 6.
Ex vivo slice measurement of PC activity. A, Top, Representative cell-attached traces of spontaneous firing from a WT (black) and mdx (red) PC. Gray arrowheads indicate prolonged ISIs in WT PC. Bottom, Representative normalized frequency distribution of ISIs recorded from a WT (black) and an mdx (red) PC. Arrow indicates larger rightward tail of the distribution in the WT cell. B, Average PC spontaneous firing rate. C, Average CV of ISIs. D, Representative traces of PC firing during step current injections as a measure of intrinsic excitability and average input–output curves resulting from step current injections (bottom). E, Diagram of MLI–PC paired recording configuration (top) and representative traces of simultaneously recorded APs evoked in an MLI and spontaneous firing from a WT (black) and mdx (red) PC, showing MLI-mediated pause/reduction in PC firing. F, Average change in PC firing rate during stimulation of APs in a connected MLI over a range of frequencies (50–250 Hz). Circles in bar graphs represent individual data points. ** p < 0.01.
Figure 7.
Figure 7.
In vivo measurement of PC activity. A, Extracellular unit recordings were obtained from PCs located in left lobules Crus I or Crus II from WT (n = 5) or mdx (n = 4) mice. The voltage trace from an example PC shows abundant simple spikes that are clearly apparent in the expanded view as well as complex spikes (marked by asterisks). B, C, Across-genotype comparison of mean simple spike firing rate and variability of PCs during quiescence. D, Average peristimulus time histograms for two positively modulating PCs in response to trials of unexpected sensory stimuli (the timing of audible tones or light flashes is indicated in blue). E, F, Although there was no difference in the mean firing rate of sensory-evoked simple spiking between genotypes (p = 0.09), there was a significant increase in the peak firing rate of positively modulating PCs from mdx mice relative to WTs (p = 0.0005). G, Average peristimulus time histograms for two negatively modulating PCs. H, I, Across-genotype comparison of the mean and the peak rate of diminished simple spike firing for negatively modulating PCs during unexpected sensory stimuli. *** p < 0.001.

References

    1. Achard P, De Schutter E (2008) Calcium, synaptic plasticity and intrinsic homeostasis in Purkinje neuron models. Front Comput Neurosci 2:8. 10.3389/neuro.10.008.2008 - DOI - PMC - PubMed
    1. Altman J (1972) Postnatal development of the cerebellar cortex in the rat. II. Phases in the maturation of Purkinje cells and of the molecular layer. J Comp Neurol 145:399–464. 10.1002/cne.901450402 - DOI - PubMed
    1. Anderson JL, Head SI, Morley JW (2003) Altered inhibitory input to Purkinje cells of dystrophin-deficient mice. Brain Res 982:280–283. 10.1016/s0006-8993(03)03018-x - DOI - PubMed
    1. Billard C, Gillet P, Signoret JL, Uicaut E, Bertrand P, Fardeau M, Barthez-Carpentier MA, Santini JJ (1992) Cognitive functions in Duchenne muscular dystrophy: a reappraisal and comparison with spinal muscular atrophy. Neuromuscul Disord 2:371–378. 10.1016/s0960-8966(06)80008-8 - DOI - PubMed
    1. Boyd IA, Martin AR (1956) The end-plate potential in mammalian muscle. J Physiol 132:74–91. 10.1113/jphysiol.1956.sp005503 - DOI - PMC - PubMed

Publication types

Substances

LinkOut - more resources