. 2022 Jan 25;119(4):e2110406119.
doi: 10.1073/pnas.2110406119.

Narratives imagined in response to instrumental music reveal culture-bounded intersubjectivity

Affiliations

Narratives imagined in response to instrumental music reveal culture-bounded intersubjectivity

Elizabeth H Margulis et al. Proc Natl Acad Sci U S A. .

Abstract

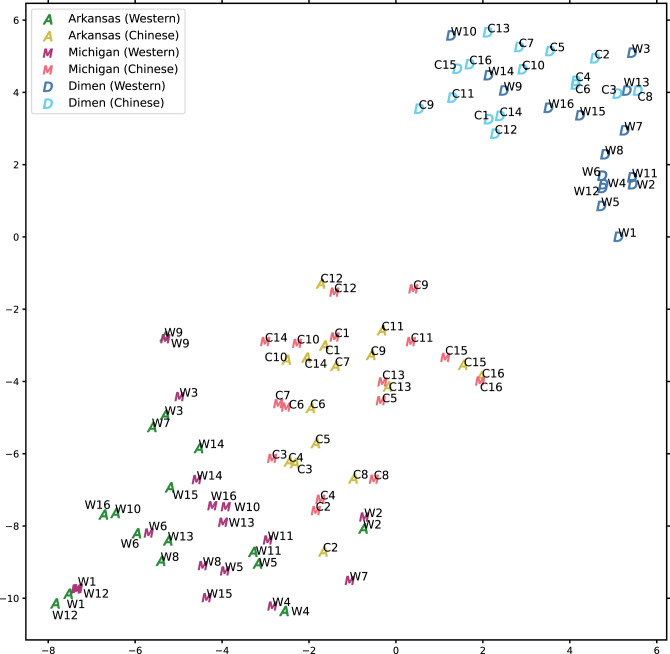
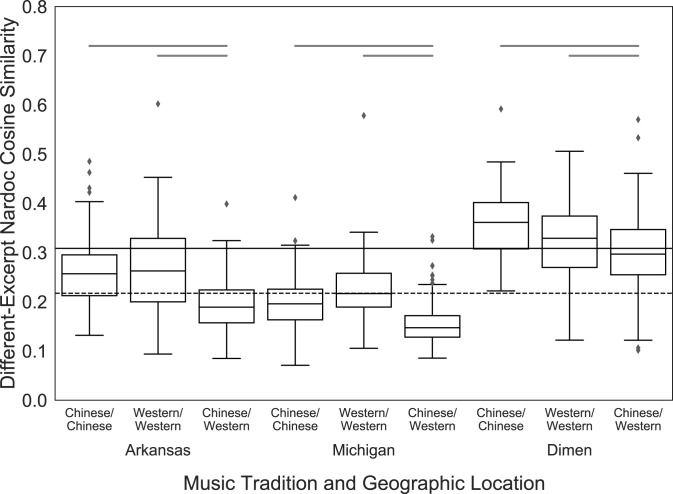
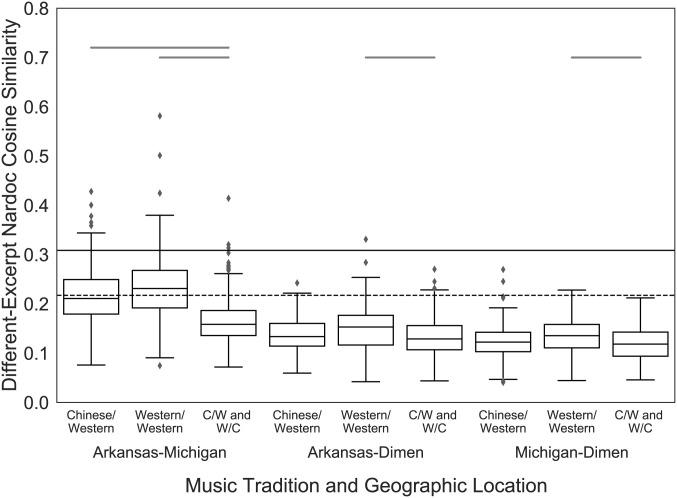
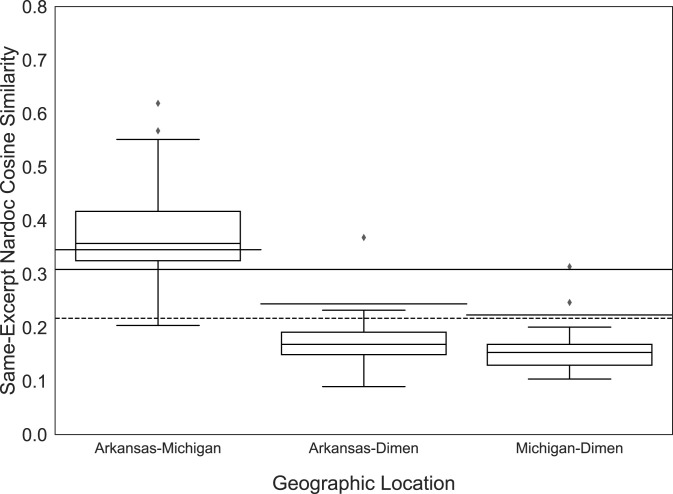
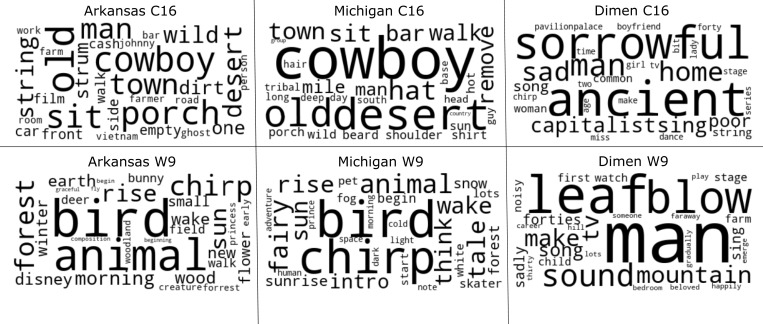
The scientific literature sometimes considers music an abstract stimulus, devoid of explicit meaning, and at other times considers it a universal language. Here, individuals in three geographically distinct locations spanning two cultures performed a highly unconstrained task: they provided free-response descriptions of stories they imagined while listening to instrumental music. Tools from natural language processing revealed that listeners provide highly similar stories to the same musical excerpts when they share an underlying culture, but when they do not, the generated stories show limited overlap. These results paint a more complex picture of music's power: music can generate remarkably similar stories in listeners' minds, but the degree to which these imagined narratives are shared depends on the degree to which culture is shared across listeners. Thus, music is neither an abstract stimulus nor a universal language but has semantic affordances shaped by culture, requiring more sustained attention from psychology.

Keywords: culture; imagination; music; narrative; semantics.


Conflict of interest statement

The authors declare no competing interest.

Figures

Fig. 1.
Fig. 1.
Visualization of narrative documents (nardocs) in semantic space. Each symbol represents the average position of a nardoc projected into the predefined embedding space. The proximity of two nardocs in embedding space corresponds to the extent of shared semantic content (i.e., points for nardocs that are closer together represent greater semantic similarity). Individual excerpt labels are represented by W or C for music tradition (Western or Chinese) followed by the excerpt number (1 to 16 for each). Locations are labeled by a larger letter (A = Arkansas, M = Michigan, D = Dimen).
Fig. 2.
Fig. 2.
Comparison of stories prompted by different music excerpts at the same geographic location. For each of the 32 excerpts, we calculated the pairwise cosine similarities between the TF-IDF vectors for narrative documents collected from the same geographic location. We excluded same-excerpt comparisons and instead examined different-excerpt similarity based on the music tradition an excerpt belongs to. The nine box-and-whisker plots depict the median value and quantiles of the distribution of different-excerpt similarity values in each comparison within geographic locations. For each geographic location, we used Welch’s t test to compare the different-excerpt similarity distributions within and between music traditions. Individual data points (diamonds) correspond to document similarity values that exceed 1.5× the IQR. Black lines spanning two distributions at the top of the figure represent significant t tests relative to the permuted difference thresholds. The long solid and dotted lines depict the 95th percentile and median value of the control narrative distributions and represent estimates of the maximum and average similarity expected between unprompted stories by US college undergraduates, respectively. The values serve as an additional reference point and not as a threshold for significance.
Fig. 3.
Fig. 3.
Comparison of stories prompted by different music excerpts at different geographic locations. For each of the 32 excerpts, we calculated the pairwise cosine similarities between the TF-IDF vectors for narrative documents collected at each geographic location. We excluded same-excerpt comparisons and instead examined different-excerpt similarity based on the music tradition an excerpt belongs to. The nine box-and-whisker plots depict the median value and quantiles of the distribution of different-excerpt similarity values in each comparison between geographic locations. Individual data points (diamonds) correspond to document similarity values that exceed 1.5× the IQR. For each location comparison, we used Welch’s t test to compare the different-excerpt similarity distributions within and between music traditions. Black lines spanning two distributions at the top of the figure represent significant t tests relative to the permuted difference thresholds. The long solid and dotted lines depict the 95th percentile and median value of the control narrative distributions and represent estimates of the maximum and average similarity expected between unprompted stories by US college undergraduates, respectively. The values serve as an additional reference point and not as a threshold for significance.
Fig. 4.
Fig. 4.
Comparison of stories prompted by the same music excerpt at different geographic locations. For each of the 32 excerpts, we calculated the cosine similarities between the corresponding TF-IDF vectors for narrative documents collected at each geographic location. The three box-and-whisker plots depict the median value and quantiles of the distribution of same-excerpt similarity values in each comparison between geographic locations. Individual data points (diamonds) correspond to document similarity values that exceed 1.5× the IQR. The values of the solid lines represent particularly conservative estimates of document similarities corrected for multiple comparisons (short lines = same-sample thresholds; long line = control-sample threshold). The long dotted line corresponds to the median value of the Princeton-Michigan permuted distribution and represents an estimate of the average similarity expected between unprompted stories by US college undergraduates. The long dotted line serves as an additional reference point and not as a threshold for significance.
Fig. 5.
Fig. 5.
Word clouds of nardocs generated in response to a Chinese excerpt (C16) and a Western excerpt (W9). Each cloud depicts the words with the top 30 TF-IDF scores in a nardoc. The size of a word corresponds to the magnitude of its score.

References

    1. Herbert R., Everyday Music Listening: Absorption, Dissociation and Trancing (Ashgate, 2011).
    1. Jakubowski K., “Musical imagery” in The Cambridge Handbook of the Imagination, Abraham A., Ed. (Cambridge, 2020), pp. 187–206.
    1. Margulis E. H., Wong P. C. M., Simchy-Gross R., McAuley J. D., What the music said: Narrative listening across cultures. Palgrave Commun. 5, 146 (2019).
    1. McAuley J. D., Wong P. C. M., Bellaiche L., Margulis E. H., What drives narrative engagement with music? Music Percept. 38, 509–521 (2021).
    1. McAuley J. D., Wong P. C. M., Mamidipaka A., Phillips N., Margulis E. H., Do you hear what I hear? Perceived narrative constitutes a semantic dimension for music. Cognition 212, 104712 (2021). - PubMed

Publication types

LinkOut - more resources