. 2022 Jan 21;13(1):450.
doi: 10.1038/s41467-022-28150-w.

Activation of the plant mevalonate pathway by extracellular ATP

Affiliations

Activation of the plant mevalonate pathway by extracellular ATP

Sung-Hwan Cho et al. Nat Commun. .

Abstract

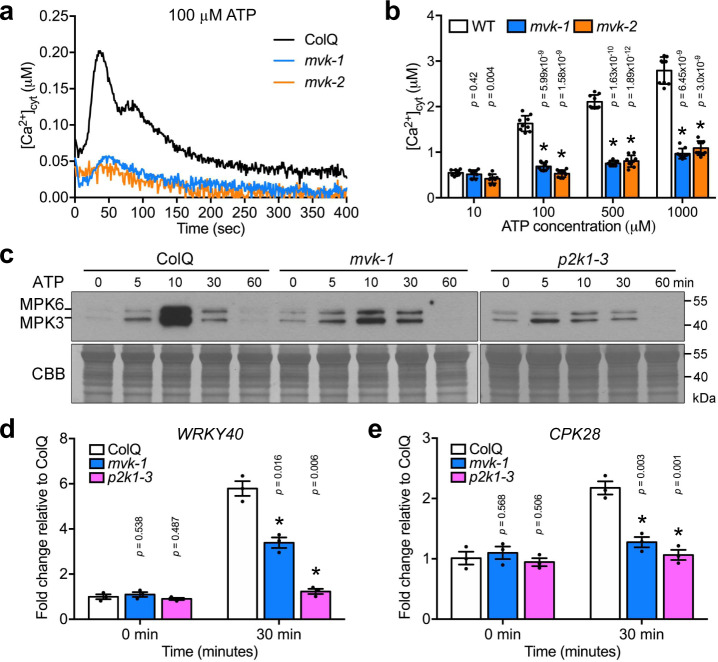
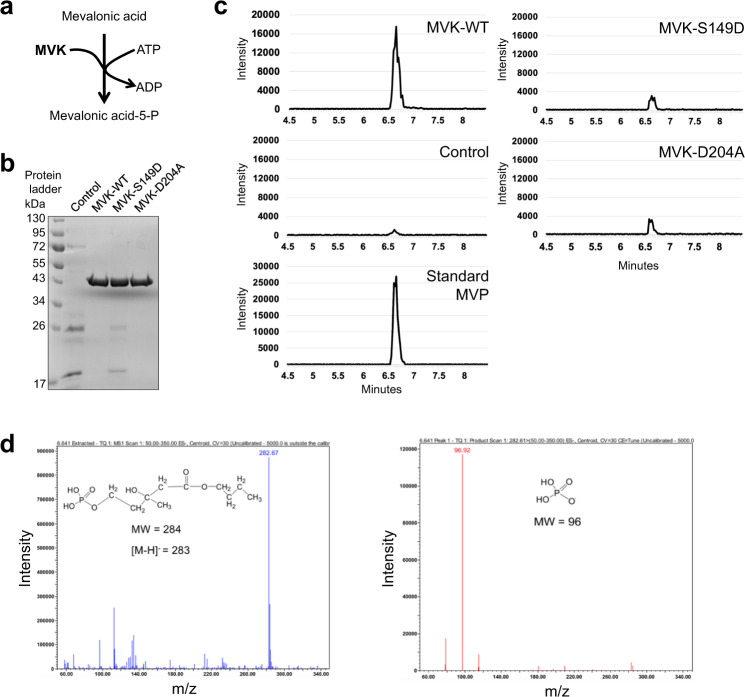
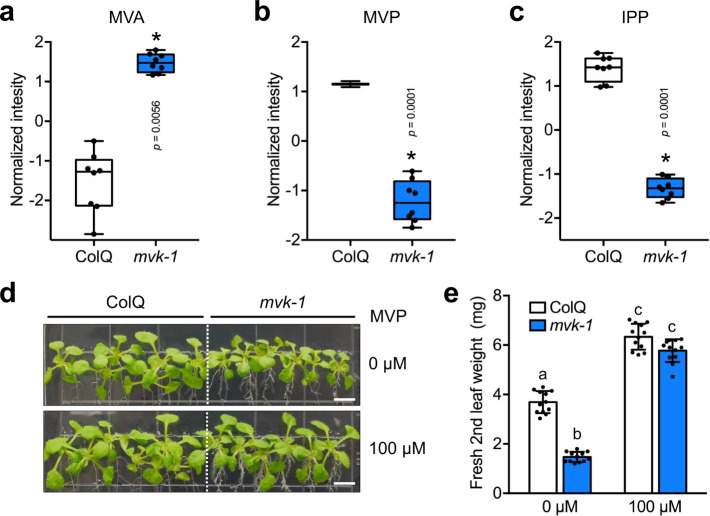
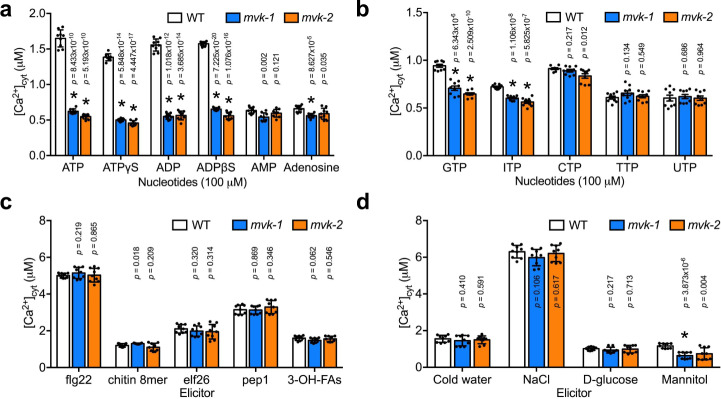
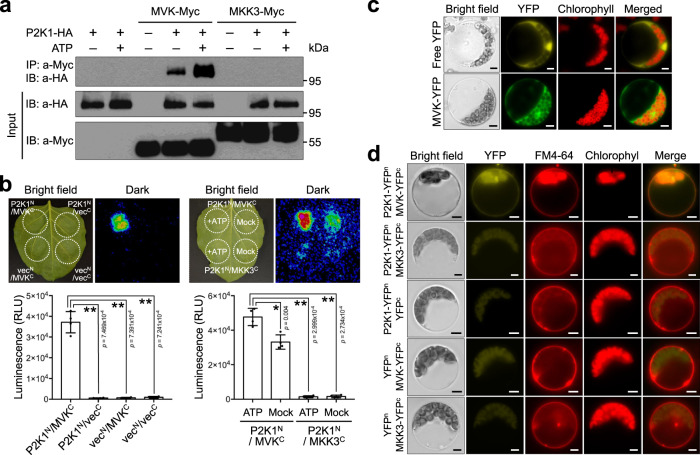
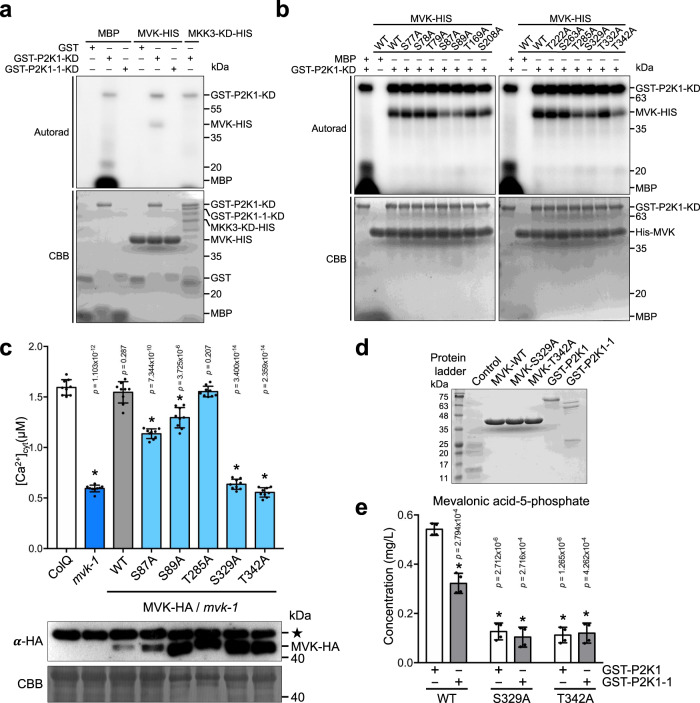
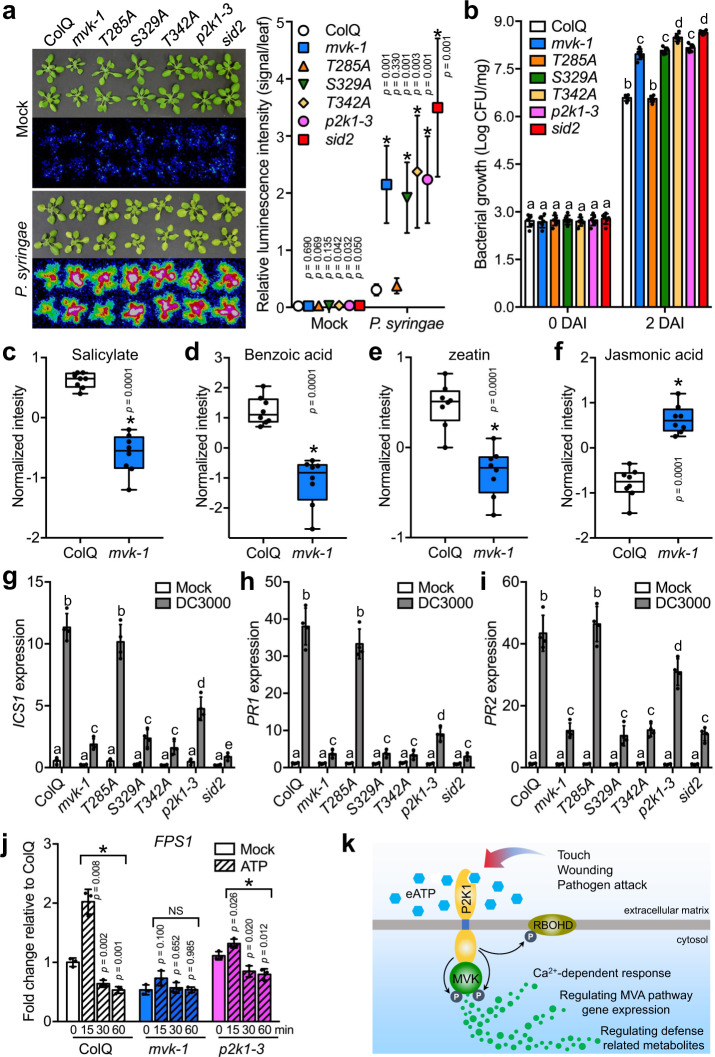
The mevalonate pathway plays a critical role in multiple cellular processes in both animals and plants. In plants, the products of this pathway impact growth and development, as well as the response to environmental stress. A forward genetic screen of Arabidopsis thaliana using Ca2+-imaging identified mevalonate kinase (MVK) as a critical component of plant purinergic signaling. MVK interacts directly with the plant extracellular ATP (eATP) receptor P2K1 and is phosphorylated by P2K1 in response to eATP. Mutation of P2K1-mediated phosphorylation sites in MVK eliminates the ATP-induced cytoplasmic calcium response, MVK enzymatic activity, and suppresses pathogen defense. The data demonstrate that the plasma membrane associated P2K1 directly impacts plant cellular metabolism by phosphorylation of MVK, a key enzyme in the mevalonate pathway. The results underline the importance of purinergic signaling in plants and the ability of eATP to influence the activity of a key metabolite pathway with global effects on plant metabolism.


Conflict of interest statement

The authors declare no competing interests.

Figures

Fig. 1
Fig. 1. mvk-1 mutants show lower response to extracellular ATP.
a The kinetics of the cytoplasmic calcium response to 100 μM ATP for 400 sec in ColQ, mvk-1, and mvk-2 (mvk-2-4 line) plants. b The bar graph shows the integrated calcium response to 10, 100, 500, and 1000 μM of ATP for 400 sec in ColQ, mvk-1, and mvk-2 (mvk-2-4 line) mutant plants. Asterisks indicate significant differences between ColQ and mvk mutants plants (means ± SEM, n = 9 seedlings, *P < 0.001, two-sided Student’s t test). c The mvk-1 mutant plant exhibits reduced phosphorylation of MPK3 and MPK6 in response to 100 μM of ATP compared to wild-type over a time-course from 0 to 60 min. Phosphorylation of MPK3 and MPK6 was detected using antibody against phospho-p44/p42 mitogen-activated protein kinase. p2k1-3 mutant plants were used as a negative control. The coomassie brilliant blue (CBB) staining (bottom panel) showed equal loading. d, e Relative expression of WKRY40 and CPK28 in 10-day-old ColQ, mvk-1, and p2k1-3 whole seedlings treated with 100 μM ATP for 30 min was performed using qRT-PCR analysis. Gene expression data were normalized using the SAND reference gene. Bar graphs represent means of three pooled biological replicates. Asterisks indicate the significant differences compared to ColQ at the same time points (*P < 0.05, two-sided Student’s t test). All above experiments were repeated three times with similar results.
Fig. 2
Fig. 2. Enzymatic activities of recombinant mevalonate kinase (MVK), and identification of reaction products.
a Schematic representation of the conversion of mevalonic acid (MVA) into mevalonic acid-5-phosphate (MVP) (consuming ATP). b SDS-PAGE gel showing His-tag purified proteins expressed in E. coli cells expressing His-tagged MVK-WT, and two dead-versions of MVK (MVK-S149D, and MVK-D204A). As control, proteins were purified from cells carrying empty vector. The protein was measured by Coomassie brilliant blue staining. Experiment was repeated three times with similar results. c The ion chromatogram of MVP butyl ester in the samples (MVK-WT, control, MVK-S149D, MVK-D204A, and Standard MVP) quantified by LC-MS/MS analysis (m/z 283→96). MVP+ MVK-WT peak (~6.6 min) is detected in MVK reaction but not in control (empty vector control cells), and dead-versions of MVK. d The ion spectra of the molecular ion (m/z 283) (left) and product ions (right) for the analysis of the MVP butyl ester ionized in negative ion mode (ES).
Fig. 3
Fig. 3. mvk-1 mutant plants show reduced mevalonic acid-5-phosphate (MVP) levels.
Exogenous application of MVP partially restores the altered mvk-1 mutant phenotype. ac Box-and-whisker plots of intermediate compounds in MVA pathway showing their relative abundances. ColQ and mvk-1 mutant root extracts were analyzed with a high-resolution mass spectrometer (HRMS) Orbitrap Velos (Thermo Fisher Scientific) coupled to a Thermo Vanquish HPLC (High Pressure Liquid Chromatographer; Thermo Fisher Scientific). MVA, Mevalonic acid; MVP, Mevalonic acid-5-phosphate; IPP, isopentenyl diphosphate. Asterisks indicate significant differences between ColQ and mvk-1 (means ± SEM, n = 8 biological replicates, *P < 0.05, two-sided Student’s t test). Box-and-whisker plots show max and min, 25–75th percentiles (box), and median (center line). Experiment was repeated three times with similar results. d 16-day-old ColQ and mvk-1 mutant seedlings grown on medium without or with 100 µM mevalonic acid-5-phosphate (MVP). Scale bars: 0.5 cm. e Fresh second leaf weight of 16-day-old plants (n = 21 leaves for ColQ and n = 24 leaves for mvk-1). Data represent mean ± SEM from independent experiments. Means with different letters are significantly different (P < 0.05). P values indicate significance relative to ColQ with mock treatment and were determined by one-sided ANOVA with multiple comparisons and adjusted using a Duncan post hoc test. Experiment was repeated three times with similar results.
Fig. 4
Fig. 4. The mvk mutants show defects in the calcium response to various nucleotides.
a Calcium responses to adenine nucleotides and non-hydrolysable derivatives in ColQ, mvk-1, and mvk-2 (mvk-2-4 line) plants. b Calcium responses to other nucleotides in ColQ, mvk-1, and mvk-2 (mvk-2-4 line) plants. c, d Biotic (100 nM of flg22, chitin, elf26, and pep1; 5 µM 3-OH-FAs) and abiotic stress reagents (ice-chilled water, 300 mM NaCl, 5% D-glucose, and 300 mM mannitol) induced calcium responses in mvk mutants. Asterisks indicate significant differences between ColQ and mvk mutants plants. All data represented as means ± SEM, n = 9 seedlings (*P < 0.001, two-sided Student t test). All above experiments were repeated three times with similar results.
Fig. 5
Fig. 5. MVK interacts with P2K1 in vivo.
a Co-immunoprecipitation of P2K1 and MVK proteins. The indicated constructs were transiently co-expressed in Nicotiana benthamiana leaves infiltrated with either 200 μM ATP for 30 min (+) or 2 mM MES (pH 5.7) as a control (−). Full-length MKK3 was used as a negative control. Co-IP was performed using anti-HA and anti-Myc antibodies. b Split-luciferase assay image of N. benthamiana leaves co-infiltrated with Agrobacterium strains containing P2K1N/MVKC, P2K1N/vecC, vecN/MVKC, vecN/vecC, and P2K1N/MKK3C (Negative control). Dotted circles indicate leaf panels that were infiltrated with Agrobacterium carrying the respective constructs. +ATP, Leaves infiltrated with 200 µM ATP; Mock, Leaves infiltrated with 2 mM MES (pH 5.7). Quantification of relative luminescence unit (RLU) intensity of P2K1N/MVKC. Asterisks indicate significantly different from P2K1N/vecC, vecN/MVKC, and vecN/vecC (left bottom, n = 4 leaves; **P < 0.01, two-sided Student’s t test) or negative control P2K1N/MKK3C (right bottom, n = 4 leaves; *P < 0.01, **P < 0.001, two-sided Student’s t test). c Subcellular localization of MVK in Arabidopsis protoplast. Arabidopsis MVK fused to YFP shows cytosolic localization. Free YFP was used as a control. Scale bars: 5 µm. d Biomolecular fluorescence complementation (BiFC) assay in Arabidopsis protoplasts. The indicated constructs were transiently expressed in wild-type protoplasts and the BiFC assay was performed. See also the quantification of relative fluorescence intensity shown in Supplementary Fig. 8. FM4-64 was applied to stain the plant plasma membrane. MKK3 was used as a negative control. Scale bars: 5 µm. All above experiments were performed and analyzed three times with similar results.
Fig. 6
Fig. 6. P2K1 phosphorylates MVK in vitro. MVK residues S329 and T342 are required for ATP-triggered calcium production.
a P2K1 phosphorylates MVK. Purified MVK-HIS recombinant protein was incubated with GST-P2K1-KD kinase domain, GST-P2K1-1-KD (kinase dead), or GST in an in vitro kinase assay. Autophosphorylation and trans-phosphorylation were measured by incorporation of γ-[32 P]-ATP. MBP and MKK3-KD-HIS kinase domain were used as positive and negative controls, respectively. Protein loading was visualized by Coomassie brilliant blue (CBB) staining. b P2K1 phosphorylates MVK and site-directed mutation of P2K1-mediated MVK phosphor sites. Purified MVK-HIS recombinant protein was incubated with GST-P2K1-KD kinase domain in an in vitro kinase assay. Autophosphorylation and trans-phosphorylation were measured by incorporation of γ-[32 P]-ATP. MBP was used as positive control. Protein loading was visualized by Coomassie brilliant blue (CBB) staining. c MVK phosphor sites are required for ATP-triggered calcium production. The indicated constructs were expressed in the mvk-1 mutant background and treated with 100 μM ATP. All data represented as means ± SEM, n = 9 seedlings (*P < 0.05, two-sided Student’s t test). See also the calcium kinetics shown in Supplementary Fig. 9b. Total MVK-HA protein was detected by anti-HA immunoblot. Star indicates nonspecific band which was used as a loading control. d Recombinant MVK and P2K1 proteins. SDS-PAGE of HIS and GST tagged proteins isolated from E. coli cells expressing recombinant control (empty vector), MVK-WT-HIS, MVK-S329A-HIS, MVK-T342A-HIS, GST-P2K1-KD, and GST-P2K1-1-KD. Protein loading was visualized by coomassie brilliant blue staining. e Enzymatic activity of P2K1 and MVK-WT, MVK-S329A, and MVK-T342A proteins measured by UPLC-MS/MS. Data are shown as mean ± SEM. Asterisks indicate significant differences between WT and MVK proteins (S329A and T342A) with GST-P2K1 or GST-P2K1-1. (n = 4 biological replicates, *P < 0.01, two-sided Student’s t test). All above experiments were performed and analyzed three times with similar results.
Fig. 7
Fig. 7. P2K1 mediated MVK phosphorylation at S329 and T342 plays a critical role in plant innate immunity. Altered ICS1, PR1, PR2, and FPS1 gene expression and metabolites in mvk-1 mutant plants.
a, b ColQ, p2k1-3 and sid2 were used as controls in comparison to mvk-1 mutant plants, as well as complemented mvk-1 plants expressing the MVK-T285A, MVK-S329A, and MVK-T342A mutant protein. 3-week-old plants were flood inoculated with a P. syringae DC3000 lux suspension (OD600 = 0.002) containing 0.025% (v/v) Silwet L-77. a At two day after inoculation (DAI), bacteria invasion was detected by CCD camera (left panel). Quantification of relative luminescence intensity (signal/leaf) of infected leaf from P. syringae DC3000 lux (right panel). Values represent the mean ± SD. The asterisks indicate statistical significance (n = 6 seedlings, *P < 0.01, two-sided Student’s t test). b bacterial colonization was determined by plate counting (n = 12). Data represent mean ± SEM from independent experiments. Two-way ANOVA with Tukey’s multiple comparisons analysis were calculated by GraphPad Prism 7. Means with different letters are significantly different (P < 0.05). cf Box-and-whisker plots of significant metabolites showing their relative abundances in ColQ and mvk-1 plants. Root extracts were analyzed with a high-resolution mass spectrometer (HRMS) Orbitrap Velos coupled to a Thermo Vanquish HPLC. Asterisks indicate significant differences between ColQ and mvk-1 (means ± SEM, n = 8 biological replicates, *P < 0.05, two-sided Student’s t test). Box-and-whisker plots show max and min, 25–75th percentiles (box), and median (center line). gi ICS1, PR1, and PR2 genes expression pattern in response to P. syringae DC3000. 3-week-old ColQ, mvk-1, T285A, S329A, T342A, p2k1-3, and sid2 plants were treated with 2 mM MES (mock) and P. syringae DC3000 (OD600 = 0.002) for 24 h, then qRT-PCR analysis was performed. Expression of ICS1, PR1, and PR2 was normalized using SAND reference gene. The results are relative to expression levels of mock treated plants. Two-way ANOVA analysis was calculated by GraphPad Prism 7. Means with different letters are significantly different (n = 4 biological replicates, P < 0.0001). j FPS1 gene expression pattern in response to ATP. 10-day-old ColQ, mvk-1, and p2k1-3 whole seedlings were treated with 2 mM MES (mock) and 100 μM ATP for 0, 15, 30, and 60 min, then qRT-PCR analysis was performed. Expression of FPS1 was normalized using SAND reference gene. The results are relative to expression levels of ColQ mock treated plants (set as 1). Data represent mean ± SEM from independent experiments. The bar graphs are means of three biological repeats. Asterisks indicate the significant differences compared to each mock (*P < 0.05; NS, not significant; two-sided Student’s t test). k Model illustrating the proposed role of MVK in the extracellular ATP signaling pathway. When extracellular ATP bind to P2K1 receptor, MVK is phosphorylated and activated by P2K1 and in turn regulates Ca2+-dependent response, MVA pathway gene expression, and defense related metabolites. RBOHD is also phosphorylated by P2K1. All above experiments were repeated three times with similar results.

Similar articles

Cited by

References

    1. Istvan ES, Deisenhofer J. Structural mechanism for statin inhibition of HMG-CoA reductase. Science. 2001;292:1160–1164. - PubMed
    1. Goldstein JL, Brown MS. Regulation of the mevalonate pathway. Nature. 1990;343:425–430. - PubMed
    1. Buhaescu I, Izzedine H. Mevalonate pathway: a review of clinical and therapeutical implications. Clin. Biochem. 2007;40:575–584. - PubMed
    1. van der Meer JW, Simon A. The challenge of autoinflammatory syndromes: with an emphasis on hyper-IgD syndrome. Rheumatology (Oxford) 2016;55:ii23–ii29. - PubMed
    1. Akula MK, et al. Control of the innate immune response by the mevalonate pathway. Nat. Immunol. 2016;17:922–929. - PMC - PubMed

Publication types

MeSH terms