. 2022 Jan 21;12(1):1169.
doi: 10.1038/s41598-022-05175-1.

Influence of methane seepage on isotopic signatures in living deep-sea benthic foraminifera, 79° N

Affiliations

Influence of methane seepage on isotopic signatures in living deep-sea benthic foraminifera, 79° N

Katarzyna Melaniuk et al. Sci Rep. .

Abstract

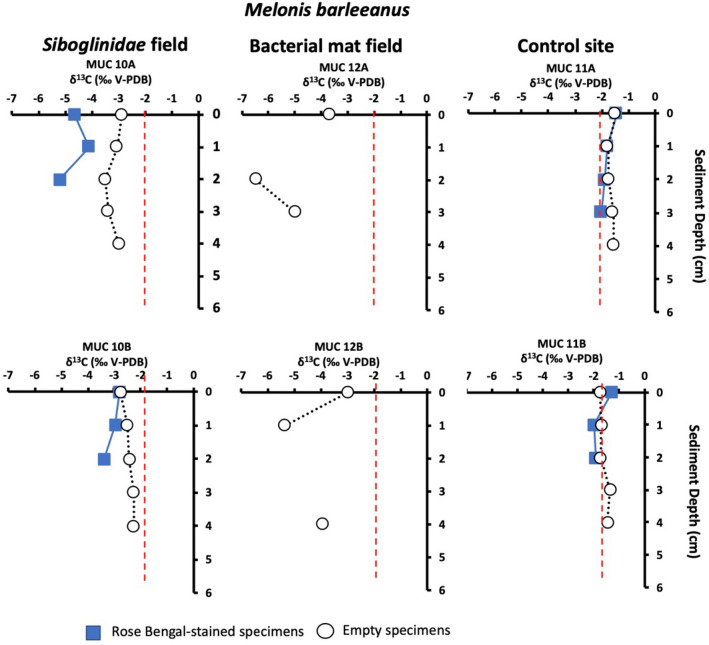
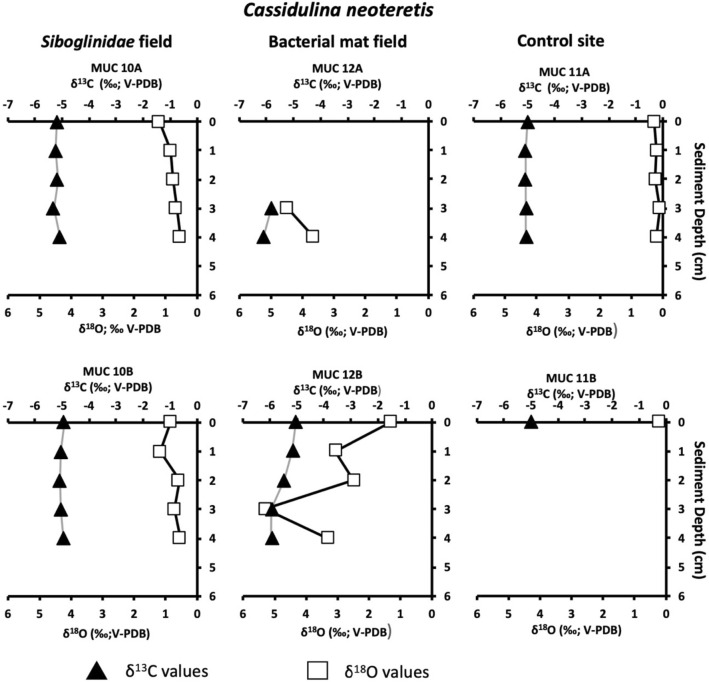
Fossil benthic foraminifera are used to trace past methane release linked to climate change. However, it is still debated whether isotopic signatures of living foraminifera from methane-charged sediments reflect incorporation of methane-derived carbon. A deeper understanding of isotopic signatures of living benthic foraminifera from methane-rich environments will help to improve reconstructions of methane release in the past and better predict the impact of future climate warming on methane seepage. Here, we present isotopic signatures (δ13C and δ18O) of foraminiferal calcite together with biogeochemical data from Arctic seep environments from c. 1200 m water depth, Vestnesa Ridge, 79° N, Fram Strait. Lowest δ13C values were recorded in shells of Melonis barleeanus, - 5.2‰ in live specimens and - 6.5‰ in empty shells, from sediments dominated by aerobic (MOx) and anaerobic oxidation of methane (AOM), respectively. Our data indicate that foraminifera actively incorporate methane-derived carbon when living in sediments with moderate seepage activity, while in sediments with high seepage activity the poisonous sulfidic environment leads to death of the foraminifera and an overgrowth of their empty shells by methane-derived authigenic carbonates. We propose that the incorporation of methane-derived carbon in living foraminifera occurs via feeding on methanotrophic bacteria and/or incorporation of ambient dissolved inorganic carbon.


Conflict of interest statement

The authors declare no competing interests.

Figures

Figure 1
Figure 1
(a) Svalbard margin in the Eastern Fram Strait (bathymetry from Jakobsson et al.). (b) Detail of Vestnesa Ridge (modified from Bünz et al.). Red dots indicate multicorer locations: Siboglinidae field (MUC 10), bacterial mats field (MUC 12), and control site (MUC 11). This figure is original, made using ArcMap v10.6. https://www.esri.com/en-us/arcgis/products/arcgis-desktop/overview".
Figure 2
Figure 2
Biogeochemical data of sediment from MUC 10 (Siboglinidae field, ad) and MUC 12 (bacterial mat field, eh). (a,e) Concentrations of pore-water total alkalinity (TA, open squares), and sulfide (solid triangles). (b,f) Concentrations of pore-water sulfate (SO42−, solid circles) and sediment methane (CH4, open circles). Note the different x-axes for methane. (c,g) Methane oxidation rates (CH4 OX, symbols represent three replicates). Note that c includes an insert that focusses on rates < 5 nmol cm−3 d−1. (d,h) Sulfate reduction rates (SR, symbols represent three replicates).
Figure 3
Figure 3
Carbon isotope values (δ13C) of Melonis barleeanus in sediment from the Siboglinidae field (MUC 10A and MUC 10B), bacterial mat field (MUC 12A and MUC 12B), and control site (MUC 11A and MUC 11B). The vertical red line indicates the δ13C minimum value for non-seep conditions.
Figure 4
Figure 4
Carbon isotope values (δ13C) of Cassidulina neoteretis in sediment from the Siboglinidae field (MUC 10A and MUC 10B), bacterial mat field (MUC 12A and MUC 12B), and control site (MUC 11A and MUC 11B). The vertical red line indicates the δ13C minimum value for conditions.
Figure 5
Figure 5
Carbon isotope values (δ13C) of Cibicidoides wuellerstorfi from the Siboglinidae field (MUC 10 and MUC 10B), bacterial mat field (MUC 12A and MUC 12B), and control site (MUC 11A and MUC 11B). The vertical red line indicates the δ13C minimum value for non-seep conditions.
Figure 6
Figure 6
Scanning electron microscopy (SEM) micrographs of N. pachyderma from Siboglinidae field MUC 10B 4–5 cm depth (a,b) and bacterial mat field MUC 12B 3–4 cm depth (c,d). Micrographs (c) and (d) show authigenic overgrowth on the outer surface of the test, while (a,b), show a pristine shell with no coating.
Figure 7
Figure 7
Oxygen isotope values (δ18O) of empty tests of Cassidulina neoteretis in sediment from the Siboglinidae field (MUC 10A and MUC 10B), bacterial mat field (MUC 12A and MUC 12B), and control site (MUC 11A and MUC 11B).
Figure 8
Figure 8
Rose Bengal stained Cibicidoides wuellerstorfi attached to a Siboglinidae tube; Siboglinidae field MUC 10A. Photo: K. Sztybor.

References

    1. Stocker, T. F. et al. (eds.). IPCC, 2013: Climate Change 2013: The Physical Science Basis. Contribution of Working Group I to the Fifth Assessment Report of the Intergovernmental Panel on Climate Change 1535 (Cambridge University Press, 2013).
    1. Maslin M, et al. Gas hydrates: Past and future geohazard? Philos. Trans. R. Soc. A. 2010;368:2369–2393. doi: 10.1098/rsta.2010.0065. - DOI - PubMed
    1. Ruppel CD, Kessler JD. The interaction of climate change and methane hydrates. Rev. Geophys. 2017;55:126–168. doi: 10.1002/2016RG000534. - DOI
    1. Archer D, Buffett B, Brovkin V. Ocean methane hydrates as a slow tipping point in the global carbon cycle. PNAS. 2009;106:20596–20601. doi: 10.1073/pnas.0800885105. - DOI - PMC - PubMed
    1. Biastoch A, et al. Rising Arctic Ocean temperatures cause gas hydrate destabilization and ocean acidification. Geophys. Res. Lett. 2011 doi: 10.1029/2011GL047222. - DOI

Publication types