. 2022 Jan;27(1):016501.
doi: 10.1117/1.JBO.27.1.016501.

Effects of shell-integrated Sudan Black dye on the acoustic activity and ultrasound imaging properties of lipid-shelled nanoscale ultrasound contrast agents

Affiliations

Effects of shell-integrated Sudan Black dye on the acoustic activity and ultrasound imaging properties of lipid-shelled nanoscale ultrasound contrast agents

Dana Wegierak et al. J Biomed Opt. 2022 Jan.

Abstract

Significance: An effective contrast agent for concurrent multimodal photoacoustic (PA) and ultrasound (US) imaging must have both high optical absorption and high echogenicity. Integrating a highly absorbing dye into the lipid shell of gas core nanobubbles (NBs) adds PA contrast to existing US contrast agents but may impact agent ultrasonic response.

Aim: We report on the development and ultrasonic characterization of lipid-shell stabilized C3F8 NBs with integrated Sudan Black (SB) B dye in the shell as dual-modal PA-US contrast agents.

Approach: Perfluoropropane NBs stabilized with a lipid shell including increasing concentrations of SB B dye were formulated by amalgamation (SBNBs). Physical properties of SBNBs were characterized using resonant mass measurement, transmission electron microscopy and pendant drop tensiometry. Concentrated bubble solutions were imaged for 8 min to assess signal decay. Diluted bubble solutions were stimulated by a focused transducer to determine the response of individual NBs to long cycle (30 cycle) US. For assessment of simultaneous multimodal contrast, bulk populations of SBNBs were imaged using a PA and US imaging platform.

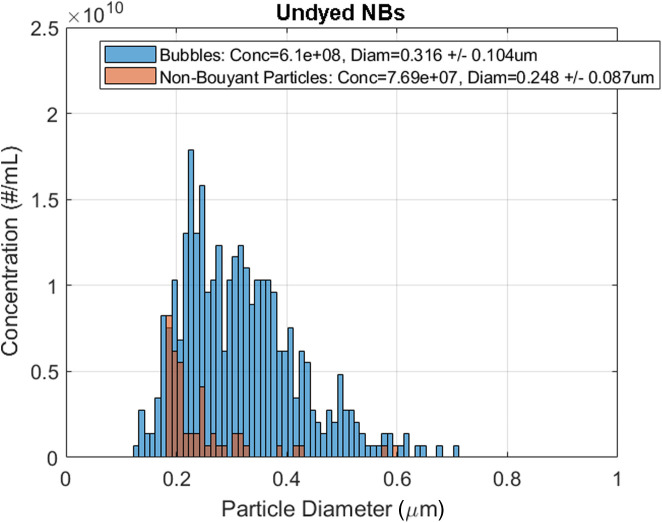
Results: We produced high agent yield (∼1011) with a mean diameter of ∼200 to 300 nm depending on SB loading. A 40% decrease in bubble yield was measured for solutions with 0.3 and 0.4 mg / ml SB. The addition of SB to the shell did not substantially affect NB size despite an increase in surface tension by up to 8 mN / m. The bubble decay rate increased after prolonged exposure (8 min) by dyed bubbles in comparison to their undyed counterparts (2.5-fold). SB in bubble shells increased gas exchange across the shell for long cycle US. PA imaging of these agents showed an increase in power (up to 10 dB) with increasing dye.

Conclusions: We added PA contrast function to NBs. The addition of SB increased gas exchange across the NB shell. This has important implications in their use as multimodal agents.

Keywords: contrast agents; multimodal imaging; nanobubbles; photoacoustic imaging; rectified diffusion; ultrasound imaging.


Figures

Fig. 1
Fig. 1
(a) Two-dimensional chemical structure of SB B and (b) optical absorption spectrum of SB B dye in different solvents (reproduced with permission).
Fig. 2
Fig. 2
Sample size distribution of NBs and nonbuoyant particles prepared from lipid solution without SB before pore filtration as measured using the Archimedes RMM system.
Fig. 3
Fig. 3
(a) Inverse bubble stability setup featuring a linear transducer (Toshiba, Tochigi-Ken, Japan, 6-MHz transmit, 12-MHz receive, 240 kPa peak negative pressure, M.I, 0.1), and 1% agarose mold with three narrow channels (3×5×6  mm) separated 4 mm apart; (b) US images from the inverted setup; Image of 1 in 100 diluted 0.5  mg/ml SB B NBs in PBS; top of image corresponds to the top of the transducer, bottom of image corresponds to air-exposed top of channel; sample ROI indicated by yellow box; figure created with BioRender.com.
Fig. 4
Fig. 4
Submerged multimodal US/PA experimental setup; a 10% polyacrylamide phantom with 6 hollow channels (1-mm diam; 1-mm separation) housed in a clear holder to block vessel ends; Vevo LAZR 2100 system with 256-element linear array LZ250 transducer (21 MHz central frequency; 13 to 24 MHz bandwidth) and common US/PA focus at 11-mm imaging depth. Figure created with BioRender.com.
Fig. 5
Fig. 5
Representative transmission electron microscopy images for lipid-shelled NBs with differing SB B content (a) 0 mg; (b) 0.3; and (c) 0.5  mg/ml in the lipid shell solution.
Fig. 6
Fig. 6
(a) SBNB concentration and (b) diameter from RMM (n=3) differences between the average bubble diameter for varying bubble formulations were also determined to be not significant.
Fig. 7
Fig. 7
Raw data for pendant drop tensiometry. Profiles of pendant drops of (a) PGG solution and PGG solution with (b) 0.1; (c) 0.2; (d) 0.3; (e) 0.4; (f) 0.5  mg/ml added SB B, respectively, for lipid-shell stabilized NBs; (scale bar=0.5251  mm).
Fig. 8
Fig. 8
Surface tension as measured from bulk droplets of lipid solution containing varying contributions of SB B dissolved in the lipid. (n=20; bars represent standard deviation).
Fig. 9
Fig. 9
(a) US power decay normalized to maximum power of time series (Toshiba, Tochigi-Ken, Japan, 6-MHz transmit, 12 MHz receive, 240 kPa peak negative pressure, M.I, 0.1) for 1 in 100 dilution NBs in PBS with differing concentrations of SB B in the lipid shell. (b) Bubble decay rates after 8 min continuous US stimulation for lipid-stabilized with varying concentrations of SB B dye in the lipid shell.
Fig. 10
Fig. 10
(a)–(c) Single bubble signal count as a function of acoustic pressure. (n=3) and SB contribution in lipid-shell. (d)–(f) Average contribution of signal types to total signal count summed over all pressures (n=3); average total number of signals = 511 (0  mg/ml), 261 (0.2  mg/ml), and 246 (0.4  mg/ml).
Fig. 11
Fig. 11
Representative PA(top)/US (bottom) images with channels containing 1:29 dilution of 0 mg, 0.1 mg, 0.2 mg, 0.3 mg, 0.4 mg, 0.5 mg Sudan Black from left to right; average PA (center; n=9) and US (right; n=9) signal from SBNBs.

References

    1. Beard P., “Biomedical photoacoustic imaging,” Interface Focus 1(4), 602–631 (2011).10.1098/rsfs.2011.0028 - DOI - PMC - PubMed
    1. Wilson K. E., Wang T. Y., Willmann J. K., “Acoustic and photoacoustic molecular imaging of cancer,” J. Nucl. Med. 54(11), 1851–1854 (2013).JNMEAQ10.2967/jnumed.112.115568 - DOI - PMC - PubMed
    1. Kim C., et al. , “Multifunctional microbubbles and nanobubbles for photoacoustic and ultrasound imaging,” J. Biomed. Opt. 15(1), 010510 (2010).JBOPFO10.1117/1.3302808 - DOI - PMC - PubMed
    1. Frinking P., et al. , “Three decades of ultrasound contrast agents: a review of the past, present and future improvements,” Ultrasound Med. Biol. 46(4), 892–908 (2020).USMBA310.1016/j.ultrasmedbio.2019.12.008 - DOI - PubMed
    1. Szabo T. L., Diagnostic Ultrasound Imaging: Inside Out, Elsevier Academic Press, San Diego, California: (2004).

Publication types