. 2022 Jan;11(1):e12181.
doi: 10.1002/jev2.12181.

Nephron mass determines the excretion rate of urinary extracellular vesicles

Affiliations

Nephron mass determines the excretion rate of urinary extracellular vesicles

Charles J Blijdorp et al. J Extracell Vesicles. 2022 Jan.

Abstract

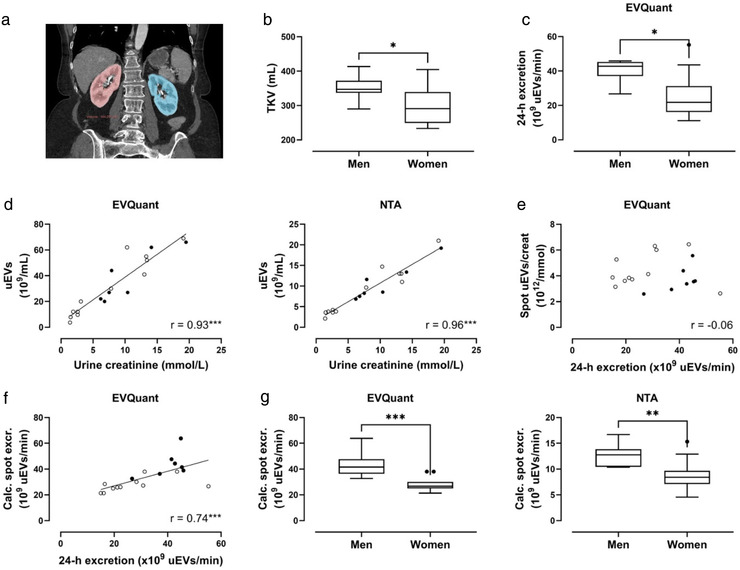
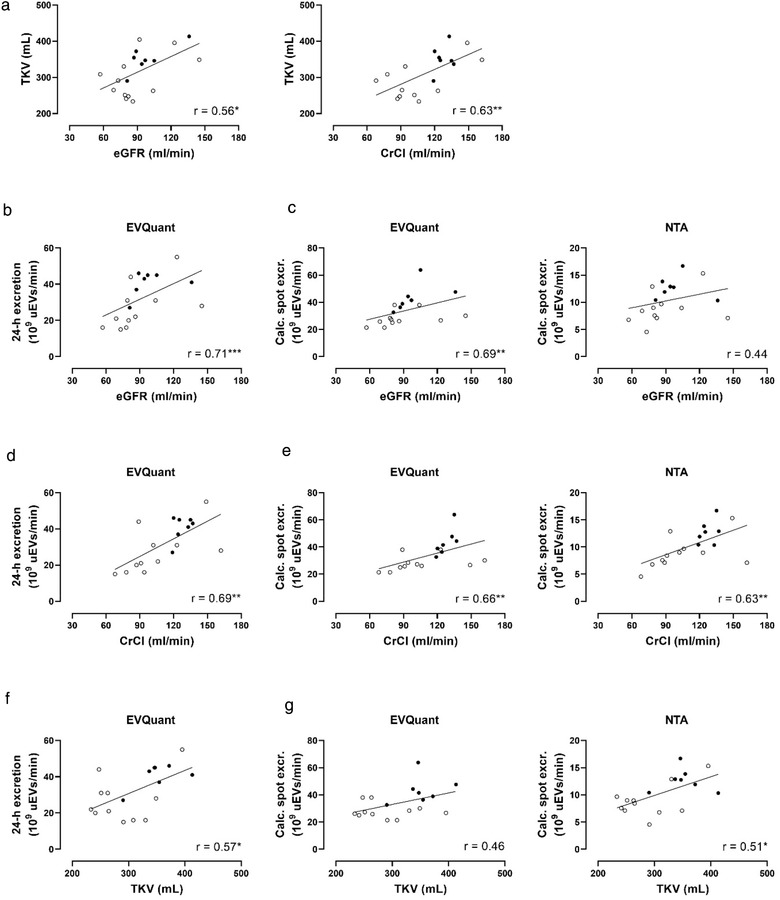
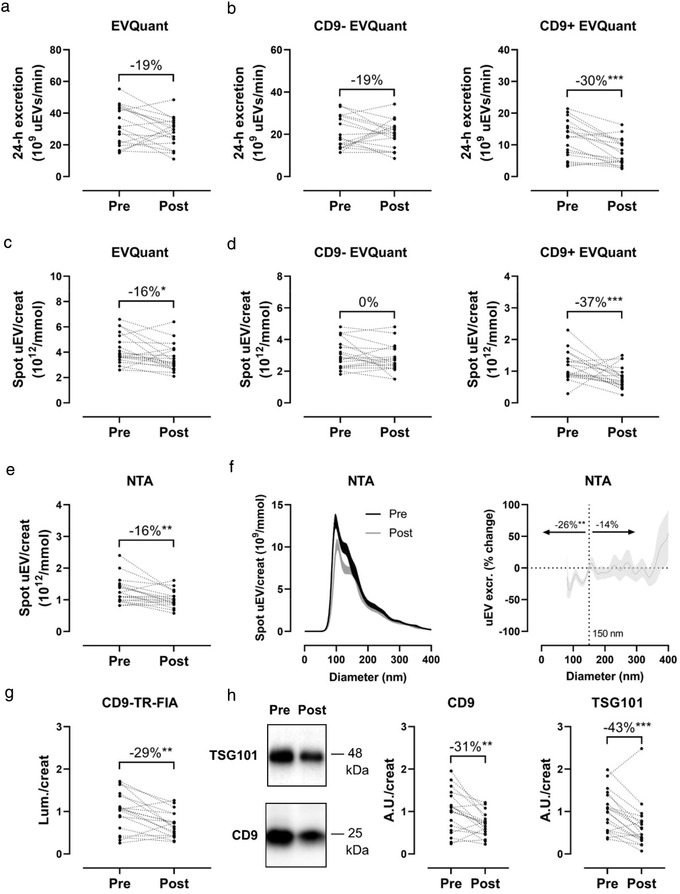
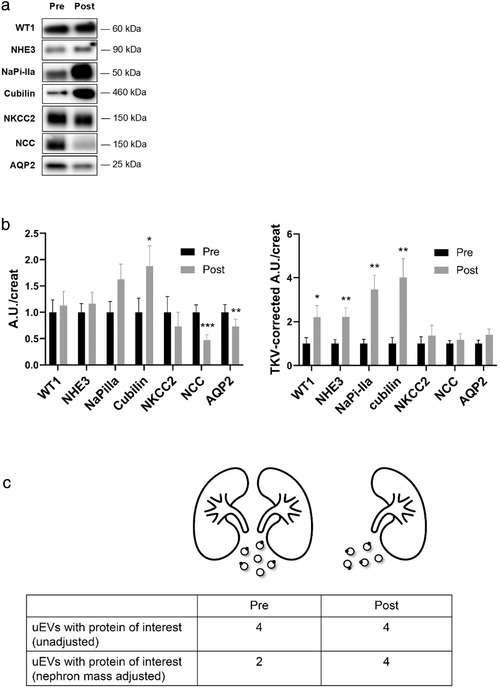
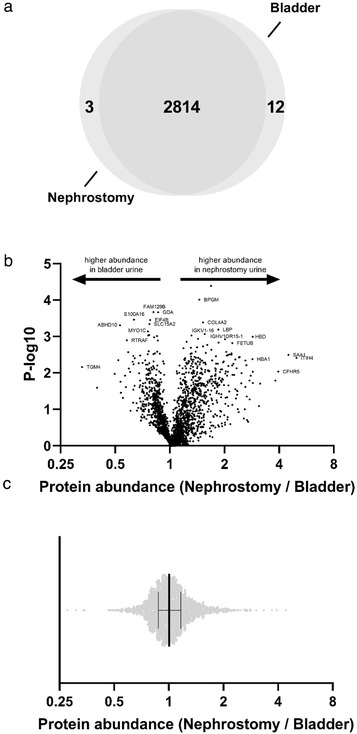
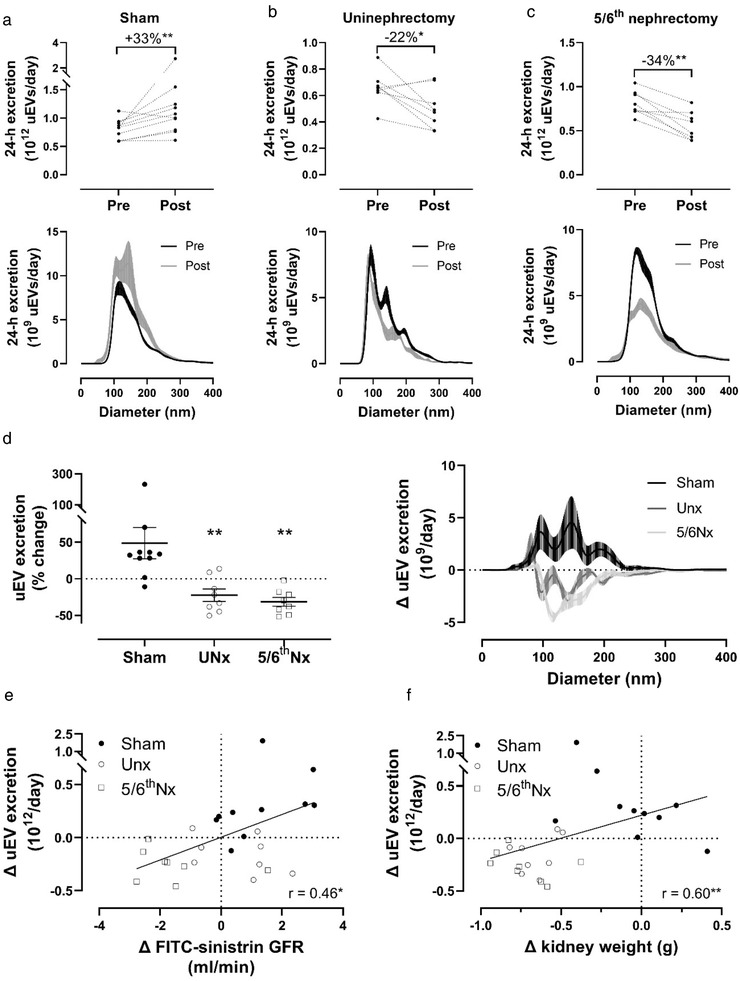
Urinary extracellular vesicles (uEVs) are emerging as non-invasive biomarkers for various kidney diseases, but it is unknown how differences in nephron mass impact uEV excretion. To address this, uEV excretion was measured before and after human kidney donor nephrectomy and rat nephrectomy. In male and female donors, uEVs were quantified in cell-free spot and 24-h urine samples using nanoparticle tracking analysis (NTA), EVQuant, and CD9-time-resolved fluorescence immunoassay. Female donors had significantly lower total kidney volume (TKV) and excreted 49% fewer uEVs than male donors. uEV excretion correlated positively with estimated glomerular filtration rate (eGFR), creatinine clearance, and TKV (R's between 0.6 and 0.7). uEV excretion rate could also be predicted from spot urines after multiplying spot uEV/creatinine by 24-h urine creatinine. Donor nephrectomy reduced eGFR by 36% ± 10%, but the excretion of uEVs by only 16% (CD9+ uEVs -37%, CD9- uEVs no decrease). Donor nephrectomy increased the podocyte marker WT-1 and the proximal tubule markers NHE3, NaPi-IIa, and cubilin in uEVs two- to four-fold when correcting for the nephrectomy. In rats, the changes in GFR and kidney weight correlated with the changes in uEV excretion rate (R = 0.46 and 0.60, P < 0.01). Furthermore, the estimated degree of hypertrophy matched the change in uEV excretion rate (1.4- to 1.5-fold after uninephrectomy and four-fold after 5/6th nephrectomy). Taken together, our data show that uEV excretion depends on nephron mass, and that nephrectomy reduces uEV excretion less than expected based on nephron loss due to compensatory hypertrophy. The major implication of our findings is that a measure for nephron mass or uEV excretion rate should be included when comparing uEV biomarkers between individuals.

Keywords: creatinine; excretion rate; exosomes; kidney; kidney function; nephrectomy; normalization; quantification.


Figures

FIGURE 1
FIGURE 1
Total kidney volume and urinary extracellular vesicle (uEV) excretion in males and females. (a) Example of total kidney volume determination by segmentation in a computed tomography (CT) image of the kidneys (right kidney red, left kidney blue); (b) Comparison of total kidney volume (TKV) between men and women; (c) uEV excretion in men versus women measured by EVQuant in 24‐h urine; (d) Pearson correlations of urine creatinine versus uEV concentration in men (●) and women (○), measured by EVQuant (left panel) and nanoparticle tracking analysis (NTA, right panel); (e) Spearman correlation of 24‐h uEV excretion versus spot uEV/creatinine measured by EVQuant; (f) Spearman correlation of 24‐h uEV excretion versus calculated spot uEV excretion (spot uEV/creatinine * 24‐h urine creatinine) measured by EVQuant; (g) Calculated spot uEV excretion in men versus women measured by EVQuant (left panel) and NTA (right panel). Box plots are Tukey plots. Men are represented by ● and women by ○; *p ≤ 0.05, **< 0.01, ***< 0.001
FIGURE 2
FIGURE 2
Correlations between total kidney volume, kidney function, and urinary extracellular vesicle (uEV) excretion. (a) Pearson correlations of total kidney volume (TKV) with estimated glomerular filtration rate (eGFR, corrected for body surface area), and creatinine clearance (CrCl); (b) Pearson correlation of 24‐h uEV excretion and eGFR; (c) Spearman correlations of calculated spot uEV excretions (measured by EVQuant or NTA) with eGFR; (d) Spearman correlation of 24‐h uEV excretion and CrCl; (E) Spearman correlations of calculated spot uEV excretions (measured by EVQuant or NTA) with CrCl; (f) Spearman correlation of 24‐h uEV excretion and TKV; (g) Spearman correlations of calculated spot uEV excretions (measured by EVQuant or NTA) with TKV. Men are represented by ● and women by ○; *p ≤ 0.05, **< 0.01, ***< 0.001
FIGURE 3
FIGURE 3
Effect of donor nephrectomy on urinary extracellular vesicle (uEV) excretion. (a) uEV excretion before (Pre) versus after (Post) donor nephrectomy measured by EVQuant in 24‐h urine; (b) Urinary excretion of CD9‐ uEVs (left panel) and CD9+ uEVs (right panel) before and after donor nephrectomy measured by EVQuant in 24‐h urine; (c) Spot uEV/creatinine before and after donor nephrectomy measured by EVQuant; (d) Spot uEV/creatinine ratios of CD9‐ (left panel) and CD9+ uEVs (right panel) before and after donor nephrectomy measured by EVQuant; (e) Spot uEV/creatinine before versus after donor nephrectomy measured by nanoparticle tracking analysis (NTA); (f) Size distribution of uEVs by NTA (left panel) and percentage change of size distribution (right panel, uEV/creatinine ratio ± SEM per 1 nm size bin; (g) CD9‐Europium signal to urine creatinine ratio (Lum./creat) before and after donor nephrectomy measured by CD9–TR‐FIA (signal pre‐donation normalized to 1); (h) Representative immunoblots of CD9 and TSG101 in the 200K uEV pellet before and after donor nephrectomy, loaded relative to individual urine creatinine concentrations, with corresponding densitometry. *p ≤ 0.05, **< 0.01, ***< 0.001
FIGURE 4
FIGURE 4
Changes in urinary extracellular vesicle (uEV) nephron marker proteins after donor nephrectomy. (a) Representative immunoblots before and after donor nephrectomy of nephron marker proteins in uEVs isolated from spot urine, including the podocyte marker Wilm's tumour 1 (WT1), the proximal tubule markers sodium‐hydrogen exchanger 3 (NHE3), sodium/phosphate co‐transporter IIa (NaPi‐IIa), and cubilin, the loop of Henle marker sodium‐potassium‐chloride co‐transporter 2 (NKCC2), the distal convoluted tubule marker sodium‐chloride cotransporter (NCC), and the collecting duct marker aquaporin‐2 (AQP2). All proteins were loaded relative to urine creatinine; (b) Densitometry of absolute changes in uEV protein abundances before (Pre) and after (Post) donor nephrectomy (= 19; A.U., arbitrary units). Densitometry of uEV protein abundances relative to total kidney volume (TKV‐corrected A.U./creat) before (Pre) and after (Post) donor nephrectomy; c) Cartoon illustrating the changes in uEV and uEV biomarker excretion before (Pre) and after (Post) donor nephrectomy. Donor nephrectomy reduces the overall uEV excretion rate by ∼19% (6 to 5 uEVs in the cartoon). In the example, four out of six uEVs contain an uEV biomarker of interest before donor nephrectomy and four out of five uEVs after donor nephrectomy. This illustrates the need to normalize by kidney volume otherwise the doubling in uEV biomarker would remain undetected. This example illustrates the observations for WT1 and NHE3 (no change when not adjusting for total kidney volume versus two‐fold increase when adjusting for total kidney volume, Figure 4B). *p ≤ 0.05, **< 0.01, ***< 0.001
FIGURE 5
FIGURE 5
Comparison of the number and abundance of uEV proteins from nephrostomy or bladder urine. (a) In nine patients with a nephrostomy drain urine samples for uEV analysis were collected from both the nephrostomy drain and normal micturition (“bladder,” see also Table S3 and S4 ). Mass spectrometry identified 2829 proteins of which 2814 were identified in uEVs isolated from the nephrostomy drain and bladder urines and 3 and 12 proteins were only identified in the nephrostomy and bladder urine samples, respectively. (b) A Vulcano plot is shown for the 2462 proteins for which the abundance could be determined indicating whether protein abundance was higher in the bladder or nephrostomy urine sample. (c) The distribution of the nephrostomy/bladder uEV protein abundance ratios is shown illustrating that the abundance of the majority of the uEV proteins was similar in both sources (nephrostomy/bladder uEV protein abundance ratio 1.0, IQR 0.9–1.2)
FIGURE 6
FIGURE 6
Effect of sham, uninephrectomy or 5/6th nephrectomy on urinary extracellular vesicle (uEV) excretion in rats. (a) 24‐h uEV excretion before (Pre) and 8 weeks after (Post) sham surgery (n = 10) and uEV size distribution (right panel, ± SEM per 1 nm bin size); (b) 24‐h uEV excretion before and 8 weeks after uninephrectomy (n = 8) and uEV size distribution (lower panel, ± SEM per 1 nm bin size); (c) 24‐h uEV excretion before and 8 weeks after 5/6th nephrectomy (n = 8) and uEV size distribution (lower panel, ± SEM per 1 nm bin size); (d) Percentage change in uEV excretion before‐after sham surgery, uninephrectomy or 5/6th nephrectomy, including uEV size distribution (right panel, ± SEM per 1 nm size bin); (e) Spearman correlation between the change in uEV excretion and FITC‐sinistrin glomerular filtration rate (GFR); •, sham surgery; ○ uninephrectomy; □ 5/6th nephrectomy; f) Spearman correlation between the change in 24‐h uEV excretion and kidney weight. *p ≤ 0.05, **< 0.01, ***< 0.001

References

    1. Bazzell, B. G. , Rainey, W. E. , Auchus, R. J. , Zocco, D. , Bruttini, M. , Hummel, S. L. , & Byrd, J. B. (2018). Human urinary mRNA as a biomarker of cardiovascular disease. Circulation: Genomic and Precision Medicine, 11, e002213. - PMC - PubMed
    1. Bertram, J. F. , Douglas‐Denton, R. N. , Diouf, B. , Hughson, M. D. , & Hoy, W. E. (2011). Human nephron number: Implications for health and disease. Pediatric Nephrology, 26, 1529–1533. - PubMed
    1. Blijdorp, C. J. , & Hoorn, E. J. (2019). Urinary extracellular vesicles: The mothership connection. American Journal of Physiology. Renal Physiology, 317, F648‐F649. - PubMed
    1. Blijdorp, C. J. , Tutakhel, O. A. Z. , Hartjes, T. A. , Van Den Bosch, T. P. P. , Van Heugten, M. H. , Rigalli, J. P. , Willemsen, R. , Musterd‐Bhaggoe, U. M. , Barros, E. R. , Carles‐Fontana, R. , Carvajal, C. A. , Arntz, O. J. , Van De Loo, F. A. J. , Jenster, G. , Clahsen‐Van Groningen, M. C. , Cuevas, C. A. , Severs, D. , Fenton, R. A. , Van Royen, M. E. , … Hoorn, E. J. (2021). Comparing approaches to normalize, quantify, and characterize urinary extracellular vesicles. Journal of the American Society of Nephrology, 32, 1210–1226. - PMC - PubMed
    1. Boudville, N. , Ramesh Prasad, G. V. , Knoll, G. , Muirhead, N. , Thiessen‐Philbrook, H. , Yang, R. C. , Rosas‐Arellano, M. P , Housawi, A. , & Garg, A. X. (2006). Meta‐analysis: Risk for hypertension in living kidney donors. Annals of Internal Medicine, 145, 185–196. - PubMed

Publication types