. 2022 Mar:142:105174.
doi: 10.1016/j.compbiomed.2021.105174. Epub 2022 Jan 20.

Reconstruction of cardiac position using body surface potentials

Affiliations

Reconstruction of cardiac position using body surface potentials

Jake A Bergquist et al. Comput Biol Med. 2022 Mar.

Abstract

Electrocardiographic imaging (ECGI) is a noninvasive technique to assess the bioelectric activity of the heart which has been applied to aid in clinical diagnosis and management of cardiac dysfunction. ECGI is built on mathematical models that take into account several patient specific factors including the position of the heart within the torso. Errors in the localization of the heart within the torso, as might arise due to natural changes in heart position from respiration or changes in body position, contribute to errors in ECGI reconstructions of the cardiac activity, thereby reducing the clinical utility of ECGI. In this study we present a novel method for the reconstruction of cardiac geometry utilizing noninvasively acquired body surface potential measurements. Our geometric correction method simultaneously estimates the cardiac position over a series of heartbeats by leveraging an iterative approach which alternates between estimating the cardiac bioelectric source across all heartbeats and then estimating cardiac positions for each heartbeat. We demonstrate that our geometric correction method is able to reduce geometric error and improve ECGI accuracy in a wide range of testing scenarios. We examine the performance of our geometric correction method using different activation sequences, ranges of cardiac motion, and body surface electrode configurations. We find that after geometric correction resulting ECGI solution accuracy is improved and variability of the ECGI solutions between heartbeats is substantially reduced.

Keywords: Body surface potential mapping; Electrocardiographic imaging; Inverse problem; Optimization.


Figures

Figure 1:
Figure 1:
Schematic representation of the geometric optimization algorithm. Initially BSP signals and a starting cardiac position are supplied for each heartbeat. In our case, the same cardiac position was supplied initially for all heartbeats. During step 1, the ‘joint inverse’ method is used to estimate cardiac surface potentials using all BSP signals and cardiac positions. In step 2 the estimated cardiac surface potentials are used to estimate new cardiac positions individually for each heartbeat. After Step 2, the stopping criteria is evaluated. In this study , the stopping criteria was iteration count, set to 50. The output from step 2, a new set of estimated cardiac positions, is either fed back into step 1 for the next iteration or passed as the output.
Figure 2:
Figure 2:
Experimental setup used to generate geometric model and electrocardiographic signals. The Utah Pericardiac Cage (blue) recorded signals from near the heart surface during sinus and anterior left ventricular pacing. The UPC geometry was registered post experiment into the 771-node torso-tank geometry. This visualization shows part of the torso tank and UPC cut away to illustrate relative positioning.
Figure 3:
Figure 3:
Demonstration of the cardiac position ranges for each position set. The cardiac geometry in the nominal position (green) on the left column is moved to positions within each of the ranges defined for Position Sets 1, 2, 3, and 4. The right panels show example cardiac positions in those parameter ranges, with position parameters shown in the accompanying plots. Note that Position Sets 1, 3, and 4 use the same range. The two views of the torso show the anterior view and the left side view. The color of the cardiac geometry corresponds to the colored dots on the parameter graphic. The cardiac geometry is shown using a wire-frame model to allow for simultaneous visualization of the overlapping positions. Position Set 2 covers a substantially smaller range of motion than Position Sets 1, 3 and 4. The colored nodes (pink and gray) on the nominal geometry indicate the region of the cardiac geometry that is cut when the geometry is flattened for subsequent visualizations. This cutting and flattening process can be seen in Supplemental Video s.1.
Figure 4:
Figure 4:
Sub-sampling of the torso BSP signals. Spheres represent electrode recording locations and the green spheres highlight the electrodes included in each leadset. Leadsets were designed to explore a range of sampling scenarios. The ‘no caps’ leadset represts removing the electrodes from the torso that make up the top and bottom of the torso mesh, which would be unrealistic to sample from in a clinical implementation. The leadsets called ‘3 Strip’ versions 1 to 7 (V1–V7) represent successive downsampling of the same three strips of electrodes around the circumference of the torso. The full leadset (the entire set of spheres shown in each diagram plus a grid of electrodes added to the top and bottom) used all nodes on the torso surface. Number of electrodes per leadset: Full: 771, No Caps: 596, 9 Lead: 9, Orthogonal: 6, 1 Strip: 34, 2 Strip: 72, 3 Strip V1: 106, 3 Strip V2: 53, 3 Strip V3: 37, 3 Strip V4: 28, 3 Strip V5: 22, 3 Strip V6: 19, 3 Strip V7: 16.
Figure 5:
Figure 5:
Reconstructed parameters and mean per-electrode localization errors for Position Sets 1 (top) and 2 (bottom). The scatter plots (left) capture parameter reconstruction errors, in which the red line indicates the initial parameter values, the solid black line shows the target cardiac position parameters, and the diamonds show the reconstructed parameters. Note the change in scaling of some the of plots to facilitate interpretation of the parameter reconstructions, which sometimes had very different ranges, such as in Position Set 2. The right plots show box plots across all positions of the per-node localization error (mm) between optimized and non-optimized cardiac positions.
Figure 6:
Figure 6:
Mean per-node localization error across the three activation sequences for Position Set 1. These results used the full leadset. The non-optimized errors are shown on the right for comparison. Plus signs denote outliers, defined as a value that is more than 1.5 times the interquartile range away from the bottom or top of the box.
Figure 7:
Figure 7:
Box plots of mean per-node localization error across the different leadsets for Position Set 1 and the aVp activation sequence. The leadset names correspond to those shown in Figure 4 (full: Full lead set, no caps: no caps leadset, 9 lead, 9 lead leadset, Orth: Orthogonal, 1str: 1 strip, 2str: 2 strip, 3str v1:7, 3 strip version 1 to 7. No opt: non-optimized position). The full leadset uses all nodes of the torso mesh.
Figure 8:
Figure 8:
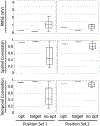
ECGI accuracy as measured by RMSE, spatial correlation, and temporal correlation for Position Set 1 and 2 using the aVp activation sequence. Results are shown for the optimized cardiac positions (opt), true cardiac positions (target), and non-optimized positions (no opt). From top to bottom these statistics report the RMSE, spatial correlation (SC), and temporal correlation (TC). Within each row there are two panels. The ones on the left depicts the results for Position Set 1, and the ones on the right depicts the results for Position Set 2.
Figure 9:
Figure 9:
Example ECGI reconstructions for the non-optimized, optimized, and ground-truth cardiac positions using Position Sets 1 and 2 with the aVp activation sequence. Best and worst case beats were determined based on the maximum and minimum spatial correlation of the optimized reconstruction compared to the true EGMs (shown on lower left) and were chosen separately per position set. All maps show potentials at a time corresponding to the peak of the RMS signal for the true EGMs, as indicated on the waveform plot on the lower right. The potential maps are displayed on a flattened and unwrapped geometry of the pericardiac cage. The colored nodes on the map of the measured potentials correspond to the vertical lines along which the cage was cut to produced the flattened projection. Video s.1 shows the cage geometry being unwrapped into this flattened version.
Figure 10:
Figure 10:
ECGI reconstruction accuracy across the different leadsets using Position Set 1 and the aVp activation sequence. LeadSet names correspond to the those shown in Figure 4.

References

    1. Cluitmans M, Brooks D, MacLeod R, Dossel O, Guillem M, van Dam P, Svehlikova J, He B, Sapp J, Wang L, Bear L, Validation and opportunities of electrocardiographic imaging: From technical achievements to clinical applications., Front Physiol 9 (2018) 1305. - PMC - PubMed
    1. Wissner E, Revishvili A, Metzner A, Tsyganov A, Kalinin V, Lemes C, Saguner AM, Maurer T, Deiss S, Sopov O, Labarkava E, Chmelevsky M, Kuck KH, Noninvasive epicardial and endocardial mapping of premature ventricular contractions, Europace 19 (2017) 843–849. - PMC - PubMed
    1. Erkapic D, Neumann T, Ablation of premature ventricular complexes exclusively guided by three-dimensional noninvasive mapping., Card Electrophysiol Clin 7 (2015) 109–115. - PubMed
    1. Potyagaylo D, Segel M, Schulze WHW, Dössel O, Noninvasive Localization of Ectopic Foci: A New Optimization Approach for Simultaneous Reconstruction of Transmembrane Voltages and Epicardial Potentials BT, in: Ourselin S, Rueckert D, Smith N (Eds.), Functional Imaging and Modeling of the Heart, Springer Berlin Heidelberg, Berlin, Heidelberg, 2013, pp. 166–173.
    1. Cuculich P, Robinson C, Noninvasive ablation of ventricular tachycardia., N Engl J Med 378 (2018) 1651–1652. - PubMed

Publication types