. 2022 Mar 1:232:109192.
doi: 10.1016/j.drugalcdep.2021.109192. Epub 2021 Nov 26.

Trends in pharmacy-based dispensing of buprenorphine, extended-release naltrexone, and naloxone during the COVID-19 pandemic by age and sex - United States, March 2019 - December 2020

Affiliations

Trends in pharmacy-based dispensing of buprenorphine, extended-release naltrexone, and naloxone during the COVID-19 pandemic by age and sex - United States, March 2019 - December 2020

Laura J Cremer et al. Drug Alcohol Depend. .

Abstract

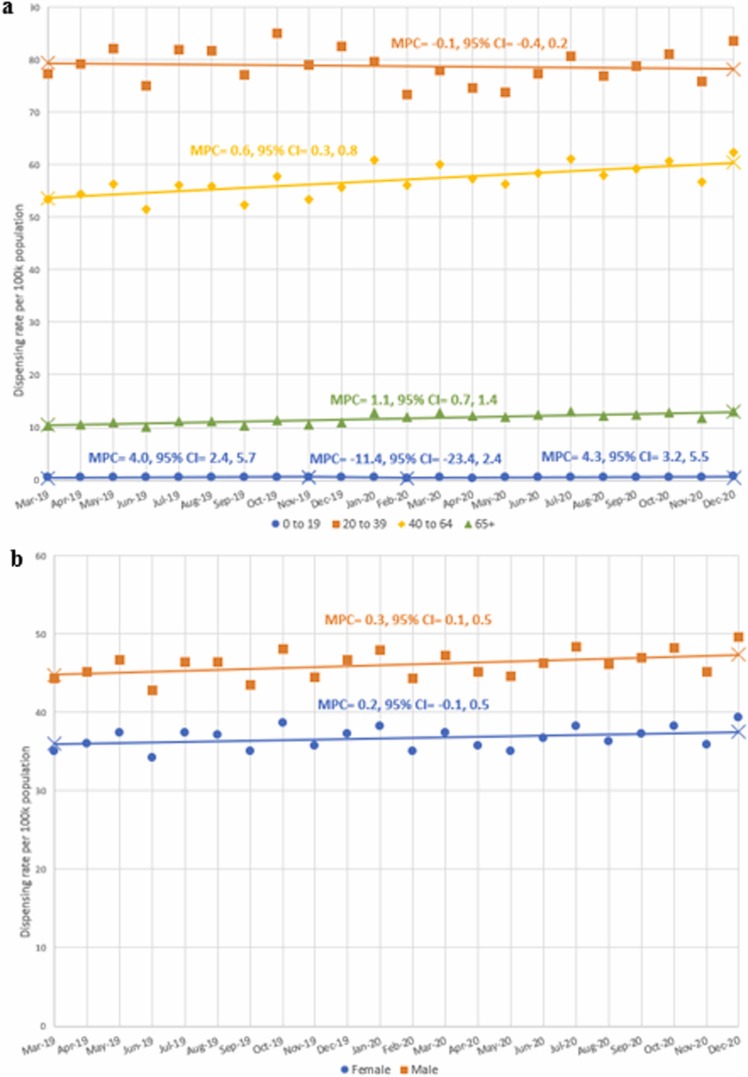
Background: COVID-19 stay-at-home orders may reduce access to substance use treatment and naloxone, an opioid overdose reversal drug. The objective of this analysis was to compare monthly trends in pharmacy-based dispensing rates of medications for opioid use disorder (MOUD) (buprenorphine and extended-release [ER] naltrexone) and naloxone in the United States during March 2019-December 2020 by age and sex.

Methods: We calculated monthly prescription dispensing rates per 100,000 persons using IQVIA New to Brand. We used Joinpoint regression to calculate monthly percent change in dispensing rates and Wilcoxon Rank Sum tests to examine differences in median monthly rates overall, and by age and sex between March 2019-December 2019 and March 2020-December 2020.

Results: Buprenorphine dispensing increased among those aged 40-64 years and ≥ 65 years from March 2019 to December 2020. Median rates of total ER naltrexone dispensing were lower in March 2020-December 2020 compared to March 2019-December 2019 for the total population, and for females and males. From March 2019 to December 2020, ER naltrexone dispensing decreased and naloxone dispensing increased for those aged 20-39 years.

Conclusions: Dispensing ER naltrexone declined during the study period. Given the increase in substance use during the COVID-19 pandemic, maintaining equivalent access to MOUD may not be adequate to accommodate rising numbers of new patients with opioid use disorder. Access to all MOUD and naloxone could be further expanded to meet potential needs during and after the public health emergency, given their importance in preventing opioid overdose-related harms.

Keywords: Buprenorphine; COVID-19; Extended-release naltrexone; Medication for opioid use disorder; Naloxone.


Figures

Fig. 1
Fig. 1
Monthly total dispensing rates per 100,000 persons from March 2019 to December 2020 for buprenorphine, naloxone, and extended-release (ER) naltrexone. There is a break in the y-axis, creating a jump in dispensing rate per 100k population from 3 to 35. The monthly percent change (MPC) is calculated by Joinpoint. A change in trend (inflection point) is denoted by X. New Jersey is not included in naloxone dispensing rates due to unusually high dispensing rates because of a new policy in May 2020 co-prescribing naloxone with opioids prescribed for managing chronic pain. We obtained dispensing data for buprenorphine, ER naltrexone, and naloxone from IQVIA New to Brand. We used quarterly population data from the United States Census Bureau to estimate monthly populations and to calculate monthly dispensing rates.
Fig. 2
Fig. 2
a. Monthly buprenorphine dispensing rates per 100,000 persons from March 2019 to December 2020 by years of age group. The monthly percent change (MPC) is calculated by Joinpoint. A change in trend (inflection point) is denoted by X. We obtained dispensing data for buprenorphine from IQVIA New to Brand. We used quarterly population data from the United States Census Bureau to estimate monthly populations and to calculate monthly dispensing rates. b. Monthly buprenorphine dispensing rates per 100,000 persons from March 2019 to December 2020 by sex. Changes in monthly percent change (MPC) determined by Joinpoint are shown by different line patterns. A change in trend (inflection point) is denoted by X. Dispensing data for buprenorphine was obtained from IQVIA New to Brand. We used quarterly population data from the United States Census Bureau to estimate monthly populations and to calculate monthly dispensing rates.
Fig. 3
Fig. 3
a. Monthly extended-release (ER) naltrexone dispensing rates per 100,000 persons from March 2019 to December 2020 by years of age group. The monthly percent change (MPC) is calculated by Joinpoint. A change in trend (inflection point) is denoted by X. We obtained dispensing data for ER naltrexone from IQVIA New to Brand. We used quarterly population data from the United States Census Bureau to estimate monthly populations and to calculate monthly dispensing rates. b. Monthly extended-release (ER) naltrexone dispensing rates per 100k persons from March 2019 to December 2020 by sex. The monthly percent change (MPC) is calculated by Joinpoint. A change in trend (inflection point) is denoted by X. We obtained dispensing data for ER naltrexone from IQVIA New to Brand. We used quarterly population data from the United States Census Bureau to estimate monthly populations and to calculate monthly dispensing rates.
Fig. 4
Fig. 4
a. Monthly naloxone dispensing rates per 100,000 persons from March 2019 to December 2020 by years of age group. The monthly percent change (MPC) is calculated by Joinpoint. A change in trend (inflection point) is denoted by X. New Jersey is not included in naloxone dispensing rates due to unusually high dispensing rates because of a new policy in May 2020 co-prescribing naloxone with opioids prescribed for managing chronic pain. We obtained dispensing data for naloxone from IQVIA New to Brand. We used quarterly population data from the United States Census Bureau to estimate monthly populations and to calculate monthly dispensing rates. b. Monthly naloxone dispensing rates per 100,000 persons from March 2019 to December 2020 by sex. The monthly percent change (MPC) is calculated by Joinpoint. A change in trend (inflection point) is denoted by X. New Jersey is not included in naloxone dispensing rates due to unusually high dispensing rates because of a new policy in May 2020 co-prescribing naloxone with opioids prescribed for managing chronic pain. We obtained dispensing data for naloxone from IQVIA New to Brand. We used quarterly population data from the United States Census Bureau to estimate monthly populations and to calculate monthly dispensing rates.

References

    1. Ahmad, F., Rossen, LM, Sutton, P., 2021. Provisional drug overdose death counts. 〈https://www.cdc.gov/nchs/nvss/vsrr/drug-overdose-data.htm〉. (Accessed October 15, 2021).
    1. Alderks, C.E., 2017. Trends in the Use of Methadone, Buprenorphine, and Extended-Release Naltrexone at Substance Abuse Treatment Facilities: 2003–2015. 〈https://www.samhsa.gov/data/sites/default/files/report_3192/ShortReport.... (Accessed October 15, 2021). - PubMed
    1. Andraka-Christou B., Capone M.J. A qualitative study comparing physician-reported barriers to treating addiction using buprenorphine and extended-release naltrexone in U.S. office-based practices. Int. J. Drug Policy. 2018;54:9–17. - PubMed
    1. Beetham T., Saloner B., Wakeman S.E., Gaye M., Barnett M.L. Access to office-based buprenorphine treatment in areas with high rates of opioid-related mortality: an audit study. Ann. Intern. Med. 2019;171(1):1–9. - PMC - PubMed
    1. Cance J.D., Doyle E. Changes in outpatient buprenorphine dispensing during the COVID-19 pandemic. Jama. 2020;324(23):2442–2444. - PMC - PubMed