. 2022 Feb 3;29(2):232-247.e7.
doi: 10.1016/j.stem.2021.12.009. Epub 2022 Jan 21.

The microbiota regulates hematopoietic stem cell fate decisions by controlling iron availability in bone marrow

Affiliations

The microbiota regulates hematopoietic stem cell fate decisions by controlling iron availability in bone marrow

Dachuan Zhang et al. Cell Stem Cell. .

Abstract

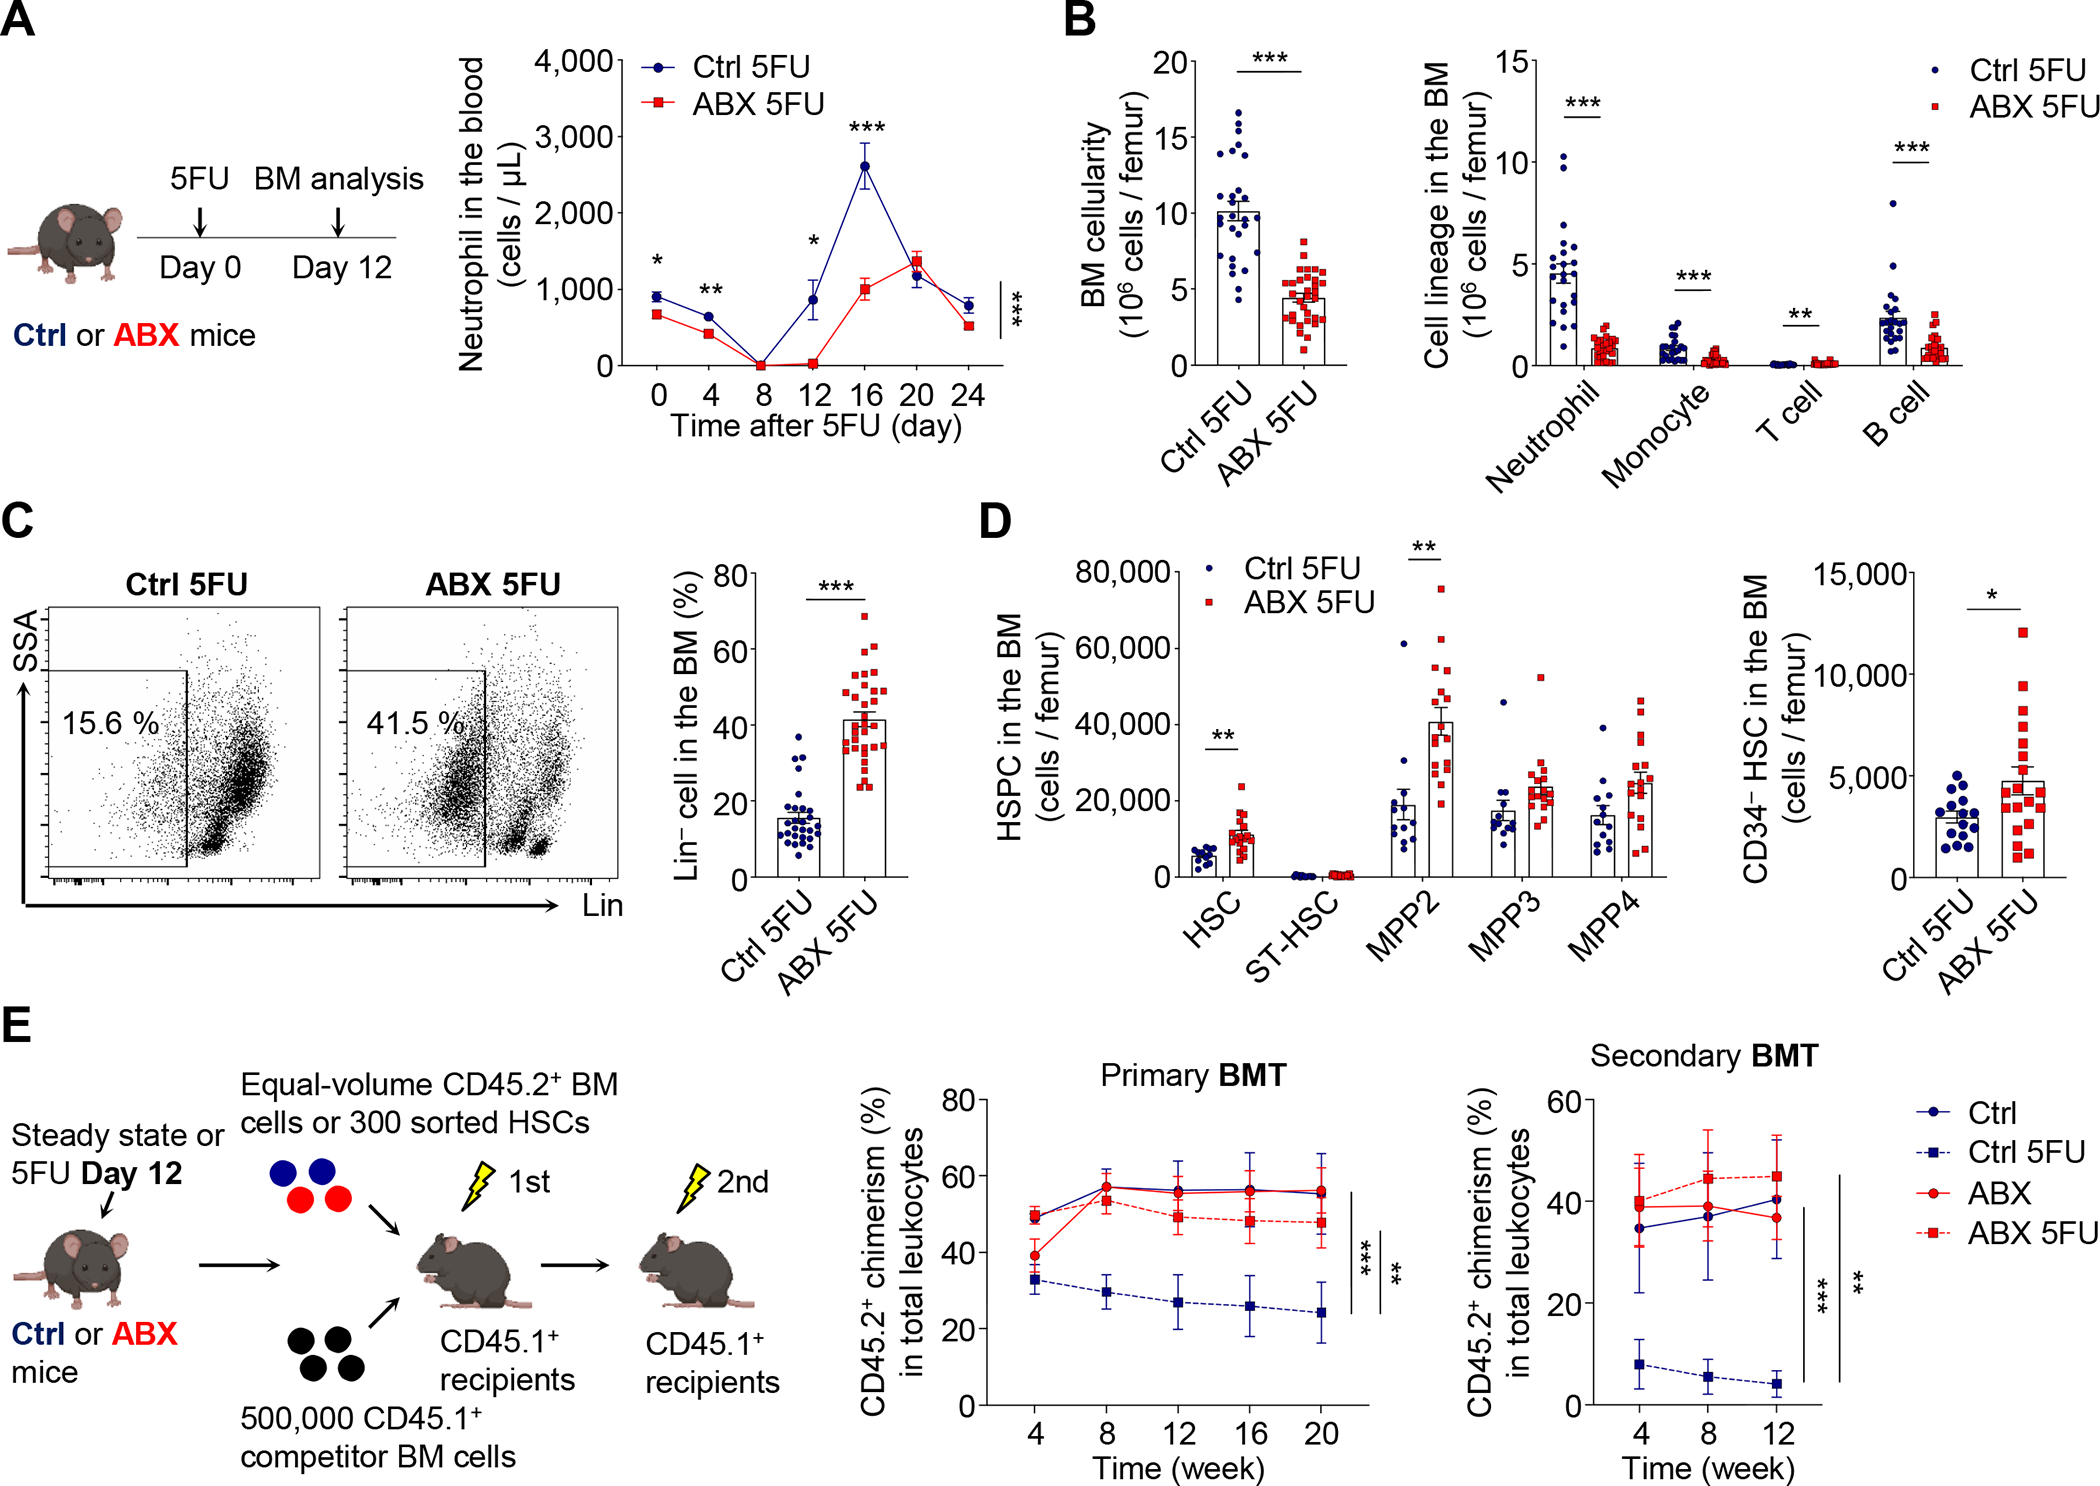
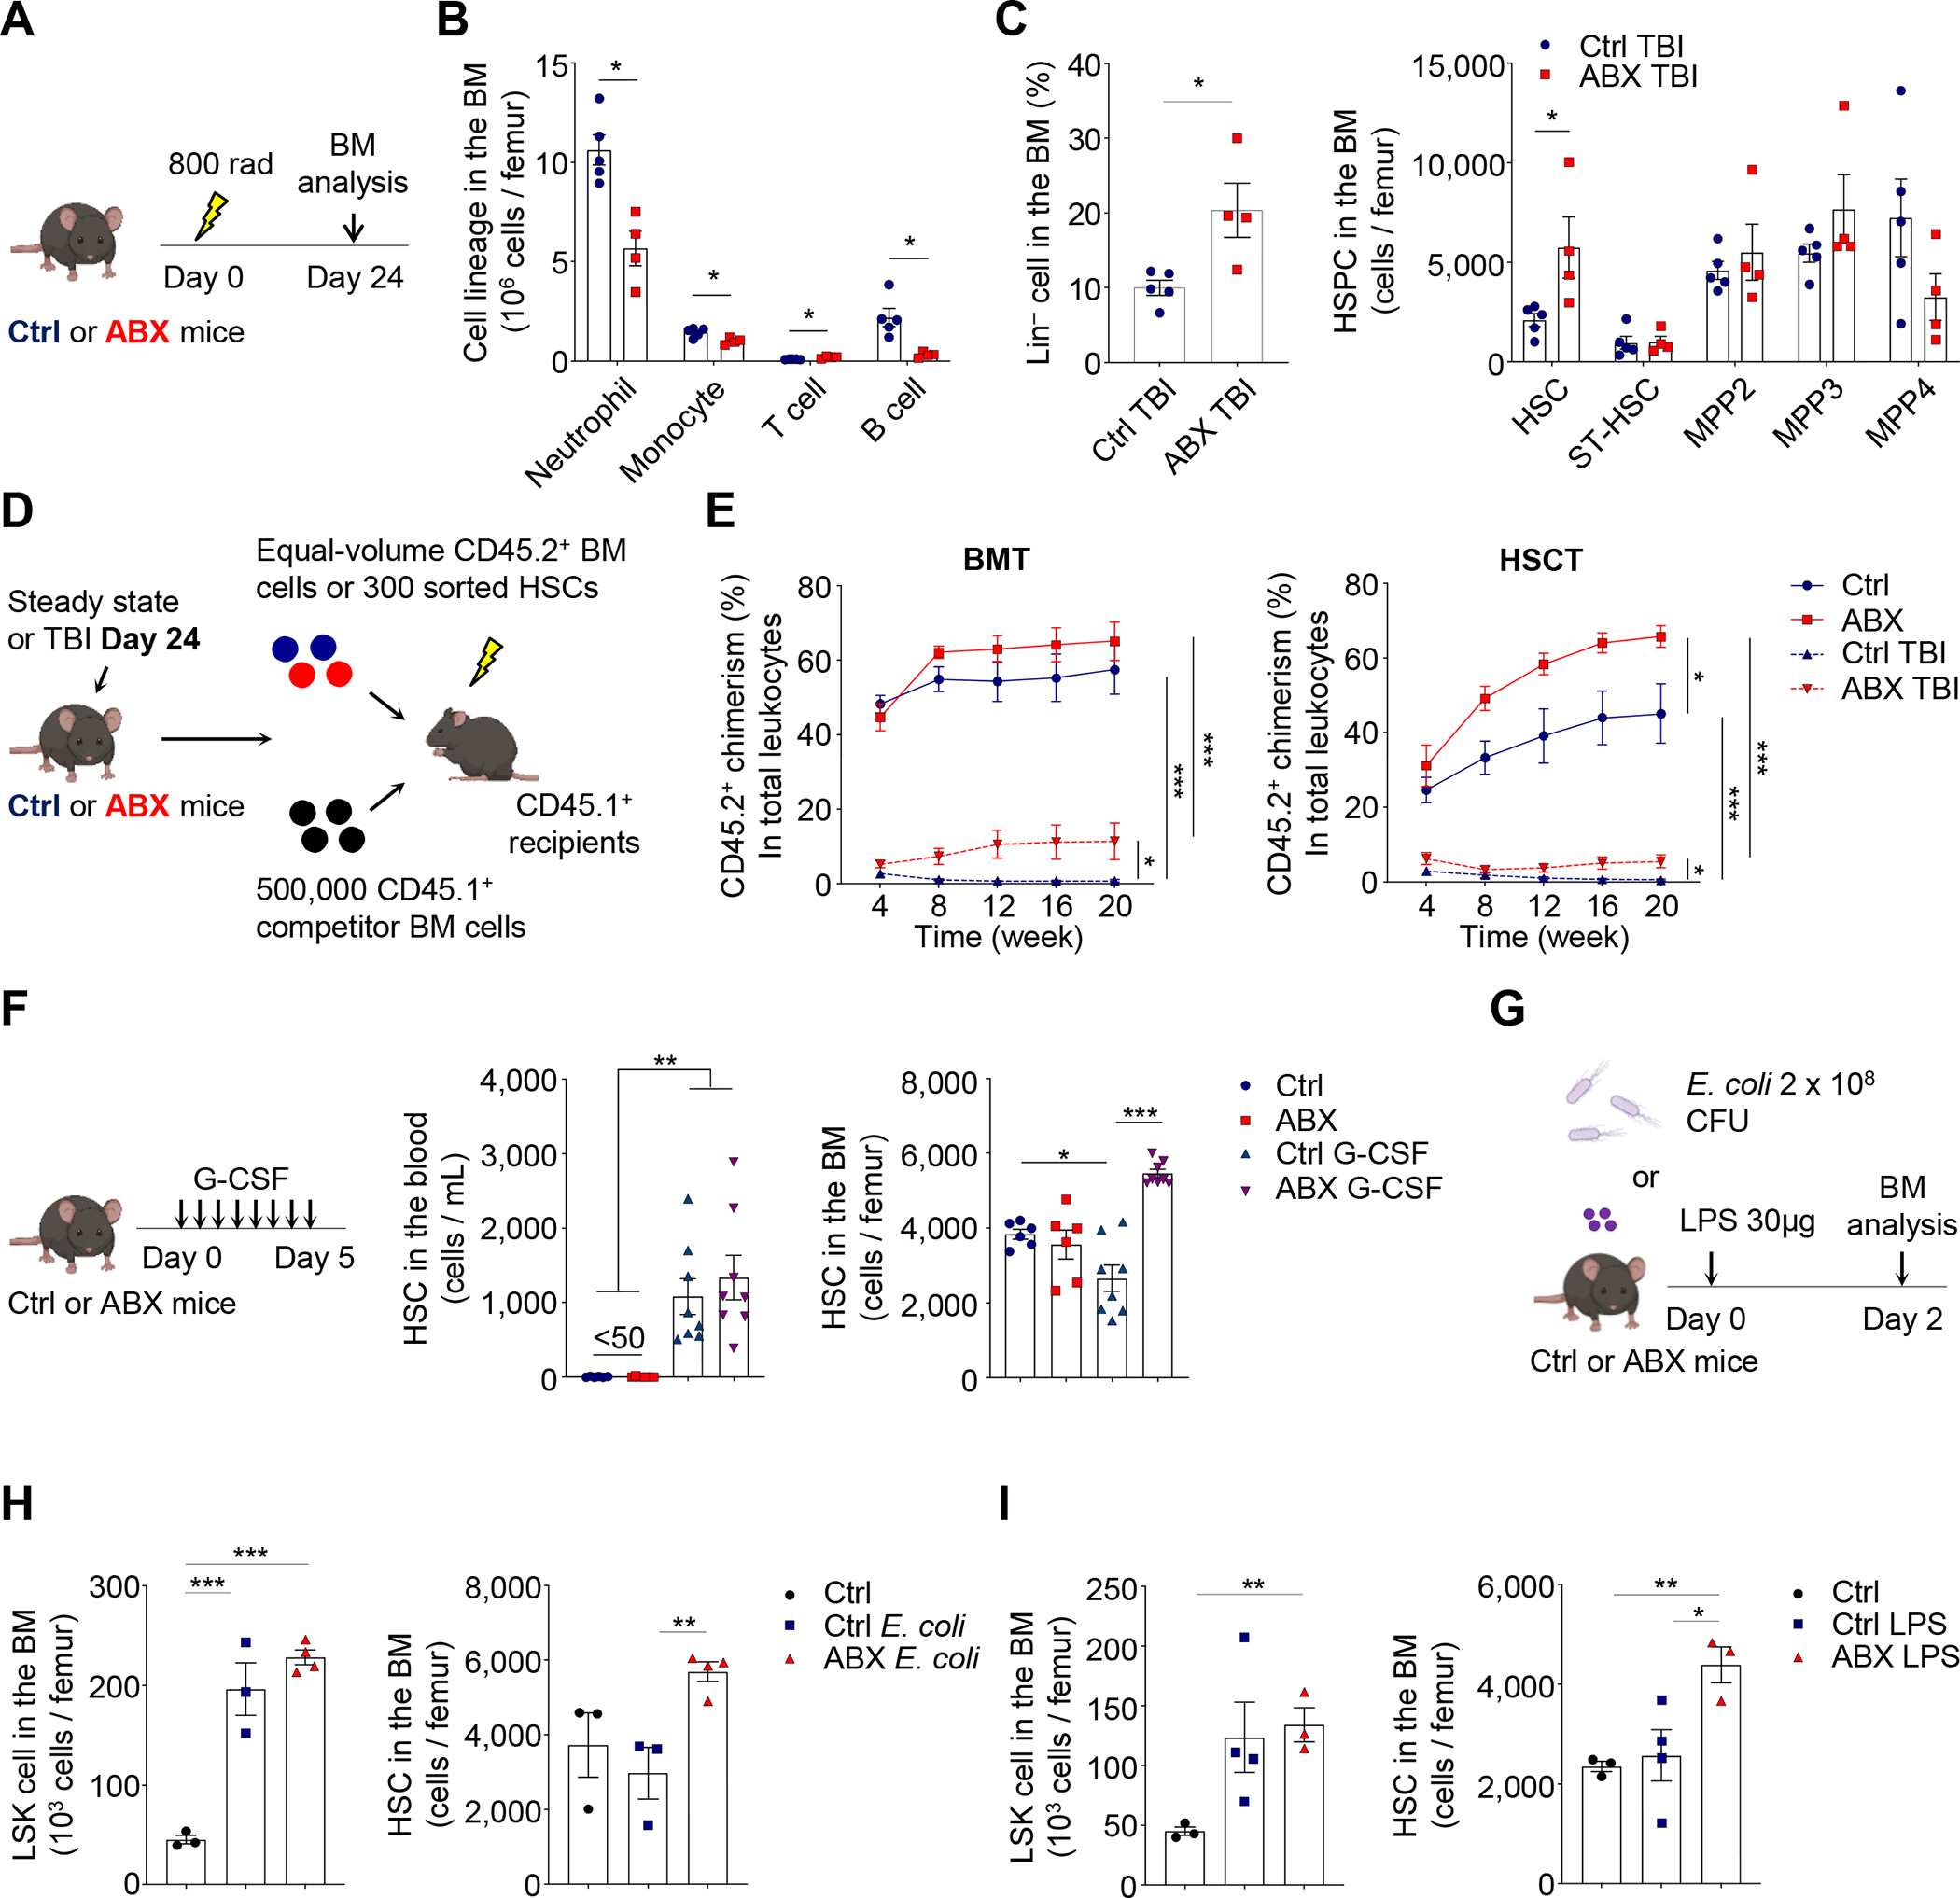
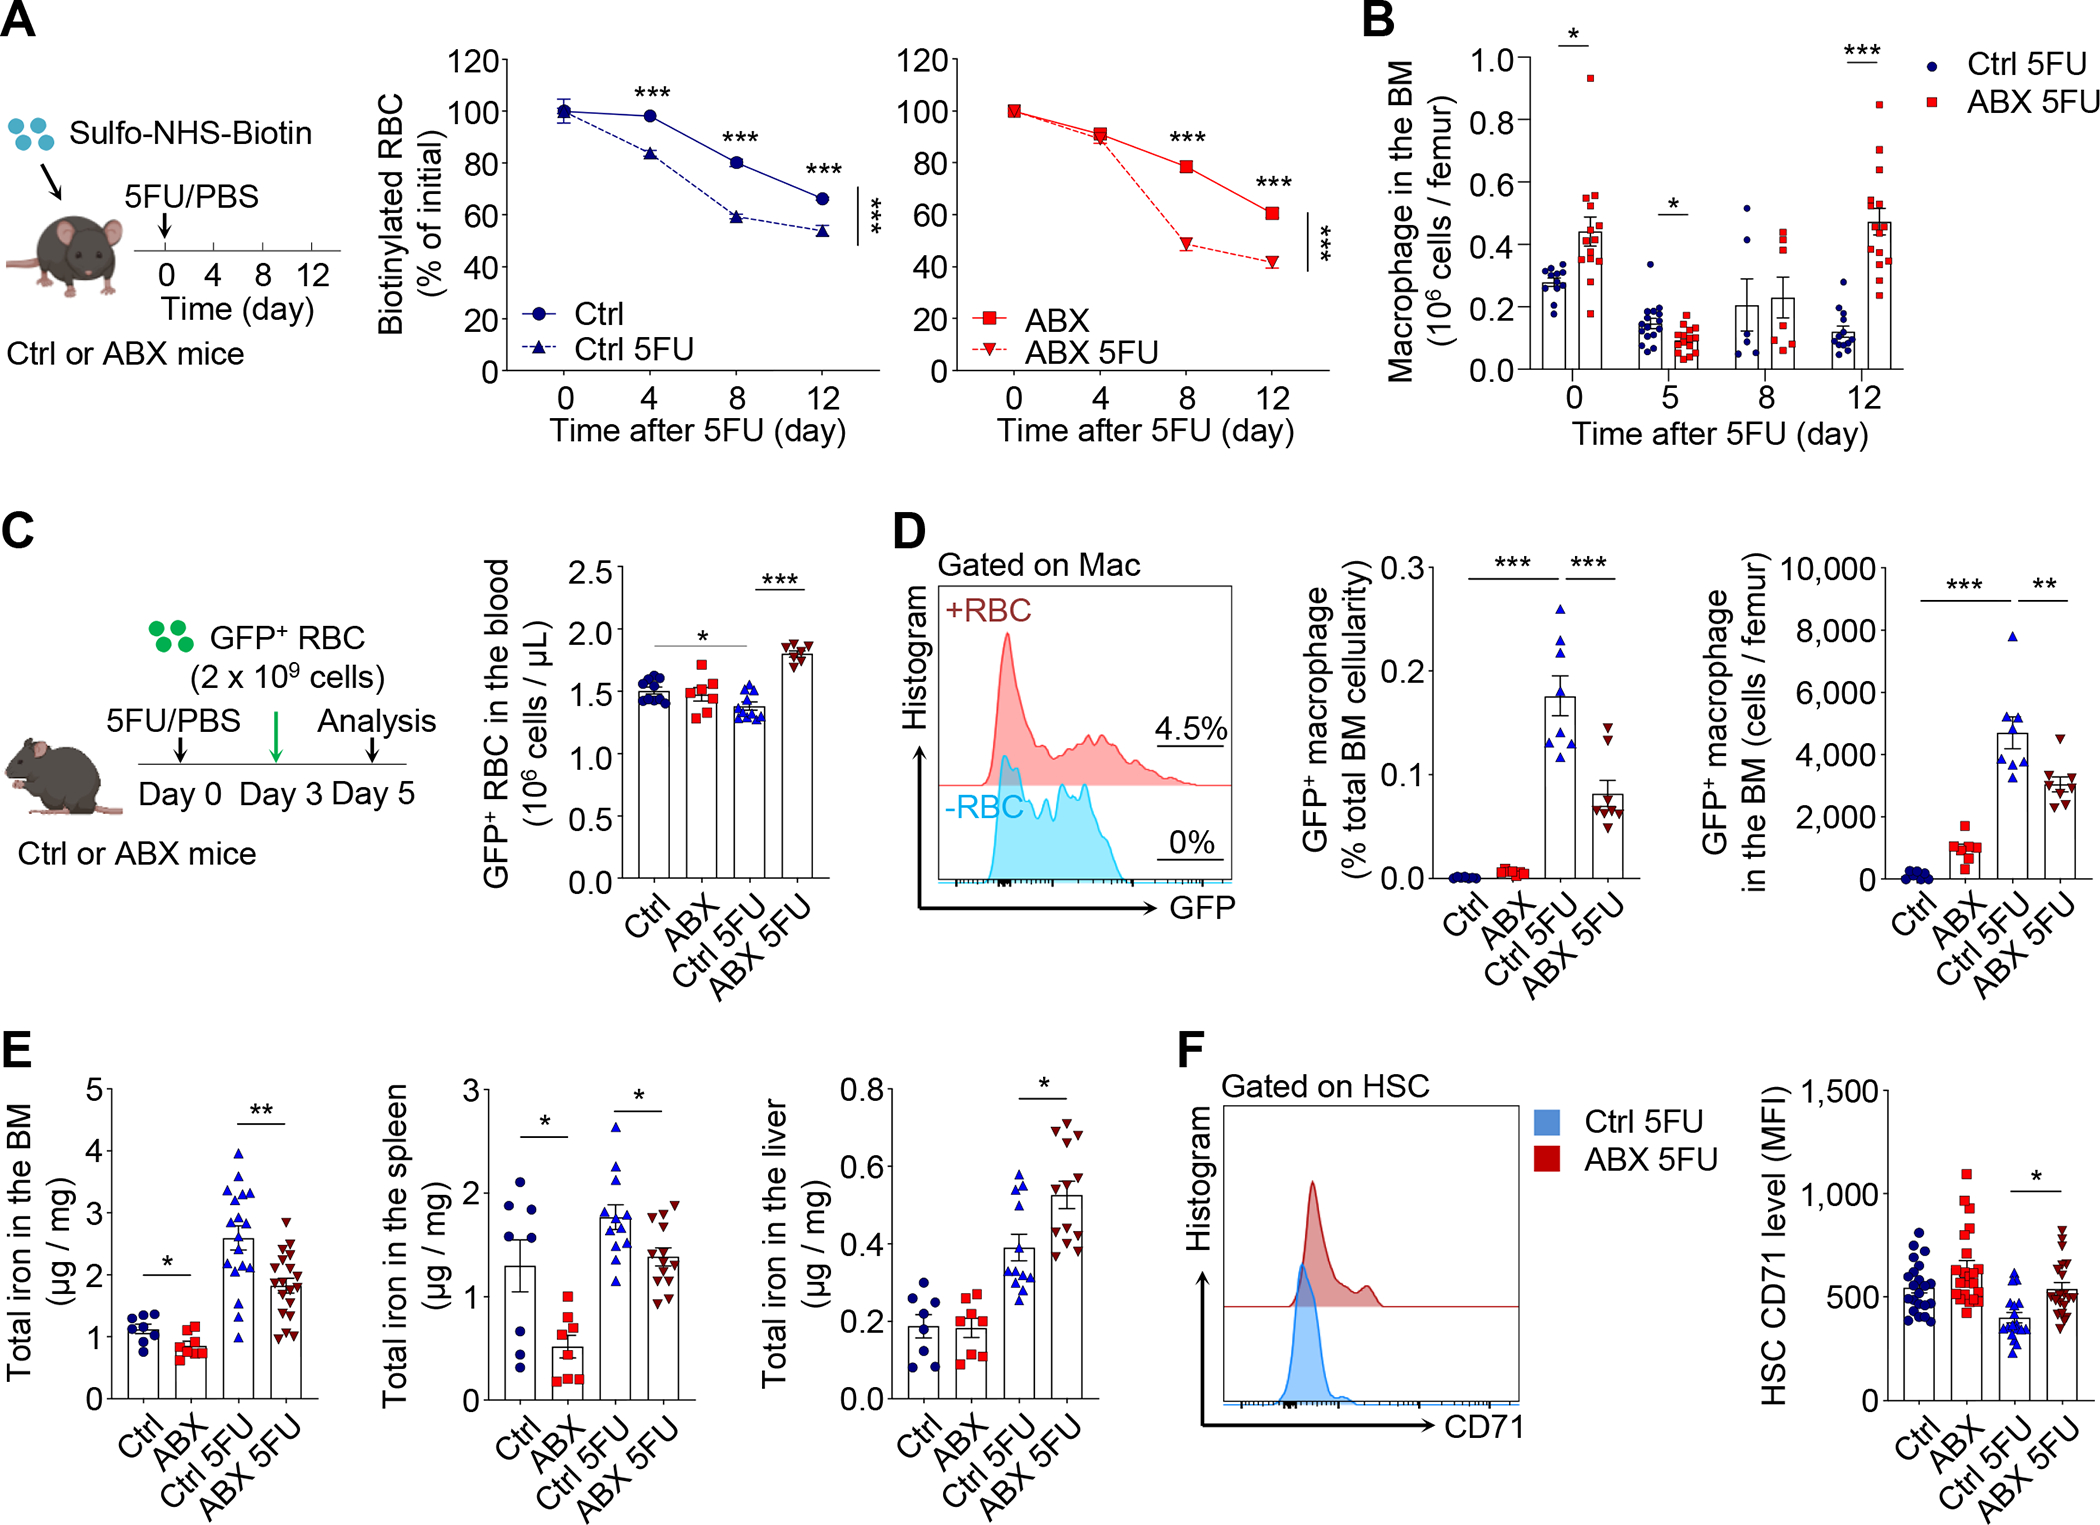
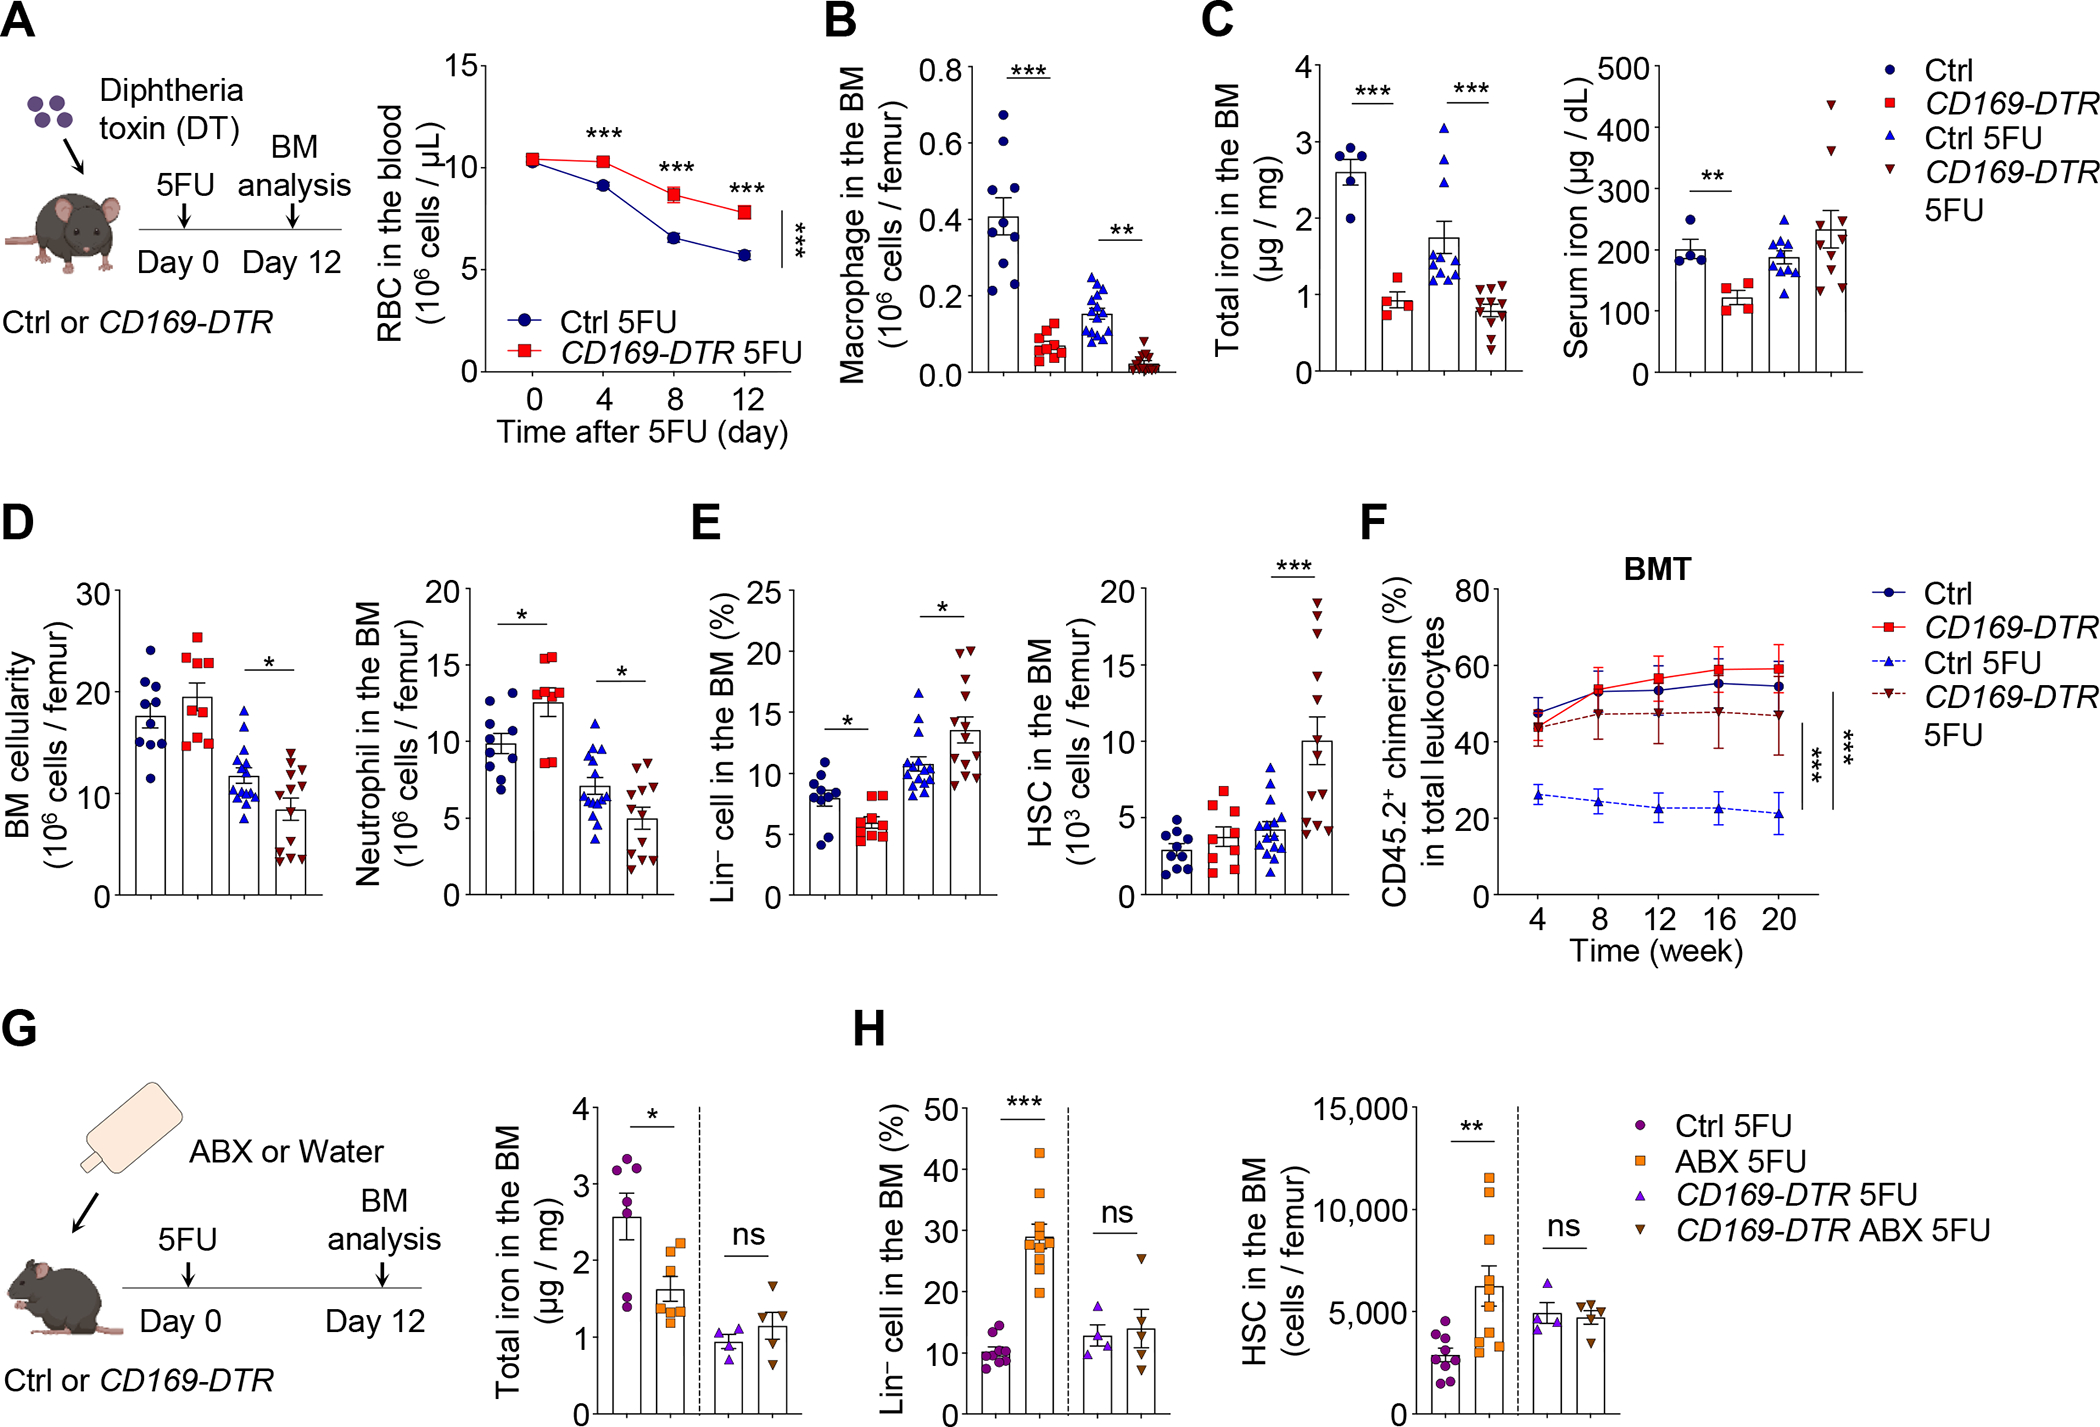
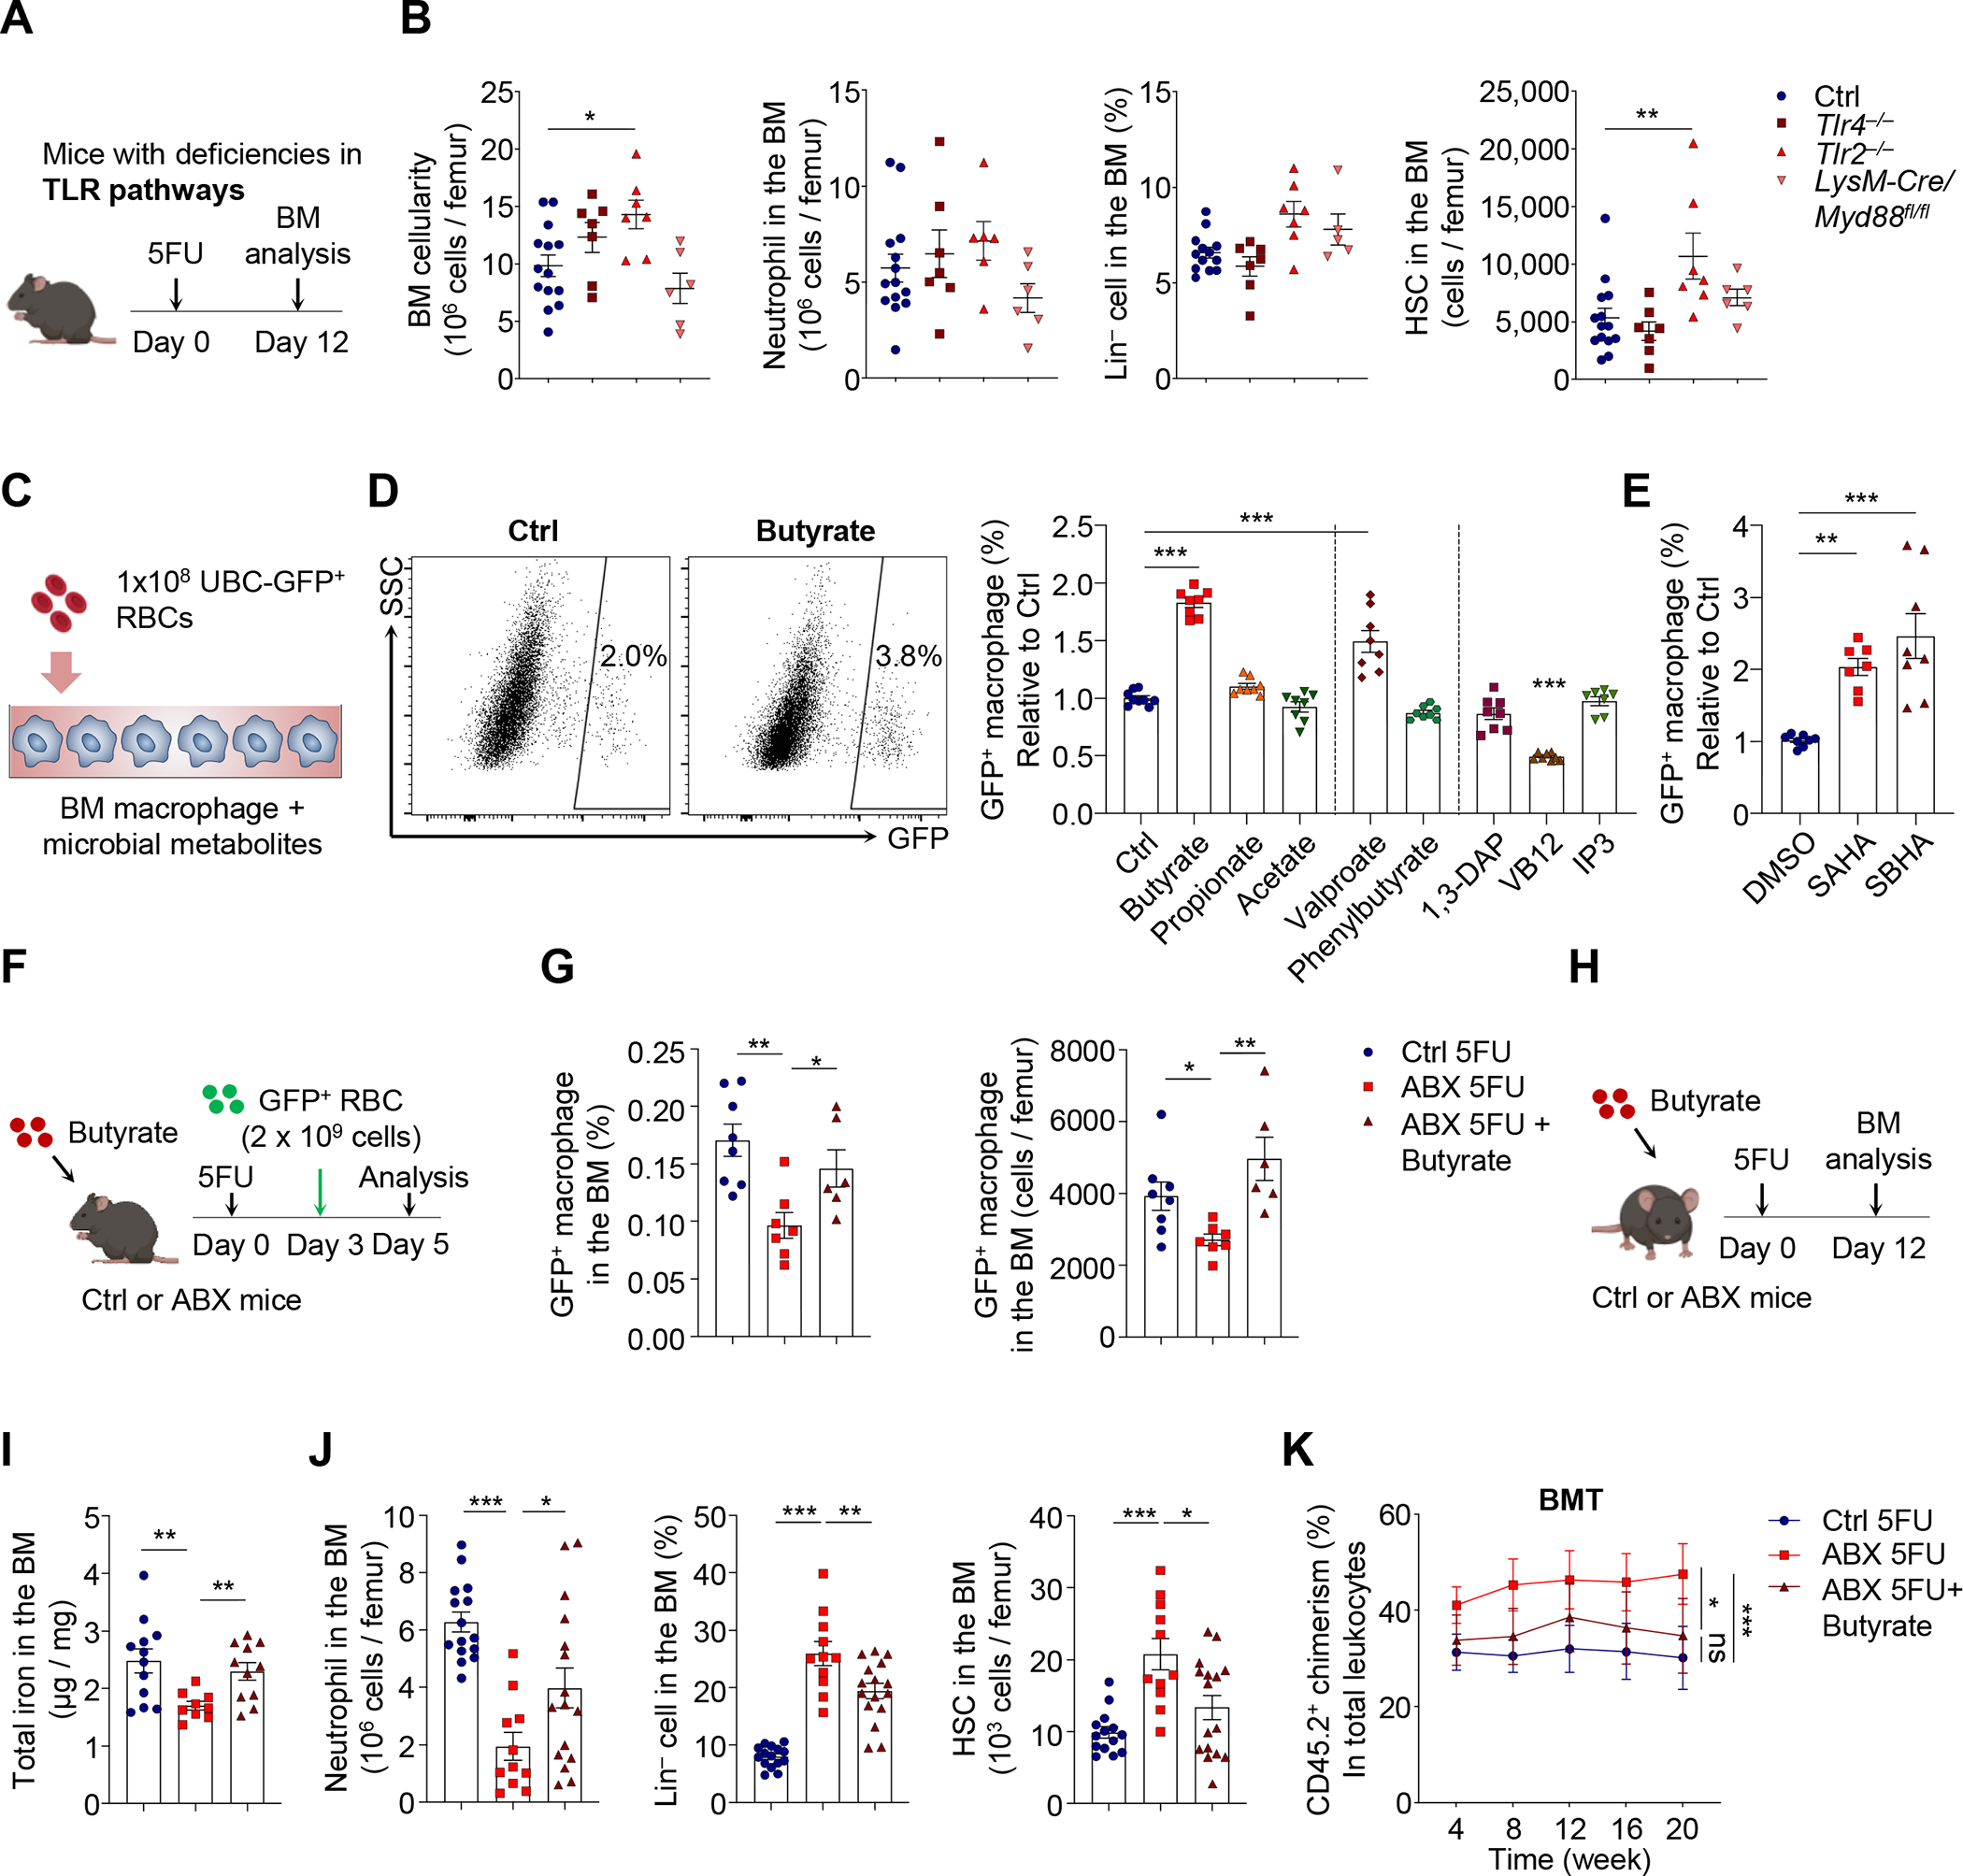
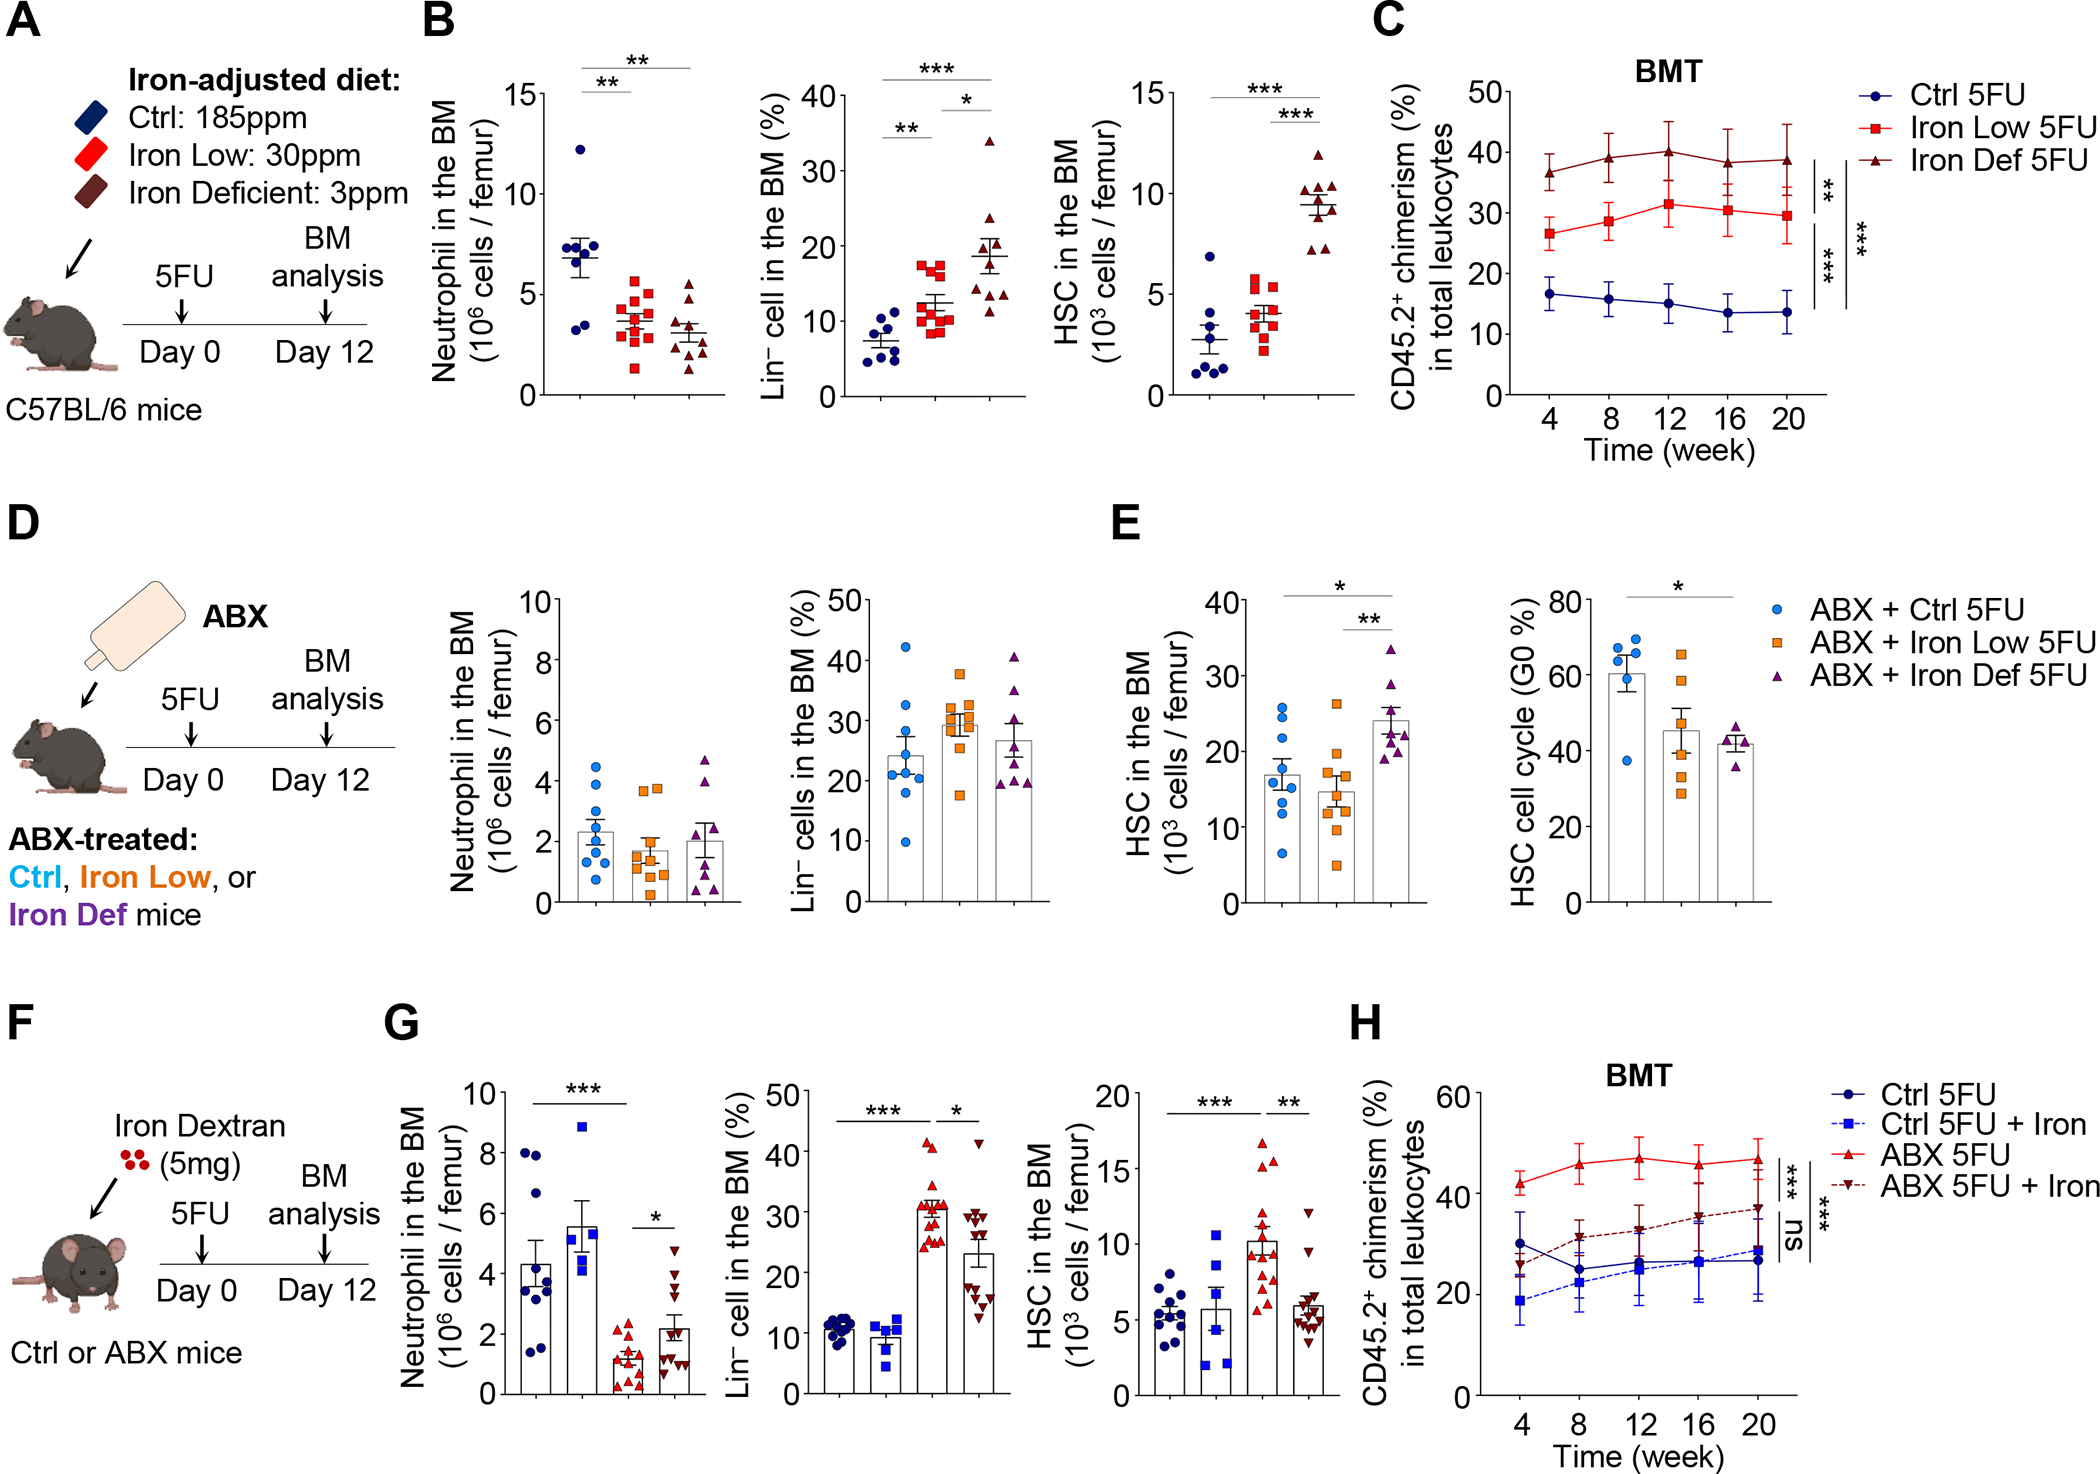
Host microbiota crosstalk is essential for the production and functional modulation of blood-cell lineages. Whether, and if so how, the microbiota influences hematopoietic stem cells (HSCs) is unclear. Here, we show that the microbiota regulates HSC self-renewal and differentiation under stress conditions by modulating local iron availability in the bone marrow (BM). In microbiota-depleted mice, HSC self-renewal was enhanced during regeneration, while the commitment toward differentiation was dramatically compromised. Mechanistically, microbiota depletion selectively impaired the recycling of red blood cells (RBCs) by BM macrophages, resulting in reduced local iron levels without affecting systemic iron homeostasis. Limiting iron availability in food (in vivo) or in culture (ex vivo), or by CD169+ macrophage depletion, enhanced HSC self-renewal and expansion. These results reveal an intricate interplay between the microbiota, macrophages, and iron, and their essential roles in regulating critical HSC fate decisions under stress.

Keywords: erythrophagocytosis; fate decision; hematopoietic regeneration; hematopoietic stem cell; iron; macrophage; microbiota; self-renewal.


Conflict of interest statement

Declaration of interests The authors declare no competing interests.

Figures

Figure 1.
Figure 1.. Microbiota depletion leads to impaired HSC response in regenerative condition
(A) Neutrophils in the blood of control and ABX-treated mice after 5FU challenge (n = 6–27). See also Figure S1D. (B–D) Total cellularity, cell lineages, Lin cells, MPPs and HSCs in the BM of control and ABX-treated mice at day 12 after 5FU challenge (n = 12–32). See also Figure S1F–G for erythroblasts and time-course analysis of HSCs. (E) BMT analysis of control and ABX-treated mice under steady state or at day 12 after 5FU treatment (n = 5–7). See also Figure S1H–I for multi-lineage reconstitution and the HSCT analysis. * p < 0.05, ** p < 0.01, *** p < 0.001. Error bars, mean ± SEM. See also Figure S1 and S2 for steady-state and early time-point analyses and the germ-free model.
Figure 2.
Figure 2.. The microbiota regulates HSC response in different stress conditions
(A–C) Cell lineages, Lin cells, MPPs and HSCs in the BM of control and ABX-treated mice at day 24 after sublethal TBI (n = 4–5). See also Figure S2G. (D–E) BMT and HSCT analyses of control and ABX-treated mice under steady state or at day 24 after sublethal TBI (n = 4–9). (F) HSCs in the blood and BM of control and ABX-treated mice following G-CSF treatment (n = 6–8). (G–I) LSK cells and HSCs in the BM of control and ABX-treated mice following E. coli infection or LPS challenge (n = 3–4). See also Figure S2H–I. * p < 0.05, ** p < 0.01, *** p < 0.001. Error bars, mean ± SEM. See also Figure S3 for niche, HSC localization, and cytokine availability analyses.
Figure 3.
Figure 3.. The microbiota regulates erythrophagocytosis and iron availability in the BM during regeneration
(A) Biotin pulse-chase labelling to evaluate RBC clearance in control and ABX-treated mice after 5FU challenge (n = 4–10). (B) Time-course analysis of macrophages in the BM of control and ABX-treated mice after 5FU challenge (n = 6–16). See also Figure S4B and S4C for gene expression analyses and splenic macrophages. (C–D) Adoptive transfer of GFP+ RBCs to evaluate RBC clearance and phagocytosis by macrophages in the BM under steady state or in the early phase of regeneration (day 3–5; n = 7–11). See also Figure S4D–G for other tissues and later time points. (E) Iron levels in the BM, spleen and liver of control and ABX-treated mice under steady state or at day 12 after 5FU challenge (n= 8–19). (F) CD71 levels on HSCs in control and ABX-treated mice under steady state or at day 12 after 5FU challenge (n= 18–22). See also Figure S4H–J for germ-free and sublethal irradiation models. * p < 0.05, ** p < 0.01, *** p < 0.001. Error bars, mean ± SEM. See also Figure S4K for systemic iron parameters.
Figure 4.
Figure 4.. CD169+ BM macrophages control the delivery of iron to HSCs for regeneration
(A) RBCs in the blood of control and CD169-DTR mice after 5FU challenge (n = 9–13). (B–C) BM macrophages and iron levels in the BM and sera of control and CD169-DTR mice under steady state or at day 12 after 5FU challenge (n = 4–15). See also Figure S5A for iron levels in other tissues. (D–F) BM cellularity, neutrophils, Lin cells, HSCs, and long-term reconstitution following BMT in control and CD169-DTR mice under steady state or at day 12 after 5FU challenge (n = 6–15). See also Figure S5B–E. (G–H) BM iron levels, Lin cells, and HSCs in control and CD169-DTR mice with or without ABX treatment at day 12 after 5FU challenge (n = 4–10). See also Figure S5F. * p < 0.05, ** p < 0.01, *** p < 0.001; ns, not significant. Error bars, mean ± SEM.
Figure 5.
Figure 5.. The microbiota orchestrates regenerative events in the BM via short-chain fatty acid butyrate
(A–B) BM cellularity, neutrophils, Lin cells, and HSCs in control, Tlr4−/−, Tlr2 −/− and LysM-Cre/Myd88fl/fl mice at day 12 after 5FU challenge (n = 5–14). See also Figure S5G–J for additional mouse models and the LPS add-back experiment. (C–E) RBC phagocytosis by bone marrow-derived macrophages ex vivo in the presence of microbial metabolites or HDAC inhibitors (n = 7–9). See also Figure S6A and S6B. (F–G) RBC phagocytosis in control, ABX-treated and ABX-treated mice supplemented with butyrate, in the early phase of regeneration (day 3–5; n = 6–8). See also Figure S6E for gene expression analyses. (H–K) BM iron levels, neutrophils, Lin cells, HSCs, and long-term reconstitution following BMT in control, ABX-treated and ABX-treated mice supplemented with butyrate, at day 12 after 5FU treatment (n = 6–16). See also Figure S6F–H. * p < 0.05, ** p < 0.01, *** p < 0.001; ns, not significant. Error bars, mean ± SEM.
Figure 6.
Figure 6.. Iron availability regulates HSC self-renewal and differentiation during regeneration
(A–C) Neutrophils, Lin cells, HSCs, and long-term reconstitution following BMT in mice fed with normal, iron-low or iron-deficient food, at day 12 after 5FU challenge (n= 8–11). See also Figure S7D–G. (D–E) Neutrophils, Lin cells, HSCs and HSC cell cycling in the BM of ABX-treated mice fed with normal, iron-low or iron-deficient food, at day 12 after 5FU treatment (n = 4–9). (F–H) Neutrophils, Lin cells, HSCs, and long-term reconstitution following BMT in control and ABX-treated mice injected with PBS or iron dextran, at day 12 after 5FU challenge (n = 5–14). See also Figure S7H–L. * p < 0.05, ** p < 0.01, *** p < 0.001; ns, not significant. Error bars, mean ± SEM. See also Figure S7 for steady-state analyses of the iron deficiency model.
Figure 7.
Figure 7.. Limiting iron availability stimulates HSC self-renewal and expansion ex vivo
(A–B) Total cell and CD150+ HSC numbers in the PVA-based culture system with defined transferrin levels (n = 7–8). (C–D) Lin cell ratio, cell cycling and ROS production of HSCs in the PVA-based culture system with defined transferrin levels (n = 4–8). (E) Transplantation analysis of HSCs expanded with 500 mg/L or 0.5 mg/L transferrin (n = 4–5). (F) Model figure showing a Goldilocks zone for HSC ex vivo expansion, with higher or lower iron levels impairing HSC self-renewal. * p < 0.05, ** p < 0.01, *** p < 0.001. Error bars, mean ± SEM.

Comment in

References

    1. Asada N, Kunisaki Y, Pierce H, Wang Z, Fernandez NF, Birbrair A, Ma’ayan A, and Frenette PS (2017). Differential cytokine contributions of perivascular haematopoietic stem cell niches. Nat Cell Biol 19, 214–223. - PMC - PubMed
    1. Bacchetti De Gregoris T, Aldred N, Clare AS, and Burgess JG (2011). Improvement of phylum- and class-specific primers for real-time PCR quantification of bacterial taxa. J Microbiol Methods 86, 351–356. - PubMed
    1. Baldridge MT, King KY, Boles NC, Weksberg DC, and Goodell MA (2010). Quiescent haematopoietic stem cells are activated by IFN-gamma in response to chronic infection. Nature 465, 793–797. - PMC - PubMed
    1. Balmer ML, Schurch CM, Saito Y, Geuking MB, Li H, Cuenca M, Kovtonyuk LV, McCoy KD, Hapfelmeier S, Ochsenbein AF, et al. (2014). Microbiota-derived compounds drive steady-state granulopoiesis via MyD88/TICAM signaling. J Immunol 193, 5273–5283. - PubMed
    1. Belkaid Y, and Hand TW (2014). Role of the microbiota in immunity and inflammation. Cell 157, 121–141. - PMC - PubMed

Publication types

LinkOut - more resources