. 2022 Aug;29(8):1486-1499.
doi: 10.1038/s41418-022-00936-x. Epub 2022 Jan 22.

T cell apoptosis characterizes severe Covid-19 disease

Affiliations

T cell apoptosis characterizes severe Covid-19 disease

Sonia André et al. Cell Death Differ. 2022 Aug.

Abstract

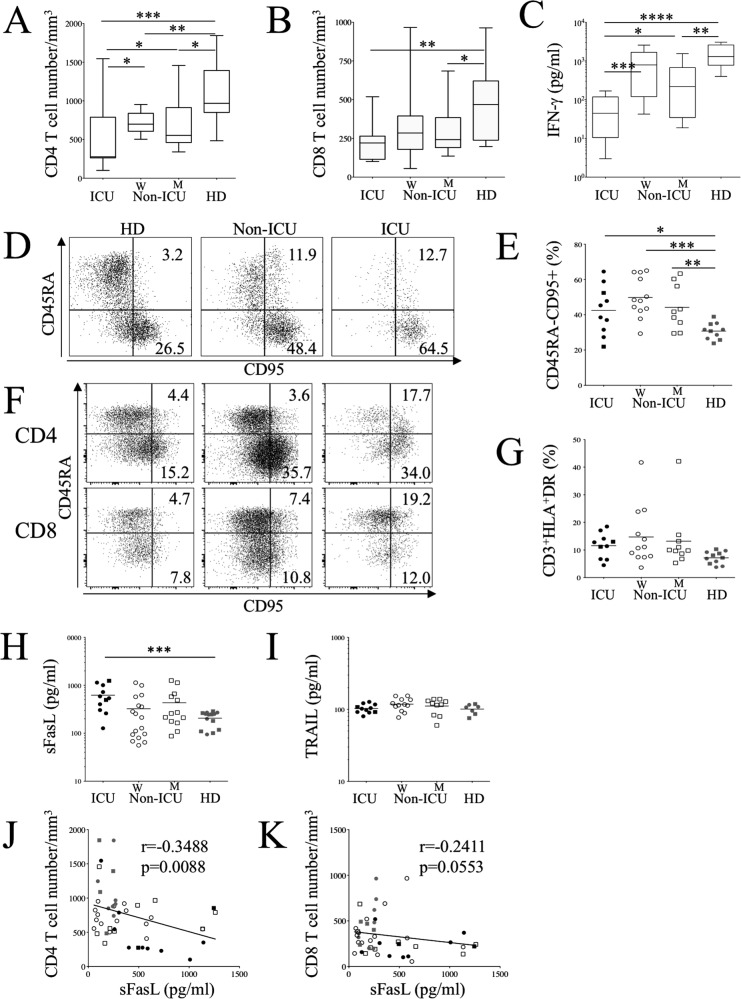
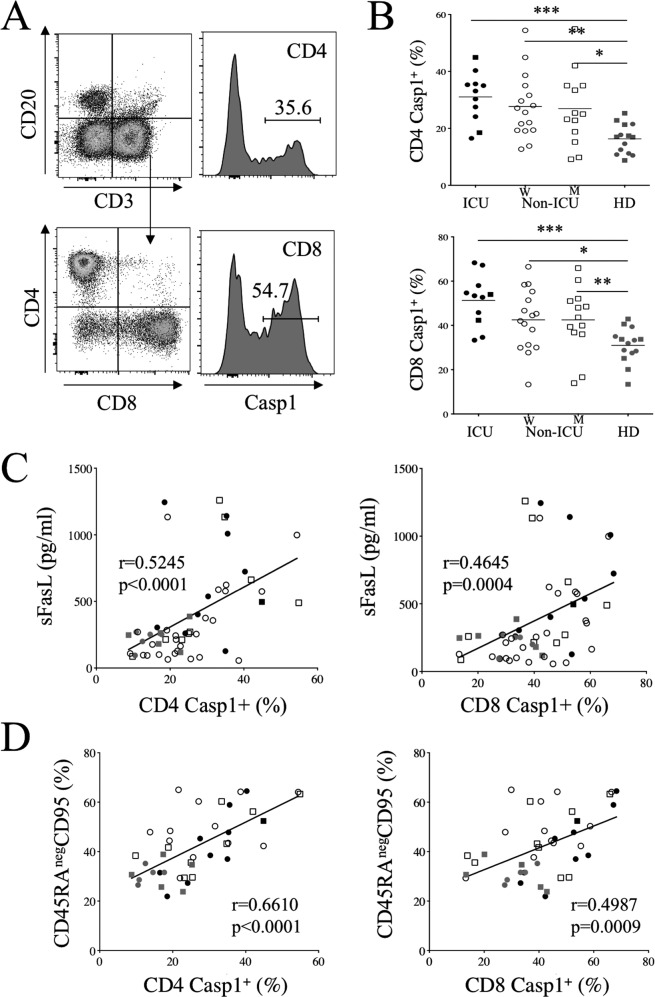
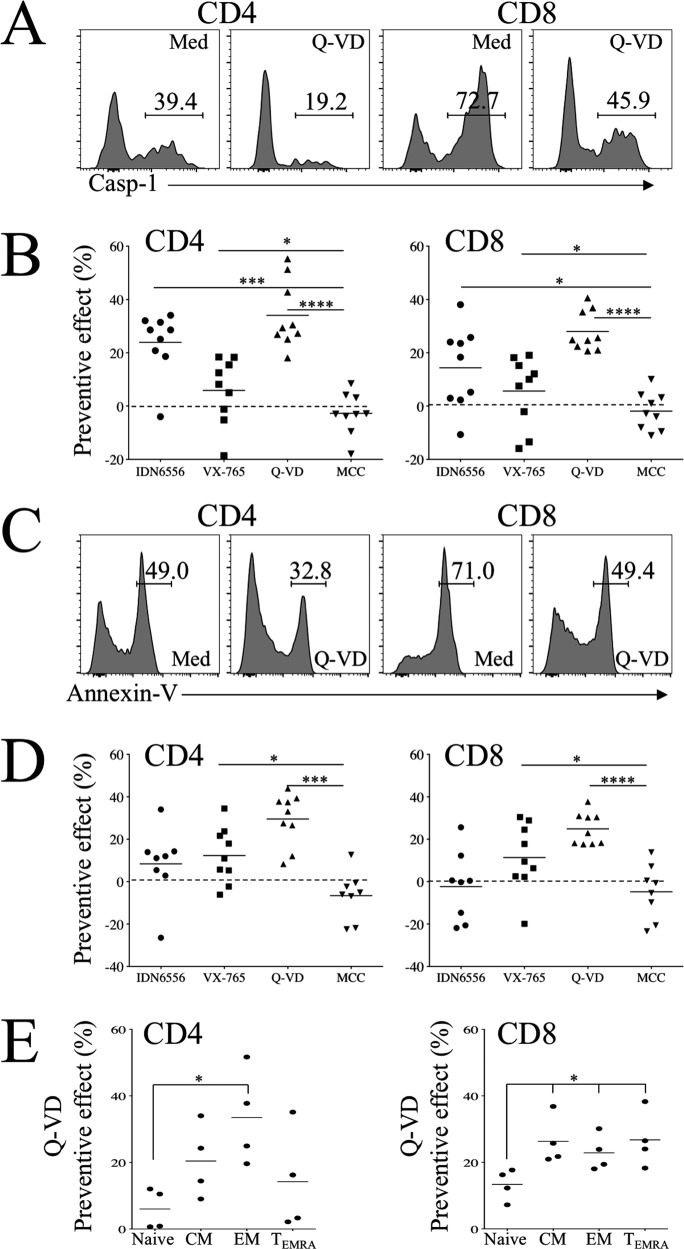
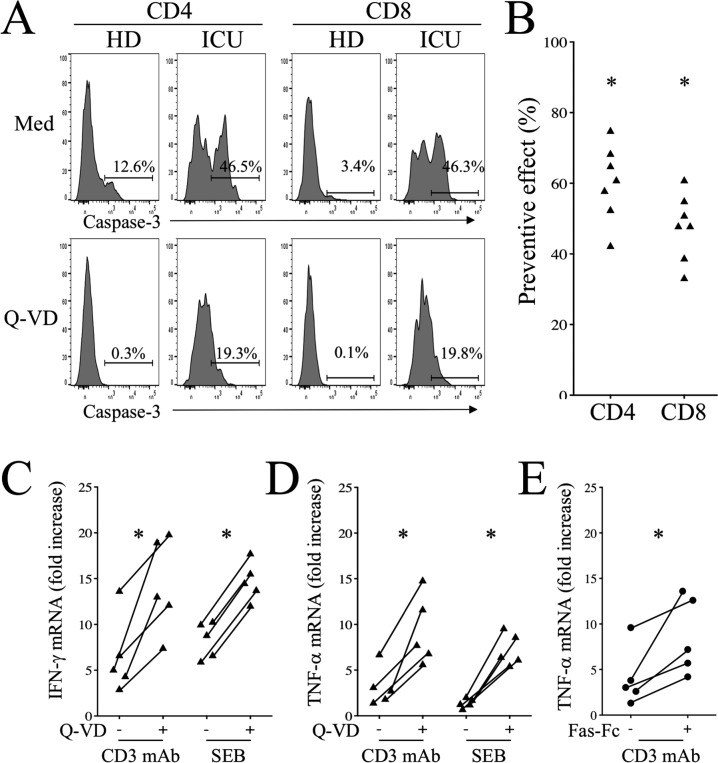
Severe SARS-CoV-2 infections are characterized by lymphopenia, but the mechanisms involved are still elusive. Based on our knowledge of HIV pathophysiology, we hypothesized that SARS-CoV-2 infection-mediated lymphopenia could also be related to T cell apoptosis. By comparing intensive care unit (ICU) and non-ICU COVID-19 patients with age-matched healthy donors, we found a strong positive correlation between plasma levels of soluble FasL (sFasL) and T cell surface expression of Fas/CD95 with the propensity of T cells to die and CD4 T cell counts. Plasma levels of sFasL and T cell death are correlated with CXCL10 which is part of the signature of 4 biomarkers of disease severity (ROC, 0.98). We also found that members of the Bcl-2 family had modulated in the T cells of COVID-19 patients. More importantly, we demonstrated that the pan-caspase inhibitor, Q-VD, prevents T cell death by apoptosis and enhances Th1 transcripts. Altogether, our results are compatible with a model in which T-cell apoptosis accounts for T lymphopenia in individuals with severe COVID-19. Therefore, a strategy aimed at blocking caspase activation could be beneficial for preventing immunodeficiency in COVID-19 patients.


Conflict of interest statement

The authors declare no competing interests.

Figures

Fig. 1
Fig. 1. CD95 and soluble FasL correlate with lymphopenia in COVID 19 patients.
A, B CD4 and CD8 T cell numbers in ICU, non-ICU patients and HDs. C PBMCs were stimulated with anti-CD3 and anti-CD28 mAbs for 48 h and IFN-γ was quantified in culture supernatants. D Dot-plots showing CD95 expression on memory (CD45RA-) T cells assessed by flow cytometry. E Percentages of memory T cells expressing CD95. F Dot-plots showing CD95 expression on memory (CD45RA-) CD4 and CD8 T cells. G Percentages of activated T cells (HLA-DR expression). H, I Plasma levels of sFasL and TRAIL in the different groups of patients. Each dot represents one individual. Marker shape represents gender (round: women; square: men). Statistical analysis was performed using a Mann–Whitney U test. *p < 0.05, **p < 0.01, and ***p < 0.001). J, K Correlation between CD4 and CD8 T cell numbers and sFasL. Values of Spearman correlation are shown in the panels.
Fig. 2
Fig. 2. Caspase activation in T cells correlates with CD95 and soluble FasL in COVID 19 patients.
A Caspase activity of CD4 and CD8 T cells was quantified by flow cytometry using fluorescent caspase-1 substrate. B Percentages of CD4 and CD8 T cells expressing fluorescent caspase substrates are shown. Each dot represents one individual. Marker shape represents sex gender (rounded: women; squared: men). Statistical analysis was performed using a Mann–Whitney U test. *p < 0.05, **p < 0.01, and ***p < 0.001). C Correlation between sFasL and caspase-1 activation in CD4 and CD8 T cells. D Correlation between the percentages of CD45RA- T cells expressing CD95 and caspase-1 activation in CD4 and CD8 T cells. Values of Spearman correlation are shown in the panels.
Fig. 3
Fig. 3. Memory CD4 and CD8 T cells are more prone to dying by apoptosis in COVID 19 patients.
A Percentages of CD4+ and CD8+ T cells expressing annexin V. Phosphatidyl serine exposure was assessed by flow cytometry in ICU, non-ICU patients and HDs. Each dot represents one individual. B Subsets of CD4 and CD8 T cells were defined using CD45RA and CD27. C Representative staining of annexin V in the different subsets of CD4 and CD8 T cells. D Histograms show the means ± SEM of CD4 and CD8 T cell subsets from four HDs and four ICU patients. Statistical analysis was performed using a Mann–Whitney U test (*p < 0.05, **p < 0.01, ***p < 0.001, and ****p < 0.0001).
Fig. 4
Fig. 4. Lymphopenia correlates with caspase activation in COVID-19 patients.
A Correlation between CD4 T cell numbers and caspase activity in CD4 and CD8 T cells. B Correlation between CD8 T cell numbers and caspase activity in CD4 and CD8 T cells. Values of Spearman correlation are shown in the panels. C, D Expression of mRNA coding for Bax, Bak, Bcl-2, RIP1, RIP3 and MLKL genes in purified CD4 and CD8 T cells. Each dot represents a pool of three COVID-19 individuals due to the limited amounts of cells. Results are expressed as fold increase in comparison with the mean values of three HD pools as shown by the dotted line. Statistical analysis was performed using a paired Mann–Whitney U test.
Fig. 5
Fig. 5. Correlation between CXCL10 and caspase activity in COVID 19 patients.
A Boxplots of the eight most informative cytokine biomarkers ranked by information gain using Biocomb R package. Y-axis shows cytokine concentration (pg/mL). Colors represent patient groups (orange: HDs; gray: non-ICU; blue: ICU) and marker shape represents gender (square: men Boxplot2; round: women Boxplot3). Significant variations between groups based on Student’s t-test are showed above each graph (*p < 0.05; **p < 0.01; ***p < 0.001; ****p < 0.0001). B AUCs of pROC were computed using Meval R package by adding genes, ranked by information gain using Biocomb R package, to a naïve Bayes model computed with the R caret Package. C Principal Component Analysis performed with R software based on a short cytokine signature (CXCL10, HGF, IL-1Ra and sCD14). Ellipses were calculated by R and correspond to a 95% interval. D Heatmap on cytokine concentration values for each sample with Ward’s hierarchical clustering in rows (cytokine) and columns (patients – HDs (orange); non-ICU (gray); ICU (blue)). E, F Correlation between levels of CXCL10 and plasma sFasL and between caspase activity in CD4 T cells. Values of Spearman correlation are shown in the panels.
Fig. 6
Fig. 6. Inhibition of caspase prevents T cell apoptosis.
A Flow cytometry of CD4 and CD8 T cells expressing caspase activity in the absence (Med) or presence of Q-VD-Oph. B Inhibition of caspase activity (preventive effect) in the presence of IDN6556, VX-765, Q-VD and MCC950. Percentages were calculated as follows: (Med-Inh/Med)*100. Each dot represents one individual. C Flow cytometry of CD4 and CD8 T cells expressing annexin V in the absence (Med) or presence of Q-VD. D Inhibition of apoptosis in the presence of IDN6556, VX-765, Q-VD and MCC950. Percentages were calculated as follows: (Med-Inh/Med)*100. E Inhibition of T cell subsets to undergo death in the presence of Q-VD. Each dot represents one individual. Statistical analysis was performed using a Mann–Whitney U test (*p < 0.05, ***p < 0.001, and ****p < 0.0001).
Fig. 7
Fig. 7. Caspase-3 inhibition enhances Th1 mRNA expression.
A Flow cytometry of CD4 and CD8 T cells expressing active caspase-3 (Caspase-3 mAb) in the absence (Med) or presence of Q-VD. B Inhibition of active caspase3 (preventive effect) in the presence of Q-VD. Percentages were calculated as follows: (Med-Inh/Med)*100. Each dot represents one individual. C, D IFN-γ and TNF-α mRNA expression in cells activated with either CD3 mAbs or SEB in the absence or presence of Q-VD. Results are expressed as fold increases compared to unstimulated cells. E TNF-α mRNA expression in cells activated with CD3 mAbs in the absence or presence of Fas-Fc. Each dot represents one individual. Statistical analysis was performed using a paired Mann–Whitney U test (*p < 0.05).
Fig. 8
Fig. 8. Inhibition of caspase prevents FasL-mediated T cell death.
Flow cytometry of CD4 (A) and CD8 T cells (B) expressing annexin-V in the absence (Med) or presence of recombinant human FasL (rhFasL, 200 ng/ml). C, D Q-VD reduced CD4 and CD8 T cell death in the presence of rhFasL Histograms show the percentages of CD4 (C) and CD8 T cells (D) expressing annexin-V. Each dot represents one individual. Statistical analysis was performed using a paired Mann–Whitney U test (**p < 0.01).

References

    1. Worobey M. Dissecting the early COVID-19 cases in Wuhan. Science. 2021;374:1202–4. - PubMed
    1. Takahashi T, Ellingson MK, Wong P, Israelow B, Lucas C, Klein J, et al. Sex differences in immune responses that underlie COVID-19 disease outcomes. Nature. 2020;588:315–20. - PMC - PubMed
    1. Tang N, Li D, Wang X, Sun Z. Abnormal coagulation parameters are associated with poor prognosis in patients with novel coronavirus pneumonia. J Thromb Haemost. 2020;18:844–7. - PMC - PubMed
    1. Zhou F, Yu T, Du R, Fan G, Liu Y, Liu Z, et al. Clinical course and risk factors for mortality of adult inpatients with COVID-19 in Wuhan, China: a retrospective cohort study. Lancet. 2020;395:1054–62. - PMC - PubMed
    1. Sims JT, Krishnan V, Chang CY, Engle SM, Casalini G, Rodgers GH, et al. Characterization of the cytokine storm reflects hyperinflammatory endothelial dysfunction in COVID-19. J Allergy Clin Immunol. 2021;147:107–11. - PMC - PubMed

Publication types