. 2022 Apr;31(4):918-932.
doi: 10.1002/pro.4281. Epub 2022 Feb 23.

Structure, dynamics, and stability of the globular domain of human linker histone H1.0 and the role of positive charges

Affiliations

Structure, dynamics, and stability of the globular domain of human linker histone H1.0 and the role of positive charges

Jacob H Martinsen et al. Protein Sci. 2022 Apr.

Abstract

Linker histone H1 (H1) is an abundant chromatin-binding protein that acts as an epigenetic regulator binding to nucleosomes and altering chromatin structures and dynamics. Nonetheless, the mechanistic details of its function remain poorly understood. Recent work suggest that the number and position of charged side chains on the globular domain (GD) of H1 influence chromatin structure and hence gene repression. Here, we solved the solution structure of the unbound GD of human H1.0, revealing that the structure is almost completely unperturbed by complex formation, except for a loop connecting two antiparallel β-strands. We further quantified the role of the many positive charges of the GD for its structure and conformational stability through the analysis of 11 charge variants. We find that modulating the number of charges has little effect on the structure, but the stability is affected, resulting in a difference in melting temperature of 26 K between GD of net charge +5 versus +13. This result suggests that the large number of positive charges on H1-GDs have evolved for function rather than structure and high stability. The stabilization of the GD upon binding to DNA can thus be expected to have a pronounced electrostatic component, a contribution that is amenable to modulation by posttranslational modifications, especially acetylation and phosphorylation.

Keywords: CD; NMR; histone; nucleosome; protein electrostatics; protein stability; protein structure.


Figures

FIGURE 1
FIGURE 1
Binding modes and primary structures of H1‐GDs. (a) Sketches of bound H1‐GD (blue), the core histone oligomer (green) and DNA (purple), and their assembly to form a nucleosome or a chromatosome. The GD is folded into the classical “winged” helix‐turn‐helix DNA binding motif with two antiparallel β‐strands, β1 and β2, in the C‐terminus, connected by a loop (the β‐hairpin). The dyad axis is oriented along the center of the nucleosome and through the central basepair of the DNA. The on‐dyad and off‐dyad binding modes of the GD are sketched on the right. (b) IDDomainSpotter profiles of human linker histone H1.0. Profiles display scores for +(Ser, Thr, Ala) (orange), +(Pro) (yellow), +(Arg, Lys) (blue), +(Arg, Lys)‐(Asp, Glu) calculated over a 15‐residue window. (c) Sequences of the seven somatic isoforms of human H1‐GD. The predicted pIs of the various isoforms are between 10.2 and 10.3 (not shown). (d) Sequences of H1‐GD (H5 from G. gallus) from different species. “A. Missis.” is abbreviation for “Aligator mississippiensis.” Asp and Glu are highlighted with red shading, Lys and Arg with blue shading, and His with purple shading
FIGURE 2
FIGURE 2
Comparison of the structure and stability of human H1.0 and hH1.0GD. (a) Domain arrangement of human H1.0, with the primary structure of the hH1.0GD shown below. Note that a Gly remains at the N‐terminal from TEV cleavage. (b) Thermal denaturation followed by far‐UV CD spectroscopy as changes in Θ222 nm as a function of temperature for full H1.0 (light blue) and hH1.0GD (blue). The extracted Tm values are shown as inserts. (c) Overlay of 1H,15N‐HSQC spectra of full H1.0 (light blue) and hH1.0GD (blue). (d) Assigned 1H,15N‐HSQC spectrum of hH1.0GD, acquired at an ionic strength of 165 mM, pH 7.4, 10°C
FIGURE 3
FIGURE 3
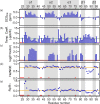
Secondary structure and dynamics of hH1.0GD. (a) Cα‐derived secondary chemical shifts of hH1.0GD. (b) Amide temperature coefficients derived from amide chemical shift changes as a function of temperature from 278 to 323 K. Values below the green line at −4.6 ppb/K are generally considered to be indicative of hydrogen bonds. Purple stars highlight residues with nonlinear behavior. (c) Amide H/D exchange protection factors. Light red stars indicate residues that exchange faster than the experiment dead time. (d) Heteronuclear NOE values of hH1.0GD at 600 MHz. The orange line represents the average (0.73). (e) Ratios of transverse (R 2) and longitudinal (R 1) 15N‐relaxation rates of hH1.0GD at 600 MHz. Error bars are derived from the fits and the orange line represents the average (5.7). Unless otherwise specified, data were acquired at an ionic strength of 165 mM, pH 7.4, 10°C. Gray shading highlight regions populating secondary structures, and in a, b, d, and e, red stars indicate missing data points
FIGURE 4
FIGURE 4
Solution structure of hH1.0GD. (a) Ribbon structure of the 20 lowest energy structures of hH1.0GD, having a backbone RMSD of 0.41 Å. (b,c) Lowest energy‐structure of hH1.0GD from two different angles, with Lys and Arg highlighted in blue
FIGURE 5
FIGURE 5
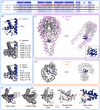
Comparison of GD structures from species with >80% sequence identity to hH1.0GD and their complexes. (a) Alignment of GD sequences (residues 24–97 of the human H1) from human, X. laevis and G. gallus by Clustal Omega, with sequence identity to hH1.0GD shown to the right. The secondary structure elements of human hH1.0GD (PDB: 6hq1) are highlighted with blue boxes, orange boxes highlight the region close to Impβ in the human H1.0‐Imp7:Impβ complex (PDBs: 6n88, 6n89), and residues in contact with DNA in a GD–chromatosome complex (PDB: 7k5x) are highlighted in purple. (b) Unbound hH1.0GD structure (PDB: 6hq1, blue) (top), superimposed with complexed human GD structures (middle, gray) and unbound and complexed GD structures with sequence identity to hH1.0GD > 80% (X. laevis‐ or G. gallus GD) (bottom, gray). The Cα RMSD to PDB: 6hq1 (residues 26–94 in human) of each structure is shown in parenthesis. (c) Complex between human H1.0 and a chromatosome at 2.9 Å (PDB: 7k5x 18 ), at two different angles, and with the GD structure highlighted in the right panel. L4 is highlighted with yellow shading. (d) Human H1‐Imp7:Impβ complex at 6.2 Å (PDB: 6n88, Imp7 not shown for clarity), at two different angles, and with the GD structure highlighted in the right panel. The orientation of the GD in the right panels of (c) and (d) is identical to the hH1.0GD structures in the gray box insert. (e) The “open” and “closed” states of the L4 of the β‐hairpin. From the left: 1) overlay of all the GD structures in open state (PDB: 6hq1; blue, PDB: 1hstA; grey, PDB: 7dbp; orange). 2) overlay of all the bound GD structures (PDBs: 6n88, 6n89, 7k5x, 6la8, 6la9, 7dbp, 5 nl0, 4qlc, 5wcu) and PDB: 1hstB, which are all in the closed state except PDB: 7dbp (highlighted in orange). 3 + 4) PDB: 7k5x from two angles as example of the closed state, with side chains of L4 and α3 in proximity in the closed state shown as sticks and distances between selected residues in orange. 5) PDB: 6hq1 from the same angle as in 4), highlighting the larger distance between corresponding selected residues of α3 and L4 in the open state
FIGURE 6
FIGURE 6
Effect of charges on hH1.0GD stability. (a) Overview of the position of residues with charged side chains in the primary and tertiary structure of hH1.0GD. (b) Overview of variants, their substitutions, net charge and the measured Tms. (c) Tm plotted against net charge of the variants. (d) Thermal stability of WT hH1.0GD as a function of the square root of the ionic strength

References

    1. Millard PS, Bugge K, Marabini R, Boomsma W, Burow M, Kragelund BB. IDDomainSpotter: Compositional bias reveals domains in long disordered protein regions—Insights from transcription factors. Protein Sci. 2020;29:169–183. - PMC - PubMed
    1. Luger K, Mäder AW, Richmond RK, Sargent DF, Richmond TJ. Crystal structure of the nucleosome core particle at 2.8 Å resolution. Nature, 1997;389:251–260. 10.1038/38444 - DOI - PubMed
    1. Fyodorov DV, Zhou B, Skoultchi AI, Bai Y. Emerging roles of linker histones in regulating chromatin structure and function. Nat Rev Mol Cell Biol. 2018;19:192–206. - PMC - PubMed
    1. van Emmerik CL, van Ingen H. Unspinning chromatin: Revealing the dynamic nucleosome landscape by NMR. Prog Nucl Magn Reson Spectrosc. 2019;110:1–19. - PubMed
    1. Cutter AR, Hayes JJ. A brief review of nucleosome structure. FEBS Lett. 2015;589:2914–2922. - PMC - PubMed

Publication types