. 2022 Feb;41(8):1190-1202.
doi: 10.1038/s41388-021-02157-x. Epub 2022 Jan 24.

SOX2 mediates metabolic reprogramming of prostate cancer cells

Affiliations

SOX2 mediates metabolic reprogramming of prostate cancer cells

Larischa de Wet et al. Oncogene. 2022 Feb.

Erratum in

  • Correction to: SOX2 mediates metabolic reprogramming of prostate cancer cells.
    de Wet L, Williams A, Gillard M, Kregel S, Lamperis S, Gutgesell LC, Vellky JE, Brown R, Conger K, Paner GP, Wang H, Platz EA, De Marzo AM, Mu P, Coloff JL, Szmulewitz RZ, Vander Griend DJ. de Wet L, et al. Oncogene. 2022 Feb;41(8):1234. doi: 10.1038/s41388-022-02228-7. Oncogene. 2022. PMID: 35145235 No abstract available.

Abstract

New strategies are needed to predict and overcome metastatic progression and therapy resistance in prostate cancer. One potential clinical target is the stem cell transcription factor SOX2, which has a critical role in prostate development and cancer. We thus investigated the impact of SOX2 expression on patient outcomes and its function within prostate cancer cells. Analyses of SOX2 expression among a case-control cohort of 1028 annotated tumor specimens demonstrated that SOX2 expression confers a more rapid time to metastasis and decreased patient survival after biochemical recurrence. SOX2 ChIP-Seq analyses revealed SOX2-binding sites within prostate cancer cells which differ significantly from canonical embryonic SOX2 gene targets, and prostate-specific SOX2 gene targets are associated with multiple oncogenic pathways. Interestingly, phenotypic and gene expression analyses after CRISPR-mediated deletion of SOX2 in castration-resistant prostate cancer cells, as well as ectopic SOX2 expression in androgen-sensitive prostate cancer cells, demonstrated that SOX2 promotes changes in multiple metabolic pathways and metabolites. SOX2 expression in prostate cancer cell lines confers increased glycolysis and glycolytic capacity, as well as increased basal and maximal oxidative respiration and increased spare respiratory capacity. Further, SOX2 expression was associated with increased quantities of mitochondria, and metabolomic analyses revealed SOX2-associated changes in the metabolism of purines, pyrimidines, amino acids and sugars, and the pentose phosphate pathway. Analyses of SOX2 gene targets with central functions metabolism (CERK, ECHS1, HS6SDT1, LPCAT4, PFKP, SLC16A3, SLC46A1, and TST) document significant expression correlation with SOX2 among RNA-Seq datasets derived from patient tumors and metastases. These data support a key role for SOX2 in metabolic reprogramming of prostate cancer cells and reveal new mechanisms to understand how SOX2 enables metastatic progression, lineage plasticity, and therapy resistance. Further, our data suggest clinical opportunities to exploit SOX2 as a biomarker for staging and imaging, as well as a potential pharmacologic target.


Conflict of interest statement

Conflicts of Interest: None

DECLARATION OF INTERESTS

The authors declare no competing interests.

Figures
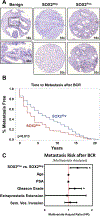
Figure 1:
Figure 1:. SOX2 Expression in Primary Prostate Tumors is Associated with Rapid Time to Metastasis and Prostate Cancer-Specific Mortality.
A) Representative images of SOX2 staining in prostate tissue. Benign glands (left panels) document basal epithelial staining (10x and 40x). SOX2-negative (middle panels) and SOX2-positive (right panels) tissues were scored and analyzed from a cohort of 726 annotated patient specimens (726-case PSA progression TMA). B) Kaplan-Meier curves of time to radiographic metastases after biochemical recurrence between SOX2-positive and SOX2-negative tumors after biochemical recurrence (BCR). C) Multivariate hazard ratios of metastasis risk between SOX2-positive and SOX2-negative tumors. Cox proportional-hazards model combining age, PSA, Gleason grade, extraprostatic extension, and seminal vesicle invasion shows significant association with tumor SOX2 expression and metastasis risk in addition to the expected metastatic risk factors Gleason grade, extraprostatic extension, and seminal vesicle invasion. Bars represent 95% confidence intervals (*p<0.05).
Figure 2:
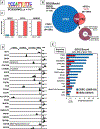
Figure 2:. SOX2 ChIP-Seq in Castration-Resistant Prostate Cancer (CRPC) Cells Reveals Multiple Non-Stem Cell Gene Targets.
A) Motif analyses of SOX2 binding in CWR-R1 CRPC cells demonstrates canonical binding. B) Comparison of SOX2 binding sites between CWR-R1 CRPC cells and WA01 human embryonic stem cells (hESCs). Number represents binding within 5 kilobase pairs (5 kbp) of gene transcriptional start sites (TSS). Of the 798 overlapping SOX2 gene targets between CRPC cells and hESCs, 93.4% demonstrated unique SOX2 binding sites within the gene promoter (>10 bp apart), and only 6.6% had identical binding sites between cell types. C) Comparison of mRNA expression of canonical stem cell transcription factors SOX2, OCT4, and NANOG in CWR-R1 CRPC cells and WA01 hESCs. Graphed as transcripts per million (TPM). Lack of detectable expression of OCT4 and NANOG in CRPC cells suggests novel SOX2-binding partners in prostate cancer cells. D) Prostate cancer-specific SOX2 binding sites in CWR-R1 CRPC cells of genes of potential interest, many of which have documented roles in prostate cancer growth and progression. It should be noted that binding does not necessarily imply regulation. E) Pathway analyses comparing SOX2-bound genes in CWR-R1 CRPC cells and hESCs demonstrate potential differential cancer pathway regulation by SOX2 in prostate cancer cells.
Figure 3:
Figure 3:. SOX2 Deletion in Castration-Resistant Prostate Cancer (CRPC) Cells Decreases Cell Growth and Invasion.
A) CRISPR-mediated deletion of SOX2 in CWR-R1 CRPC cells. Left panel: Western blot of three clonal lines of CWR-R1 CRPC cells with deleted SOX2 (SOX2KO) in the absence and presence of the anti-androgen enzalutamide. Protein expression of androgen receptor (AR) and AR splice variant 7 (AR-V7) were unchanged. Actin was used as a loading control. Right panel: SOX2 mRNA levels in the three clonal lines. Clone #1 was used for downstream analyses due to its very low SOX2 mRNA expression and undetectable protein expression. B) Growth and sensitivity of SOX2KO cells. Growth curves of CWR-R1 CRPC cells (control) and CWR-R1-SOXKO cells (SOXKO) in the presence or absence of enzalutamide. C) Cell cycle distribution (BrdU incorporation vs. propidium iodide) of control and SOX2KO cells under normal growth conditions or upon treatment with enzalutamide (*p<0.05). D) Transwell migration of SOX2KO cells compared to control cells. Cells were plated in triplicate in transwell plates and were treated with aphidocolin to minimize effects of proliferation (*p<0.05). E) Comparison of cell viability or apoptosis of control vs. SOX2KO CWR-R1 CRPC cells in propidium iodide (PI) exclusion, TUNEL, and apoptosis assays (NS=not significant). F) Kaplan-Meier curves of survival of hormonally-intact male nude mice with xenografts of CWR-R1-control or SOX2KO cells.
Figure 4:
Figure 4:. SOX2 is Associated with Changes in Cellular Metabolism in Prostate Cancer Cells, Tumors, and Metastases.
A) Comparative RNA-Seq analyses of CWR-R1-Control vs. SOX2KO cells. Differentially expressed genes (DEGs) between control and SOX2KO cells document 2,449 total genes differentially expressed by >1.5-fold. Additional analyses of SOX2 ChIP-Seq data demonstrate a cohort of 781 genes that were SOX2-bound (ChIP-Seq) and differentially expressed when SOX2 was deleted (RNA-Seq). B) Directional analyses of DEGs, including SOX2-bound DEGs, upon SOX2 deletion. C) Gene Set Enrichment Analysis (GSEA) of RNA-Seq datasets prioritizes multiple pathways associated with cellular metabolism. D) Heatmap of SOX2-bound genes prioritized using GSEA Leading Edge analyses. Data represent TPM values of RNA-Seq triplicates. E) Comparative analyses of SOX2-positive vs. SOX2-negative LNCaP cells with reduced RB and p53 expression also document changes in metabolic-associated SOX2-bound genes. F) Clinical correlation of SOX2-bound DEGs involved in metabolism using publicly available TCGA data. Data demonstrate significant and directional correlation between SOX2 mRNA expression and prioritized metabolic SOX2-target genes. G) Analyses of mRNA expression of metabolic SOX2-target genes between prostate tumors and metastases. Values represent mean fragments per kilobase of transcript per million mapped reads (FPKM) expression from RNA-Seq data from tumors (n=25) and metastases (N=53).
Figure 5:
Figure 5:. SOX2 Expression Promotes Increased Glycolysis, Oxidative Phosphorylation, and Mitochondrial Quantity.
A) Seahorse Glycolysis Stress Test comparing CWR-R1-Control vs. SOX2KO cells. Extracellular acidification rate (ECAR) was measured as glucose, oligomycin, and 2-DG were added sequentially. Data and p-values represent triplicate experiments. B) Seahorse Glycolysis Stress Test comparing LAPC4-Control vs. LAPC4-LV-SOX2 (lentiviral SOX2 over-expressing cells, or SOX2-OE). Data and p-values represent triplicate experiments. C) Seahorse Mito Stress Test comparing CWR-R1-Control vs. SOX2KO cells. Oxygen consumption rate (OCR) was measured as oligomycin, FCCP, and rotenone/antimycin A were added sequentially. Data and p-values represent triplicate experiments. D) Seahorse Mito Stress Test comparing LAPC4-Control vs. LAPC4-LV-SOX2 (SOX2-OE). Data and p-values represent triplicate experiments. E) Metabolomic analyses of control and SOX2KO CWR-R1 cells for changes in purine, pyrimidine, amino acid, and sugar metabolism, as well as changes in the pentose-phosphate pathway. Data represent normalized fold-change to control values of triplicate analyses. F) SOX2-associated changes in fructose-6-phosphate/glucose-1-phosphate in control and SOX2KO CWR-R1 cells as well as control and SOX2-OE LAPC4 cells (*p<0.05). G) Quantitative PCR of SOX2-associated changes in mitochondria quantity measured as mitochondrial-specific tRNALeu(UUR) and 16S rRNA between control and SOX2KO CWR-R1 cells as well as control and SOX-OE LAPC4 cells. H) Schematic of SOX2-regulated changes in prostate cancer cell metabolism. SOX2-negative cells have decreased glycolysis, decreased pentose phosphate pathway activity, decreased fructose-6-phosphate, increased citrate, and decreased TCA cycle and oxidative phosphorylation. SOX2 expression leads to increased glycolysis, increased pentose phosphate pathway activity, increased fructose-6-phosphate, decreased citrate, and increased TCA cycle and oxidative phosphorylation.

References

    1. Ku SY, Rosario S, Wang Y, Mu P, Seshadri M, Goodrich ZW et al. Rb1 and Trp53 cooperate to suppress prostate cancer lineage plasticity, metastasis, and antiandrogen resistance. Science 2017; 355: 78–83. - PMC - PubMed
    1. Kregel S, Kiriluk KJ, Rosen AM, Cai Y, Reyes EE, Otto KB et al. Sox2 is an androgen receptor-repressed gene that promotes castration-resistant prostate cancer. PloS one 2013; 8: e53701. - PMC - PubMed
    1. Mu P, Zhang Z, Benelli M, Karthaus WR, Hoover E, Chen CC et al. SOX2 promotes lineage plasticity and antiandrogen resistance in TP53- and RB1-deficient prostate cancer. Science 2017; 355: 84–88. - PMC - PubMed
    1. Zhang S, Cui W. Sox2, a key factor in the regulation of pluripotency and neural differentiation. World journal of stem cells 2014; 6: 305. - PMC - PubMed
    1. Wegner M All purpose Sox: The many roles of Sox proteins in gene expression. The international journal of biochemistry & cell biology 2010; 42: 381–390. - PubMed

MeSH terms

Substances