. 2022 Apr;35(3):745-759.
doi: 10.1007/s40620-021-01214-8. Epub 2022 Jan 24.

SARS-CoV-2 infection in dialysis and kidney transplant patients: immunological and serological response

Affiliations

SARS-CoV-2 infection in dialysis and kidney transplant patients: immunological and serological response

Federico Alberici et al. J Nephrol. 2022 Apr.

Abstract

Background: Dialysis and kidney transplant patients with moderate-severe COVID-19 have a high mortality rate, around 30%, that is similar in the two populations, despite differences in their baseline characteristics. In these groups, the immunology of the disease has been poorly explored.

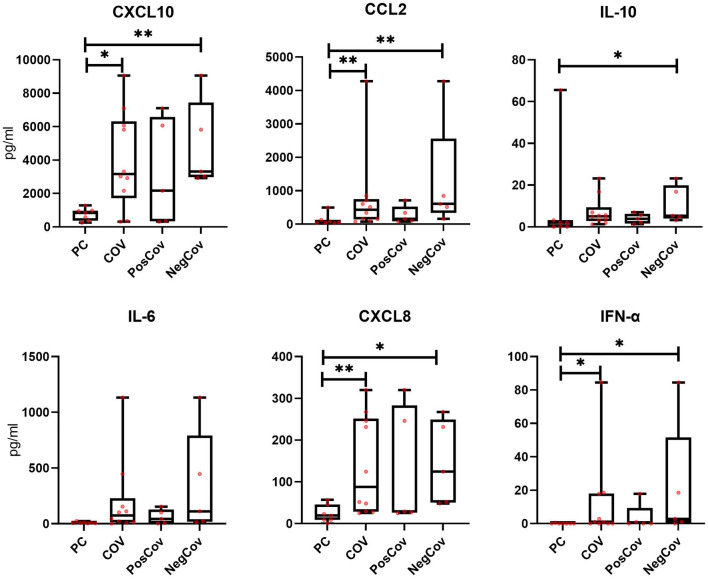
Methods: Thirty-two patients on dialysis or with kidney transplant and SARS-CoV-2 infection requiring hospitalization (COV group) were included in our study. Lymphocyte subsets, dendritic cell (DC) counts and monocyte activation were studied. SARS-CoV-2 anti-spike/anti-nucleocapsid were monitored, and baseline cytokines and chemokines were measured in 10 patients.

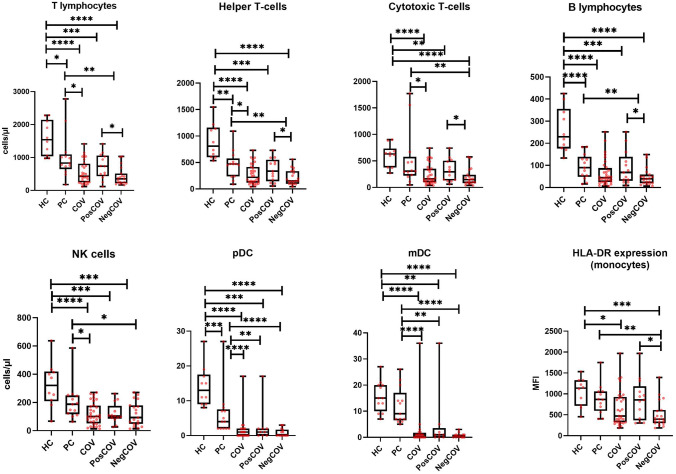
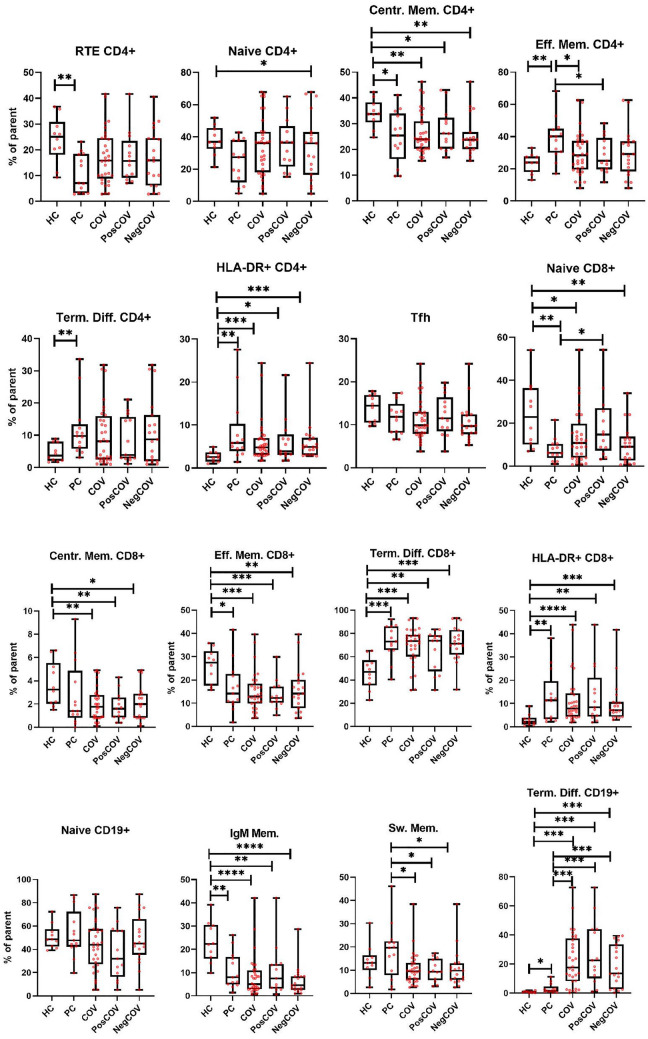
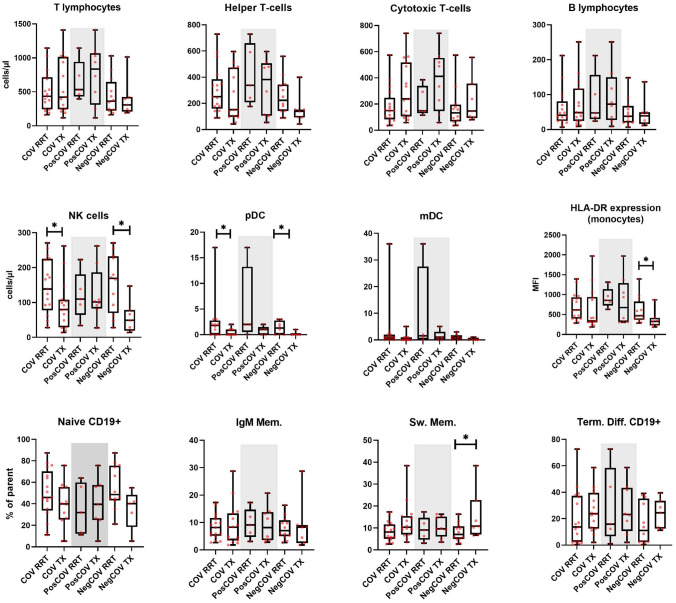
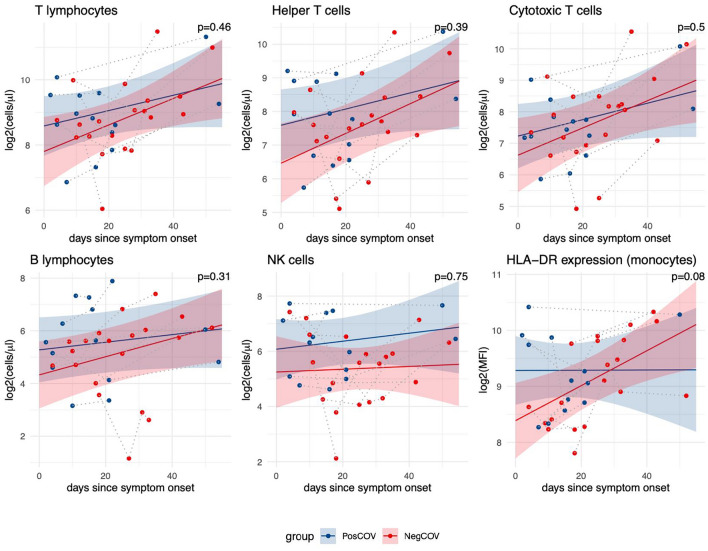
Results: The COV group, compared to healthy subjects and uninfected dialysis/kidney transplant controls, showed lower numbers of CD4 + and CD8 + T cells, Natural-Killer (NK), B cells, plasmacytoid and myeloid DCs, while the proportion of terminally differentiated B-cells was increased. IL6, IL10, IFN-α and chemokines involved in monocyte and neutrophil recruitment were higher in the COV group, compared to uninfected dialysis/kidney transplant controls. Patients with severe disease had lower CD4 + , CD8 + and B-cell counts and lower monocyte HLA-DR expression. Of note, when comparing dialysis and kidney transplant patients with COVID-19, the latter group presented lower NK and pDC counts and monocyte HLA-DR expression. Up to 60 days after symptom onset, kidney transplant recipients showed lower levels of anti-spike antibodies compared to dialysis patients.

Conclusions: During SARS-CoV-2 infection, dialysis and kidney transplant patients manifest immunophenotype abnormalities; these are similar in the two groups, however kidney transplant recipients show more profound alterations of the innate immune system and lower anti-spike antibody response.

Keywords: COVID-19; Hemodialysis; Kidney transplant; Lymphocytes; SARS-CoV-2.


Conflict of interest statement

FA, consultancy fees from Baxter, AstraZeneca and Otsuka, advisory board for Trevere Therapeutics; AMR research funding from AstraZeneca, European Hematology Association, Transcan2-ERANET, Italian Association for Cancer Research (Fondazione AIRC); advisory board for from Amgen, Celgene, Takeda, Janssen.

Figures

Fig. 1
Fig. 1
Major lymphocyte subset and dendritic cell counts, and monocyte HLA-DR expression at baseline. Comparisons are made across five groups: healthy controls (HC), pathological controls on dialysis or with kidney transplant without SARS-CoV-2 infection (PC), the overall dialysis and kidney transplant population with SARS-CoV-2 infection (COV), the subgroup with SARS-CoV-2 infection and positive outcome (PosCOV) and the subgroup with SARS-CoV-2 infection and negative outcome (NegCOV). The lines inside the boxes represent the median level, the edge of the boxes the 25th–75th percentiles, the whiskers the minimum and maximal values. MFI mean fluorescence intensity, pDC plasmacytoid dendritic cells, mDC myeloid dendritic cells. *p < 0.05, **p < 0.01, ***p < 0.001, ****p < 0.0001
Fig. 2
Fig. 2
Lymphocyte subpopulation distribution at baseline. Comparisons are made across five groups: healthy controls (HC), controls on dialysis or with kidney transplant without SARS-CoV-2 infection (PC), the overall dialysis and kidney transplant population with SARS-CoV-2 infection (COV), the subgroup with SARS-CoV-2 infection and positive outcome (PosCOV) and the subgroup with SARS-CoV-2 infection and negative outcome (NegCOV). The lines inside the boxes represent the median level, the edge of the boxes the 25th–75th percentiles, the whiskers the minimum and maximal values. RTE recent thymic emigrants, Centr. Mem. central memory, Eff. Mem effector memory, Term. Diff. terminally differentiated, Tfh follicular helper T-cells, IgM Mem. IgM Memory B-cells, Sw. Mem. switched memory B-cells
Fig. 3
Fig. 3
Comparison of immunophenotyping features at baseline between dialysis and kidney transplant patients with SARS-CoV-2 infection. The lines inside the boxes represent the median level, the edge of the boxes the 25th-75th percentiles, the whiskers the minimum and maximal values. The grey area includes patients belonging to the PosCOV group. RRT renal replacement therapy, TX kidney transplant, MFI mean fluorescence intensity, pDC plasmacytoid dendritic cells, mDC myeloid dendritic cells, IgM Mem. IgM Memory B-cells, Sw. Mem. switched memory B-cells, Term. Diff. terminally differentiated. *p < 0.05
Fig. 4
Fig. 4
Longitudinal course of cell counts and monocyte HLA-DR expression in a subgroup of 13 patients with SARS-CoV-2 infection. The changes over time of immune parameters were analyzed using linear mixed models. Dots represent individual data points, with grey dotted lines connecting observations from the same patients. Regression lines show trends for COVID-19 patients with positive (PosCOV, blue) or negative outcome (NegCOV,red); ribbons indicate 95% confidence intervals. The reported p-values refer to the statistical significance of the interaction term between outcome group (PosCOV/NegCOV) and time (days from onset of COVID-19 symptoms). MFI mean fluorescence intensity. The analysis included 4 dialysis patients (2 PosCov and 2 NegCov) and 9 kidney transplant patients (5 PosCov and 4 NegCov)
Fig. 5
Fig. 5
Cytokines and chemokines at baseline in a subset of 10 dialysis and kidney transplant patients with SARS-CoV-2 infection and 7 pathological controls. Comparisons are made across four groups: controls on dialysis or with kidney transplant without SARS-CoV-2 infection (PC), the overall dialysis and kidney transplant population with SARS-CoV-2 infection (COV), the subgroup with SARS-CoV-2 infection and positive outcome (PosCOV) and the subgroup with SARS-CoV-2 infection and negative outcome (NegCOV). The lines inside the boxes represent the median level, the edge of the boxes the 25th–75th percentiles, the whiskers the minimum and maximal values. The analysis included 4 dialysis patients (2 PosCov and 2 NegCov) and 6 kidney transplant patients (3 PosCov and 3 NegCov)
Fig. 6
Fig. 6
Anti-spike and anti-nucleocapsid protein antibodies over time in 32 dialysis and kidney transplant patients with SARS-CoV-2 infection. Regression lines with 95% confidence intervals from linear mixed models with quadratic time trend for anti-S (top row) and anti-N (bottom row) antibody levels in the first 60 days following onset of COVID-19 symptoms. The comparison between dialysis (green line) and kidney transplant (violet line), adjusted for COVID-19 severity, is showed in the left panel (p values in the top right corner). The right panel shows the comparison between PosCOV (blue line) and NegCov (red line), adjusted for dialysis/transplant status. Individual observations are showed as dots, with grey dotted lines connecting data points from the same patients. Antibody levels are expressed as log2 transformed light units (LU). The horizontal dashed line represents the cutoff for seroconversion. Anti-S anti-spike protein antibodies, Anti-N anti-nucleocapsid protein antibodies

Similar articles

Cited by

References

    1. Wu C, Chen X, Cai Y, Xia J, Zhou X, Xu S, et al. Risk factors associated with acute respiratory distress syndrome and death in patients with Coronavirus Disease 2019 pneumonia in Wuhan, China. JAMA Intern Med. 2020;180(7):934. doi: 10.1001/jamainternmed.2020.0994. - DOI - PMC - PubMed
    1. Chen G, Wu D, Guo W, Cao Y, Huang D, Wang H, et al. Clinical and immunological features of severe and moderate coronavirus disease 2019. J Clin Invest. 2020;130(5):2620–2629. doi: 10.1172/JCI137244. - DOI - PMC - PubMed
    1. Diao B, Wang C, Tan Y, Chen X, Liu Y, Ning L, et al. Reduction and functional exhaustion of T cells in patients with Coronavirus Disease 2019 (COVID-19) Front Immunol. 2020;1:1. doi: 10.3389/fimmu.2020.00827/full. - DOI - PMC - PubMed
    1. Zhang X, Tan Y, Ling Y, Lu G, Liu F, Yi Z, et al. Viral and host factors related to the clinical outcome of COVID-19. Nature. 2020;583(7816):437–440. doi: 10.1038/s41586-020-2355-0. - DOI - PubMed
    1. Bergamaschi L, Mescia F, Turner L, Hanson AL, Kotagiri P, Dunmore BJ, et al. (2021) Longitudinal analysis reveals that delayed bystander CD8+ T cell activation and early immune pathology distinguish severe COVID-19 from mild disease. Immunity [Internet]. Available from: https://linkinghub.elsevier.com/retrieve/pii/S1074761321002168. Accessed 2021 Jun 5 - PMC - PubMed

Publication types

Substances