

Predicted fat mass and lean mass in relation to all-cause and cause-specific mortality
- PMID: 35068076
- PMCID: PMC8978015
- DOI: 10.1002/jcsm.12921
Predicted fat mass and lean mass in relation to all-cause and cause-specific mortality
Abstract
Background: Studies on the prospective association of body composition with mortality in US general populations are limited. We aimed to examine this association by utilizing data from the National Health and Nutrition Examination Survey (NHANES), a representative sample of US adults, linked with data from the National Death Index.
Methods: We analysed data of NHANES 1988-1994 and 1999-2014, with 55 818 participants [50.6% female, baseline mean age: 45.0 years (SE, 0.2)]. Predicted fat mass and lean mass were calculated using the validated sex-specific anthropometric prediction equations developed by the NHANES based on individual age, race, height, weight, and waist circumference. Body composition and other covariates were measured at only one time point. Multivariable Cox regression was used to investigate the associations of predicted fat mass and lean mass with overall and cause-specific mortality, adjusting for potential confounders. Interactions between age and body composition on mortality were examined with likelihood ratio testing.
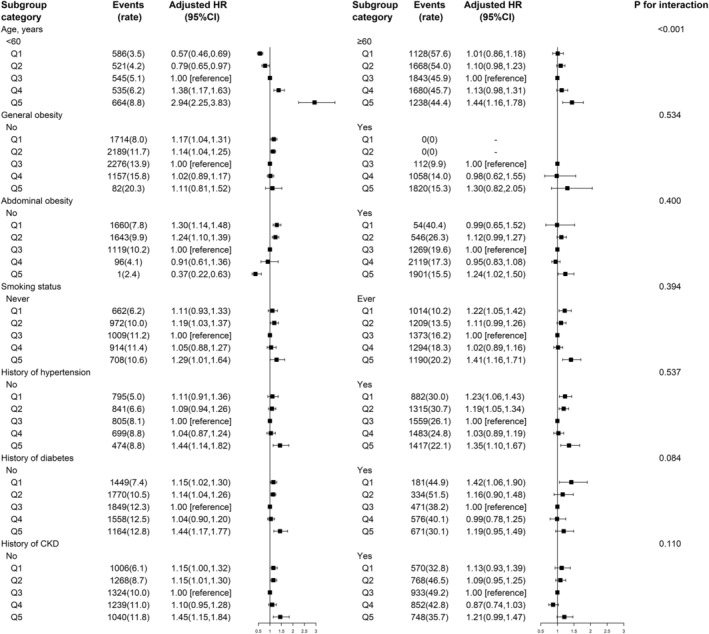
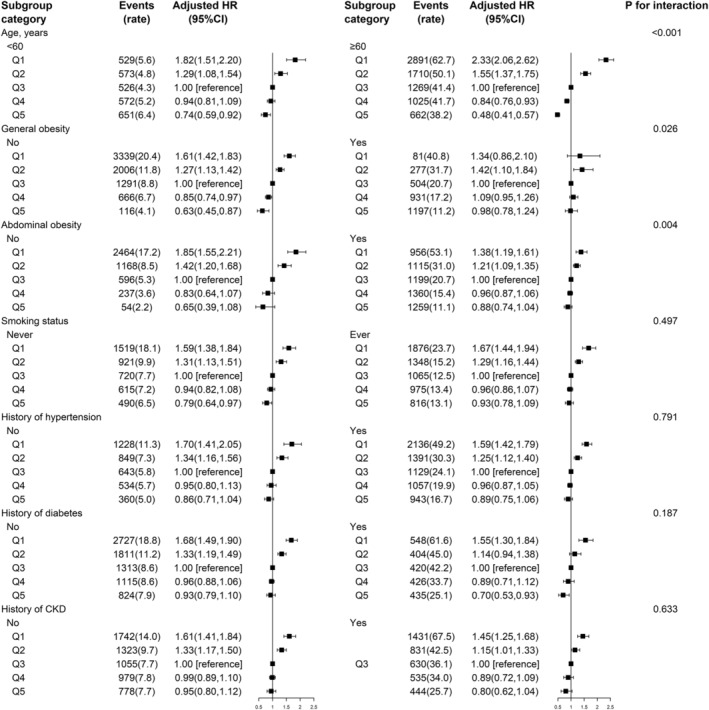
Results: Mean predicted fat mass was 24.1 kg [95% confidence interval (CI): 23.9-24.3) for male participants and 29.9 kg (95% CI: 29.6-30.1) for female participants, while mean predicted lean mass was 59.3 kg (95% CI: 59.1-59.5) for male participants and 41.7 kg (95% CI: 41.5-41.8) for female participants. During a median period of 9.7 years from the survey, 10 408 deaths occurred. When predicted fat and lean mass were both included in the model, predicted fat mass showed a U-shaped association with all-cause mortality, with significantly higher risk at two ends: Quintile 1 (HR, 1.17; 95% CI: 1.05-1.31), Quintile 2 (HR, 1.14; 95% CI: 1.04-1.26) and Quintile 5 (HR, 1.37; 95% CI: 1.12-1.68) compared with Quintile 3. In contrast, predicted lean mass showed a L-shaped association with all-cause mortality, with higher mortality in those with lower lean mass: Quintile 1 (HR, 1.64; 95% CI: 1.46-1.83) and Quintile 2 (HR, 1.29; 95% CI: 1.18-1.42) compared with Quintile 3. Similar results were found for cardiovascular, cancer, and respiratory cause-specific mortality. Age was a significant modifier: There was a monotonic positive association of predicted fat mass with mortality in younger participants (<60 years), but an approximate J-shaped association in older participants (≥60 years) (P interaction <0.001); there was a stronger inverse association between predicted lean mass and mortality in older participants (≥60) compared with those <60 years (P interaction <0.001).
Conclusions: In this US general population, predicted fat mass and lean mass were independent predictors for overall and cause-specific mortality. Age was a significant modifier on the associations.
Keywords: Abdominal obesity; Age; Mortality; Predicted fat mass; Predicted lean mass.
© 2022 The Authors. Journal of Cachexia, Sarcopenia and Muscle published by John Wiley & Sons Ltd on behalf of Society on Sarcopenia, Cachexia and Wasting Disorders.
Conflict of interest statement
No disclosures were reported.
Figures
Similar articles
-
Predicted lean body mass, fat mass, and all cause and cause specific mortality in men: prospective US cohort study.BMJ. 2018 Jul 3;362:k2575. doi: 10.1136/bmj.k2575. BMJ. 2018. PMID: 29970408 Free PMC article.
-
Development and validation of anthropometric prediction equations for lean body mass, fat mass and percent fat in adults using the National Health and Nutrition Examination Survey (NHANES) 1999-2006.Br J Nutr. 2017 Nov;118(10):858-866. doi: 10.1017/S0007114517002665. Epub 2017 Nov 7. Br J Nutr. 2017. PMID: 29110742
-
Association of body fat distribution with all-cause and cardiovascular mortality in US adults: a secondary analysis using NHANES.BMJ Open. 2023 Nov 21;13(11):e072752. doi: 10.1136/bmjopen-2023-072752. BMJ Open. 2023. PMID: 37989359 Free PMC article.
-
The association between android-to-gynoid lean mass ratio and all-cause and specific-cause mortality in US adults: A prospective study.Diabetes Obes Metab. 2025 Feb;27(2):595-605. doi: 10.1111/dom.16051. Epub 2024 Nov 7. Diabetes Obes Metab. 2025. PMID: 39511849 Free PMC article.
-
Prediction equations to estimate muscle mass using anthropometric data: a systematic review.Nutr Rev. 2023 Oct 10;81(11):1414-1440. doi: 10.1093/nutrit/nuad022. Nutr Rev. 2023. PMID: 37815928
Cited by
-
Predictive Value of Triglyceride-Glucose Index for All-Cause and Cardiovascular Mortality in Patients With Diabetes Mellitus: A Retrospective Study: TyG Index and Mortality in Diabetes.Int J Endocrinol. 2024 Oct 23;2024:6417205. doi: 10.1155/2024/6417205. eCollection 2024. Int J Endocrinol. 2024. PMID: 39479579 Free PMC article.
-
Diabetes Mellitus Mediates the Relationship Between Atherogenic Index of Plasma and Gallstones: A Population-Based Cross-Sectional Study.Diabetes Metab Syndr Obes. 2024 Jan 23;17:317-332. doi: 10.2147/DMSO.S449562. eCollection 2024. Diabetes Metab Syndr Obes. 2024. PMID: 38288340 Free PMC article.
-
Assessing skeletal muscle mass and lean body mass: an analysis of the agreement among dual X-ray absorptiometry, anthropometry, and bioelectrical impedance.Front Nutr. 2024 Aug 19;11:1445892. doi: 10.3389/fnut.2024.1445892. eCollection 2024. Front Nutr. 2024. PMID: 39224178 Free PMC article.
-
Sex Differences in Inflammation and Muscle Wasting in Aging and Disease.Int J Mol Sci. 2023 Feb 28;24(5):4651. doi: 10.3390/ijms24054651. Int J Mol Sci. 2023. PMID: 36902081 Free PMC article. Review.
-
Association between dietary supplement use and mortality in cancer survivors with different body mass index and frailty status: a cohort study.Front Nutr. 2024 May 1;11:1395362. doi: 10.3389/fnut.2024.1395362. eCollection 2024. Front Nutr. 2024. PMID: 38751742 Free PMC article.
References
Publication types
MeSH terms
Grants and funding
LinkOut - more resources
Full Text Sources
