

Pivotal Dominant Bacteria Ratio and Metabolites Related to Healthy Body Index Revealed by Intestinal Microbiome and Metabolomics
- PMID: 35068612
- PMCID: PMC8758854
- DOI: 10.1007/s12088-021-00989-5
Pivotal Dominant Bacteria Ratio and Metabolites Related to Healthy Body Index Revealed by Intestinal Microbiome and Metabolomics
Abstract
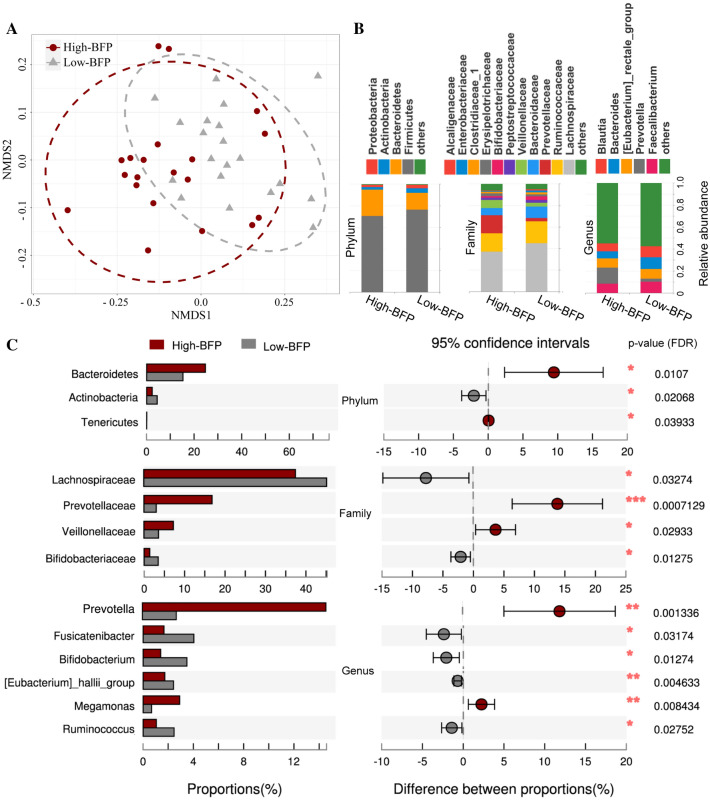
Various body indexes, especially body fat percentage (BFP), are widely used as effective indicators to measure our health. BFP is used in medicine to assess obesity, which is a body fat mass disorder accompanied with changes of the gut microbiota. However, the relationship between BFP and the gut microbiota has not been studied so far. To address this problem, we examined how gut microbiota and metabolome associated with body indices in healthy people. Microbial and metabolomics data based on 16S rDNA sequencing and LC-MS were obtained from stool samples of 20 healthy adults. Bioinformatics analysis was performed to explore the correlations between the body indices and gut microbial characteristics. Significantly different microbes were further validated via qPCR. Differential characteristics were filtered by building machine learning models to predict body status. Our data showed that abundance of Prevotella and the Prevotella/Bacteroides (P/B) ratio in the gut were markedly higher in high-BFP individuals than in low-BFP individuals. Microbial and metabolomics data consistently suggested significant differences in fatty acid metabolism in stool samples from the two groups. The P/B ratio and fatty acids are discriminative for people with different index levels by cross validation tests with machine learning models. These results suggest using Prevotella and fecal fatty acids as predictors may offer an alternative method for evaluating health status or weight loss.
Supplementary information: The online version contains supplementary material available at 10.1007/s12088-021-00989-5.
Keywords: Body fat percentage; Gut microbiota; Machine learning; Metabolites; Metagenomics.
© Association of Microbiologists of India 2021.
Conflict of interest statement
Conflicts of interestThe author declared no conflicts of interest to this work.
Figures


Similar articles
-
Clostridium, Bacteroides and Prevotella associates with increased fecal metabolites Trans-4-Hydroxy-L-proline and Genistein in active pulmonary tuberculosis patients during anti-tuberculosis chemotherapy with isoniazid-rifampin-pyrazinamide-ethambutol (HRZE).Indian J Microbiol. 2022 Sep;62(3):374-383. doi: 10.1007/s12088-022-01003-2. Epub 2022 Mar 24. Indian J Microbiol. 2022. PMID: 35974910 Free PMC article.
-
Integrative analysis of gut microbiota and fecal metabolites in metabolic associated fatty liver disease patients.Front Microbiol. 2022 Aug 22;13:969757. doi: 10.3389/fmicb.2022.969757. eCollection 2022. Front Microbiol. 2022. PMID: 36071958 Free PMC article.
-
Pivotal interplays between fecal metabolome and gut microbiome reveal functional signatures in cerebral ischemic stroke.J Transl Med. 2022 Oct 8;20(1):459. doi: 10.1186/s12967-022-03669-0. J Transl Med. 2022. PMID: 36209079 Free PMC article.
-
Fecal and serum metabolomic signatures and gut microbiota characteristics of allergic rhinitis mice model.Front Cell Infect Microbiol. 2023 Apr 25;13:1150043. doi: 10.3389/fcimb.2023.1150043. eCollection 2023. Front Cell Infect Microbiol. 2023. PMID: 37180443 Free PMC article.
-
Association between childhood obesity and gut microbiota: 16S rRNA gene sequencing-based cohort study.World J Gastroenterol. 2024 Apr 28;30(16):2249-2257. doi: 10.3748/wjg.v30.i16.2249. World J Gastroenterol. 2024. PMID: 38690025 Free PMC article.
Cited by
-
Mass Sportrometry: An annual look back at applications of mass spectrometry in sport and exercise science.Anal Sci Adv. 2023 Mar 31;4(3-4):60-80. doi: 10.1002/ansa.202300003. eCollection 2023 May. Anal Sci Adv. 2023. PMID: 38715927 Free PMC article. Review.
-
Effects of sex on fat deposition through gut microbiota and short-chain fatty acids in weaned pigs.Anim Nutr. 2024 Mar 26;17:100-109. doi: 10.1016/j.aninu.2024.03.004. eCollection 2024 Jun. Anim Nutr. 2024. PMID: 38770031 Free PMC article.
References
LinkOut - more resources
Full Text Sources