. 2022 Jan 5:12:800266.
doi: 10.3389/fphys.2021.800266. eCollection 2021.

Relationship Between Circulating Metabolic Hormones and Their Central Receptors During Ovariectomy-Induced Weight Gain in Rats

Affiliations

Relationship Between Circulating Metabolic Hormones and Their Central Receptors During Ovariectomy-Induced Weight Gain in Rats

Kaitlin E Burch et al. Front Physiol. .

Abstract

Although increasing research focuses on the phenomenon of body weight gain in women after menopause, the complexity of body weight regulation and the array of models used to investigate it has proven to be challenging. Here, we used ovariectomized (OVX) rats, which rapidly gain weight, to determine if receptors for ghrelin, insulin, or leptin in the dorsal vagal complex (DVC), arcuate nucleus (ARC), or paraventricular nucleus (PVN) change during post-ovariectomy weight gain. Female Sprague-Dawley rats with ad libitum access to standard laboratory chow were bilaterally OVX or sham OVX. Subgroups were weighed and then terminated on day 5, 33, or 54 post-operatively; blood and brains were collected. ELISA kits were used to measure receptors for ghrelin, insulin, and leptin in the DVC, ARC, and PVN, as well as plasma ghrelin, insulin, and leptin. As expected, body weight increased rapidly after ovariectomy. However, ghrelin receptors did not change in any of the areas for either group, nor did circulating ghrelin. Thus, the receptor:hormone ratio indicated comparable ghrelin signaling in these CNS areas for both groups. Insulin receptors in the DVC and PVN decreased in the OVX group over time, increased in the PVN of the Sham group, and were unchanged in the ARC. These changes were accompanied by elevated circulating insulin in the OVX group. Thus, the receptor:hormone ratio indicated reduced insulin signaling in the DVC and PVN of OVX rats. Leptin receptors were unchanged in the DVC and ARC, but increased over time in the PVN of the Sham group. These changes were accompanied by elevated circulating leptin in both groups that was more pronounced in the OVX group. Thus, the receptor:hormone ratio indicated reduced leptin signaling in the DVC and PVN of both groups, but only in the OVX group for the ARC. Together, these data suggest that weight gain that occurs after removal of ovarian hormones by ovariectomy is associated with selective changes in metabolic hormone signaling in the CNS. While these changes may reflect behavioral or physiological alterations, it remains to be determined whether they cause post-ovariectomy weight gain or result from it.

Keywords: arcuate nucleus; dorsal vagal complex; ghrelin; insulin; leptin.


Conflict of interest statement

The authors declare that the research was conducted in the absence of any commercial or financial relationships that could be construed as a potential conflict of interest.

Figures

FIGURE 1
FIGURE 1
Change in body weight (g) in subgroups of ovariectomized (OVX; black bars) and Sham ovariectomized (Sham; white bars) rats that were terminated at day 5, 33, or 54 post-operatively. Data are presented as means ± SEM. 1 = significantly greater than day 5 for the same treatment group, 2 = significantly greater than day 33 for the same treatment group, 3 = significantly greater than Sham group at that specific day.
FIGURE 2
FIGURE 2
Uterine weights (mg/cm) at day 5, 33, or 54 post-operatively after ovariectomy (OVX: black bars) or sham ovariectomy (Sham: white bars). Data are presented as means ± SEM. 1 = s ignificantly less than day 5 for the same treatment group, 3 = significantly less than Sham group at that specific day.
FIGURE 3
FIGURE 3
Ghrelin receptor levels (pg/mg protein) at day 5, 33, or 54 after ovariectomy (OVX: black bars) or sham ovariectomy (Sham: white bars). Top left: ghrelin receptor levels in the dorsal vagal complex (DVC). (Top right) Ratio of ghrelin receptor levels in the DVC to plasma ghrelin levels. (Middle left) Ghrelin receptor levels in the arcuate nucleus (ARC). (Middle right) ratio of ghrelin receptor levels in the ARC to plasma ghrelin levels. (Bottom left) Ghrelin receptor levels in the paraventricular nucleus (PVN). (Bottom right) Ratio of ghrelin receptor levels in the PVN to plasma ghrelin levels. Data are presented as means ± SEM; separate two-way ANOVAs were performed on each area. 3 = significantly different than Sham group at that specific day.
FIGURE 4
FIGURE 4
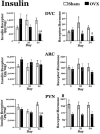
Insulin receptor levels (pg/mg protein) at day 5, 33, or 54 after ovariectomy (OVX: black bars) or sham ovariectomy (Sham: white bars). (Top left) Insulin receptor levels in the dorsal vagal complex (DVC). (Top right) Ratio of insulin receptor levels in the DVC to plasma insulin levels. (Middle left) Insulin receptor levels in the arcuate nucleus (ARC). (Middle right) Ratio of insulin receptor levels in the ARC to plasma insulin levels. (Bottom left) Insulin receptor levels in the paraventricular nucleus (PVN). (Bottom right) Ratio of insulin receptor levels in the PVN to plasma insulin levels. Data are presented as means ± SEM; separate two-way ANOVAs were performed on each area. 1 = significantly different than day 5 for the same treatment group, 2 = significantly different than day 33 for the same treatment group, 3 = significantly different than Sham group at that specific day. #Significant main effect of treatment.
FIGURE 5
FIGURE 5
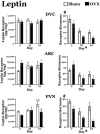
Leptin receptor levels (pg/mg protein) at day 5, 33, or 54 after ovariectomy (OVX: black bars) or sham ovariectomy (Sham: white bars). (Top left) Leptin receptor levels in the dorsal vagal complex (DVC). (Top right) Ratio of leptin receptor levels in the DVC to plasma leptin levels. (Middle left) Leptin receptor levels in the arcuate nucleus (ARC). (Middle right) Ratio of leptin receptor levels in the ARC to plasma leptin levels. (Bottom left) Leptin receptor levels in the paraventricular nucleus (PVN). (Bottom right) Ratio of leptin receptor levels in the PVN to plasma leptin levels. Data are presented as means ± SEM; separate two-way ANOVAs were performed on each area. 1 = significantly different than day 5 for the same treatment group, 2 = significantly different than day 33 for the same treatment group, 3 = significantly different than Sham group at that specific day. #Significant main effect of treatment; *Significant main effect of day.
FIGURE 6
FIGURE 6
Summary of experimental findings for ovariectomized (OVX) or sham ovariectomized (Sham) rats. Plasma levels of ghrelin, insulin and leptin (pg/mg protein) are represented, along with receptors for those hormones (pg/mg protein) in three central nuclei involved in the control of feeding and body weight. Finally, the receptor:hormone ratios (R:H) for each hormone in each area also are represented. DVC, dorsal vagal complex; ARC, arcuate nucleus; PVN, paraventricular nucleus of the hypothalamus. = indicates no differences between groups or over time; ↑ indicates increase over time, with differences in the number of arrows indicating differences between groups.

References

    1. Asarian L., Geary N. (2002). Cyclic estradiol treatment normalizes body weight and restores physiological patterns of spontaneous feeding and sexual receptivity in ovariectomized rats. Horm. Behav. 42 461–471. 10.1006/hbeh.2002.1835 - DOI - PubMed
    1. Asarian L., Geary N. (2006). Modulation of appetite by gonadal steroid hormones. Philos. Trans. R. Soc. Lond. B Biol. Sci. 361 1251–1263.1. 10.1098/rstb.2006.1860 - DOI - PMC - PubMed
    1. Asarian L., Geary N. (2013). Sex differences in the physiology of eating. Am. J. Physiol. Regul. Integr. Comp. Physiol. 305 R1215–R1267. 10.1152/ajpregu.00446.2012 - DOI - PMC - PubMed
    1. Askew M. L., Muckelrath H. D., Johnston J. R., Curtis K. S. (2015). Neuroanatomical association of hypothalamic HSD2-containing neurons with ERalpha, catecholamines, or oxytocin: implications for feeding? Front. Syst. Neurosci. 9:91. 10.3389/fnsys.2015.00091 - DOI - PMC - PubMed
    1. Barros R. P., Machado U. F., Warner M., Gustafsson J. A. (2006). Muscle GLUT4 regulation by estrogen receptors ERbeta and ERalpha. Proc. Natl. Acad. Sci. U. S. A. 103 1605–1608. 10.1073/pnas.0510391103 - DOI - PMC - PubMed