. 2022 Jan 6:12:773284.
doi: 10.3389/fmicb.2021.773284. eCollection 2021.

Mobile Genetic Elements Drive Antimicrobial Resistance Gene Spread in Pasteurellaceae Species

Affiliations

Mobile Genetic Elements Drive Antimicrobial Resistance Gene Spread in Pasteurellaceae Species

Giarlã Cunha da Silva et al. Front Microbiol. .

Abstract

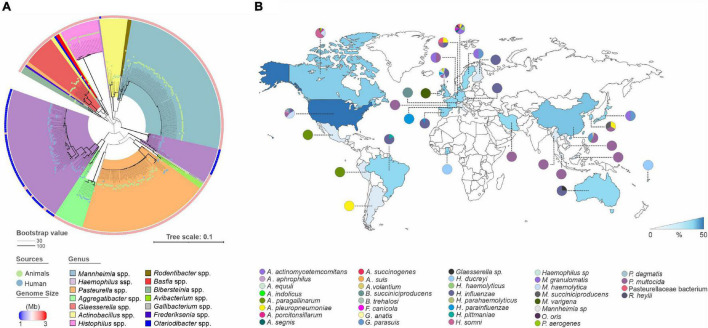
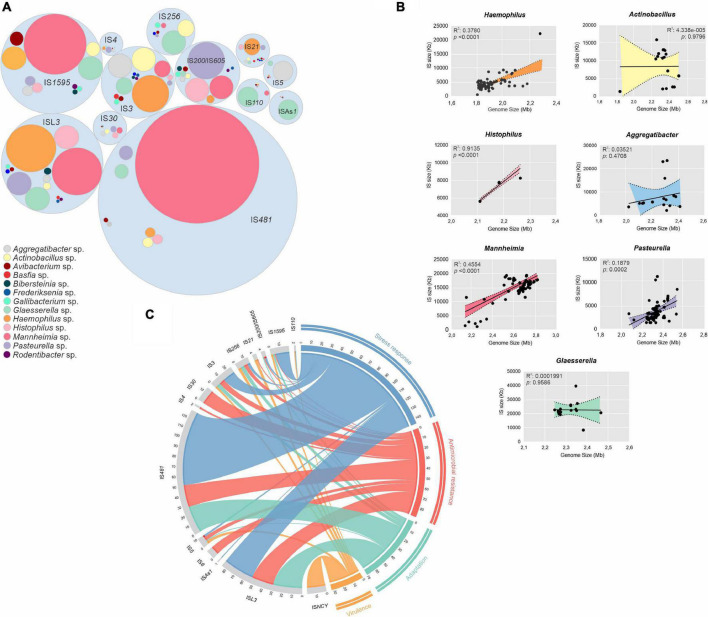
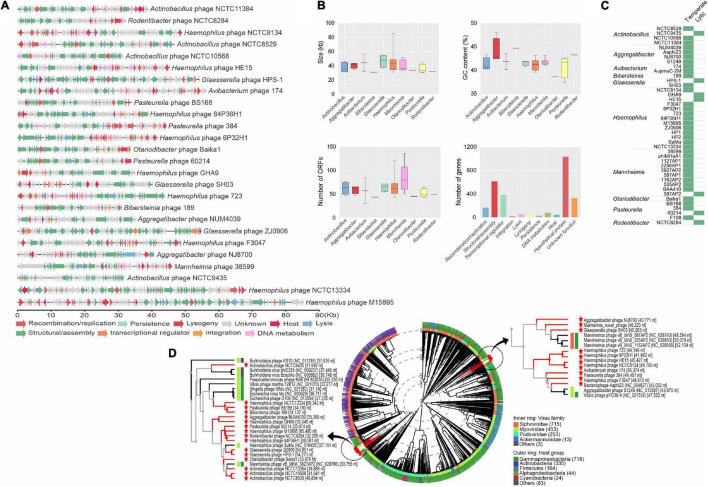
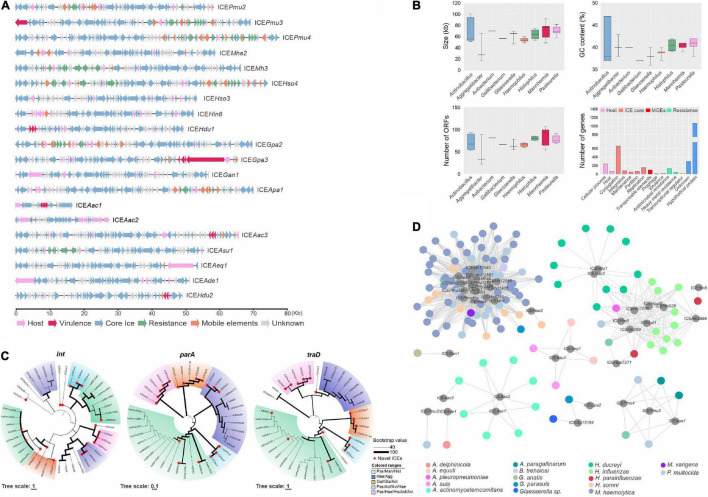
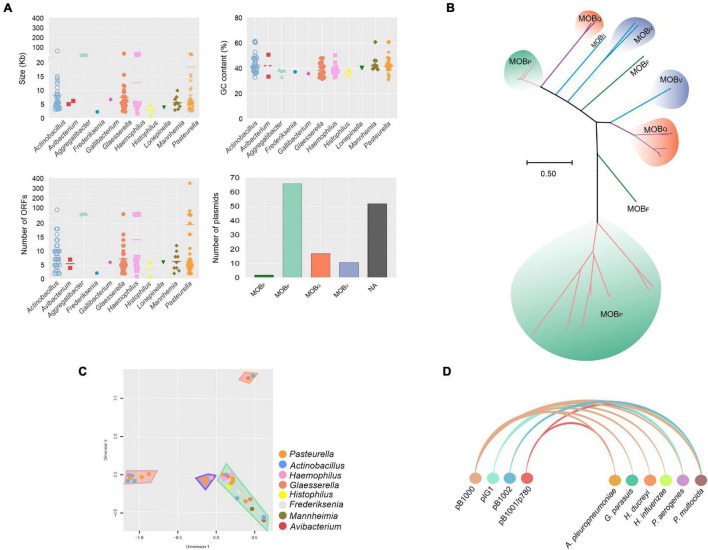
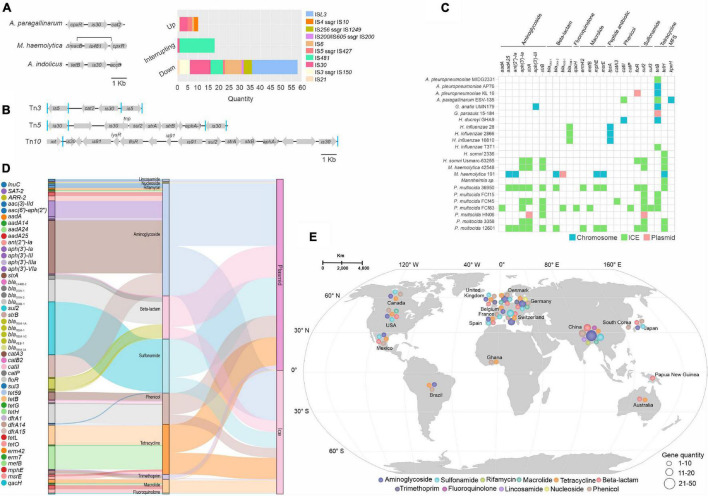
Mobile genetic elements (MGEs) and antimicrobial resistance (AMR) drive important ecological relationships in microbial communities and pathogen-host interaction. In this study, we investigated the resistome-associated mobilome in 345 publicly available Pasteurellaceae genomes, a large family of Gram-negative bacteria including major human and animal pathogens. We generated a comprehensive dataset of the mobilome integrated into genomes, including 10,820 insertion sequences, 2,939 prophages, and 43 integrative and conjugative elements. Also, we assessed plasmid sequences of Pasteurellaceae. Our findings greatly expand the diversity of MGEs for the family, including a description of novel elements. We discovered that MGEs are comparable and dispersed across species and that they also co-occur in genomes, contributing to the family's ecology via gene transfer. In addition, we investigated the impact of these elements in the dissemination and shaping of AMR genes. A total of 55 different AMR genes were mapped to 721 locations in the dataset. MGEs are linked with 77.6% of AMR genes discovered, indicating their important involvement in the acquisition and transmission of such genes. This study provides an uncharted view of the Pasteurellaceae by demonstrating the global distribution of resistance genes linked with MGEs.

Keywords: bacterial resistance; gene transfer; genome evolution; mobile DNA; one health.


Conflict of interest statement

The authors declare that the research was conducted in the absence of any commercial or financial relationships that could be construed as a potential conflict of interest.

Figures

FIGURE 1
FIGURE 1
The whole dataset comprises highly diverse and globally widespread genomes. (A) Phylogenetic tree of 16S rRNA genes from 345 complete genomes of Pasteurellaceae species. From the inside to the outside: the 14 main groups according to genus cluster, the size of the genomes (see legend), and the source of each genome (color dots). The evolutionary history was inferred by using the Maximum Likelihood method based on the General Time Reversible model. The tree is drawn to scale, with branch lengths in the same units as those of the evolutionary distances used to infer the phylogenetic tree. (B) Global distribution of publicly available Pasteurellaceae genomes by country. The heatmap below the map was plotted based on the number of genomes among the countries. Species distribution by country is represented by pie charts color-code as indicated in the legend.
FIGURE 2
FIGURE 2
Dissemination, impact in genome size and genetic context of insertion sequences (ISs). (A) Hierarchic organization of ISs distribution around the Pasteurellaceae species, colored by genus as shown in the legend. (B) Correlation graph between genome sizes and ISs grouped by genus. The x-axis indicates the genome size and the y-axis indicates the IS size in kilobases. Shaded regions indicate the 95% confidence interval according to the Pearson correlation coefficient. (C) Circular visualization of ISs context in four classes according to their flanking genes: Stress response, antimicrobial resistance, adaptation, and virulence (Clockwise direction). Inner connections represent the connection between IS families (anti-clockwise direction) and the function of the flanking genes. Values outside of the ring represent the total number of the IS elements from the respective connection.
FIGURE 3
FIGURE 3
The diversity of prophage elements integrated into Pasteurellaceae genomes. (A) Representation of novel prophage elements found integrated into Pasteurellaceae genomes. Prophage size is indicated in the scale bar (in kilobases) and ORF function is represented by arrows colored below the figure. (B) General overview of complete and novel prophages grouped by genus according to phage size (top-left graph), GC content (top-right graph), ORF content (bottom-left graph), and gene function (bottom-right graph). (C) Lifestyle classification (temperate or lytic) of complete and novel prophages are shown for all of the prophages in this study. (D) Phylogenomic tree analysis of novel prophages and references phages for Pasteurellaceae generated on the VipTree website. Colored rings show the families of viruses (inner rings) and host groups (outer rings). The length of the branch is log-scaled. The red stars represent the novel prophages found in this study.
FIGURE 4
FIGURE 4
Heterogeneous groups of integrative and conjugative elements (ICEs). (A) Representation of novel ICEs found integrated into Pasteurellaceae genomes. ICE size is indicated in the scale bar (in kilobases) and ORF functions are represented by arrows colored below the figure. (B) General overview of reported and novel ICEs of the family grouped by genus according to ICE size (top-left graph), GC content (top-right graph), ORF content (bottom-left graph), and gene function (bottom-right graph). (C) The evolutionary history of integrase (int), topoisomerase (parA), and coupling protein (traD) genes from ICEs inferred by using the Maximum Likelihood method based on the General Time Reversible model. The tree is drawn to scale, with branch lengths in the same units as those of the evolutionary distances used to infer the phylogenetic tree. Colored clusters represent conserved species groups among the trees. Bootstrap values are represented by the line thickness (see legend in the figure). (D) Network dispersion analysis of the ICEs among the Pasteurellaceae species (host genomes) represented in the species group. ICEs are displayed in dark gray circles with respective names.
FIGURE 5
FIGURE 5
General characteristics and clustering of plasmids found in the Pasteurellaceae family. (A) A general overview of plasmids in the Pasteurellaceae family grouped by genera according to plasmid size (top-left graph), GC content (top-right graph), ORF content (bottom-left graph), and relaxase family (bottom-right graph). (B) Evolutionary history of mob genes from plasmids inferred by using the Maximum Likelihood method based on the General Time Reversible model. The tree is drawn to scale, with branch lengths measured in the number of substitutions per site. (C) A multidimensional graph for analysis of the potentially non-mobilizable plasmid by sequence comparison. Clusters are highlighted in the graph in color-codes that represent the taxonomic group present in that taxon of plasmids. (D) Arc diagram representing four plasmids identified in different species/genomes, pB1000, pIG1, pB1002, and pB1001/pB780 (there is no deposit of the plasmid pB1000 identified in A. pleuropneumoniae, however, this has already been previously reported (Bossé et al., 2017).
FIGURE 6
FIGURE 6
Mobile genetic elements (MGEs) role in dissemination of antimicrobial resistance (AMR) genes. (A) Three representative ISs and AMR gene contexts found in this study. Figure highlights, in order, ISs from three different species (genomes) upstream, interrupting, and downstream of AMR genes. The bar graph (top-left graph) shows the values from the previous context for ten IS families. (B) Representation of the Tn3, Tn5, and Tn10 transposon families carrying AMR genes. Squares in blue identify direct repeats of the IS elements. The name of the AMR gene is shown inside the arrows. (C) Comparison of MGEs (green and pink) and their host genomes (in blue) carrying AMR genes. The name of AMR genes and their classes are shown at the top of the table. (D) Sankey diagram representing the diversity of AMR genes and their classes; the distribution of these genes between plasmids and ICEs. (E) Geographic distribution of AMR classes found within MGEs, color-coded as to their AMR classes. The scale below the map indicates the quantity of AMR genes found for each class.

Similar articles

Cited by

References

    1. Alcock B. P., Raphenya A. R., Lau T. T. Y., Tsang K. K., Bouchard M., Edalatmand A., et al. (2020). CARD 2020: antibiotic resistome surveillance with the comprehensive antibiotic resistance database. Nucleic Acids Res. 48 D517–D525. 10.1093/nar/gkz935 - DOI - PMC - PubMed
    1. Alvaro S. M., Antonio E. J., Belen G., Laura H., Nerea G., Montserrat L., et al. (2009). Multiresistance in Pasteurella multocida is mediated by coexistence of small plasmids. Antimicrob. Agents Chemother. 53 3399–3404. 10.1128/AAC.01522-08 - DOI - PMC - PubMed
    1. Archambault M., Harel J., Gouré J., Tremblay Y. D. N., Jacques M. (2011). Antimicrobial susceptibilities and resistance genes of canadian isolates of Actinobacillus pleuropneumoniae. Microb. Drug Resist. 18 198–206. 10.1089/mdr.2011.0150 - DOI - PubMed
    1. Ariza R. R., Cohen S. P., Bachhawat N., Levy S. B., Demple B. (1994). Repressor mutations in the marRAB operon that activate oxidative stress genes and multiple antibiotic resistance in Escherichia coli. J. Bacteriol. 176 143L–148. 10.1128/jb.176.1.143-148.1994 - DOI - PMC - PubMed
    1. Arndt D., Grant J. R., Marcu A., Sajed T., Pon A., Liang Y., et al. (2016). PHASTER: a better, faster version of the PHAST phage search tool. Nucleic Acids Res. 44 W16–W21. 10.1093/nar/gkw387 - DOI - PMC - PubMed

LinkOut - more resources