. 2022 Jan 6:12:793142.
doi: 10.3389/fimmu.2021.793142. eCollection 2021.

Comprehensive Flow Cytometry Profiling of the Immune System in COVID-19 Convalescent Individuals

Affiliations

Comprehensive Flow Cytometry Profiling of the Immune System in COVID-19 Convalescent Individuals

Sergio Gil-Manso et al. Front Immunol. .

Abstract

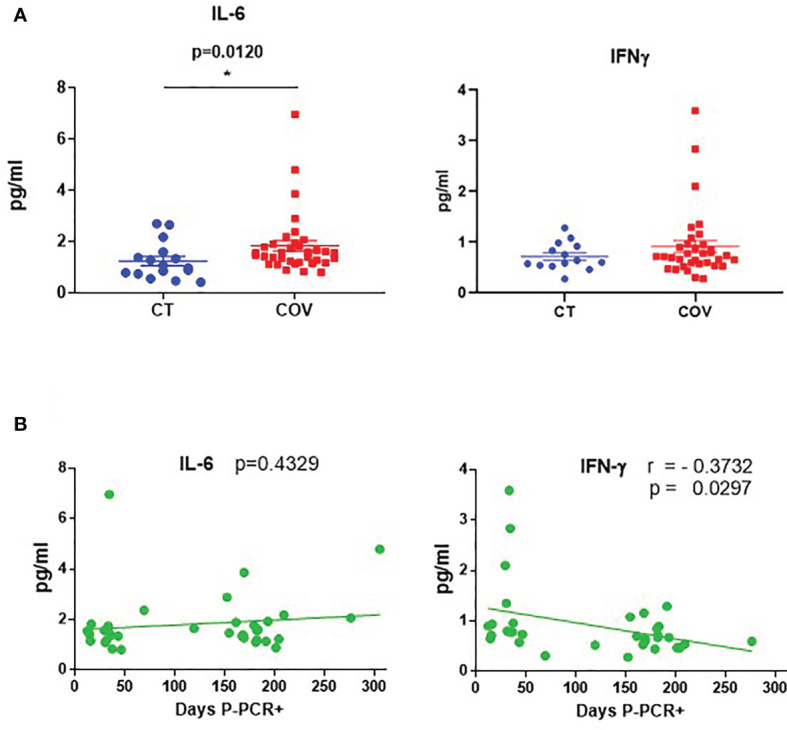
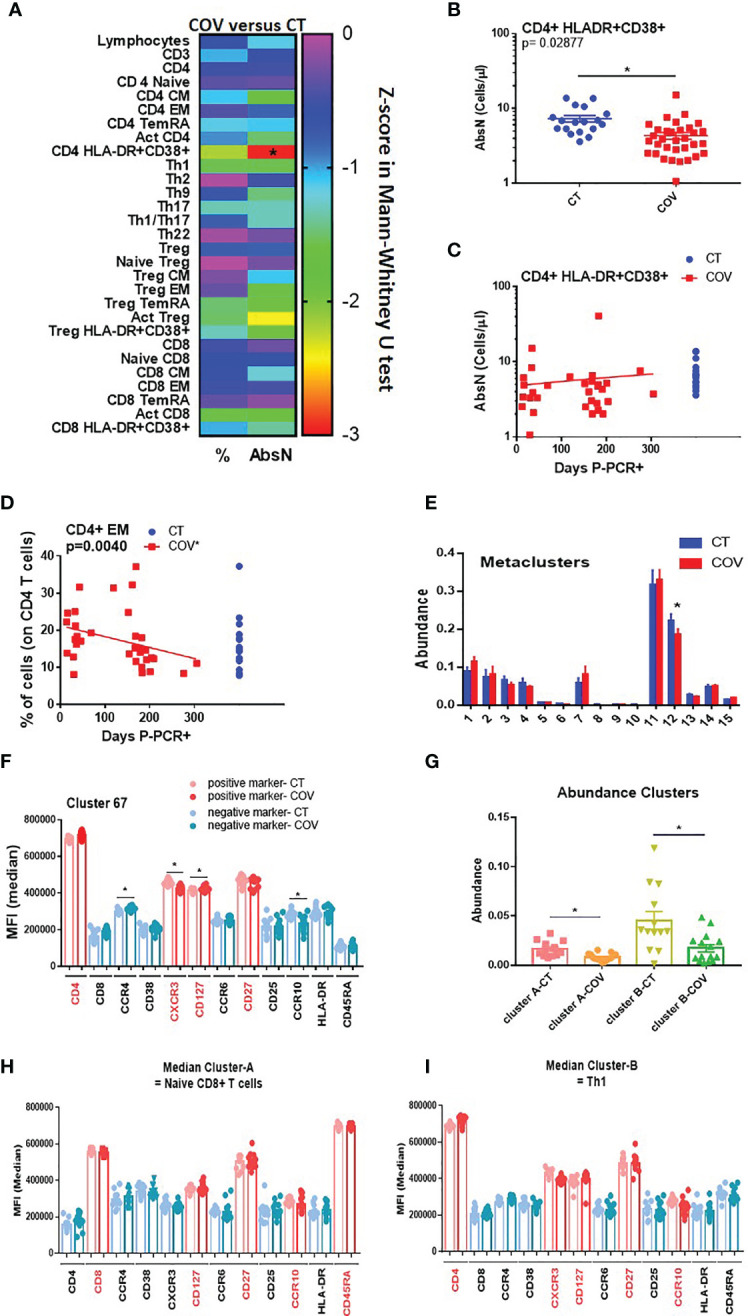
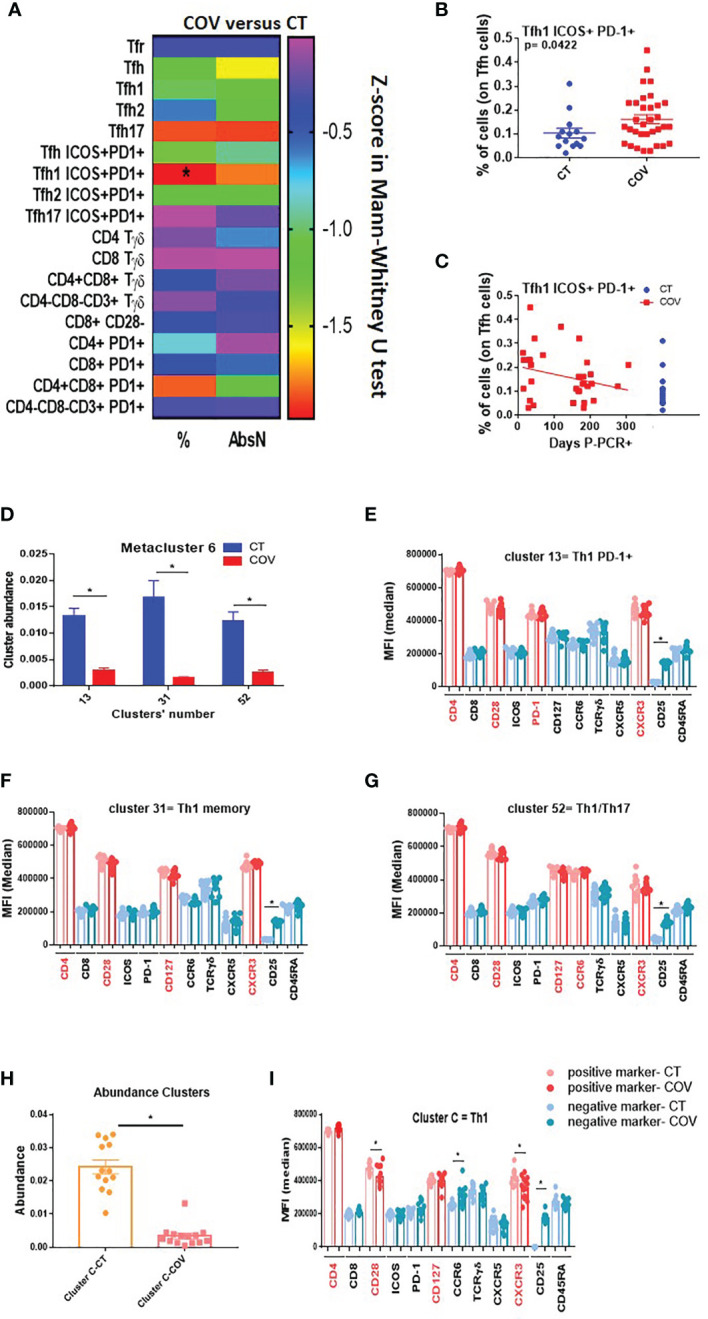
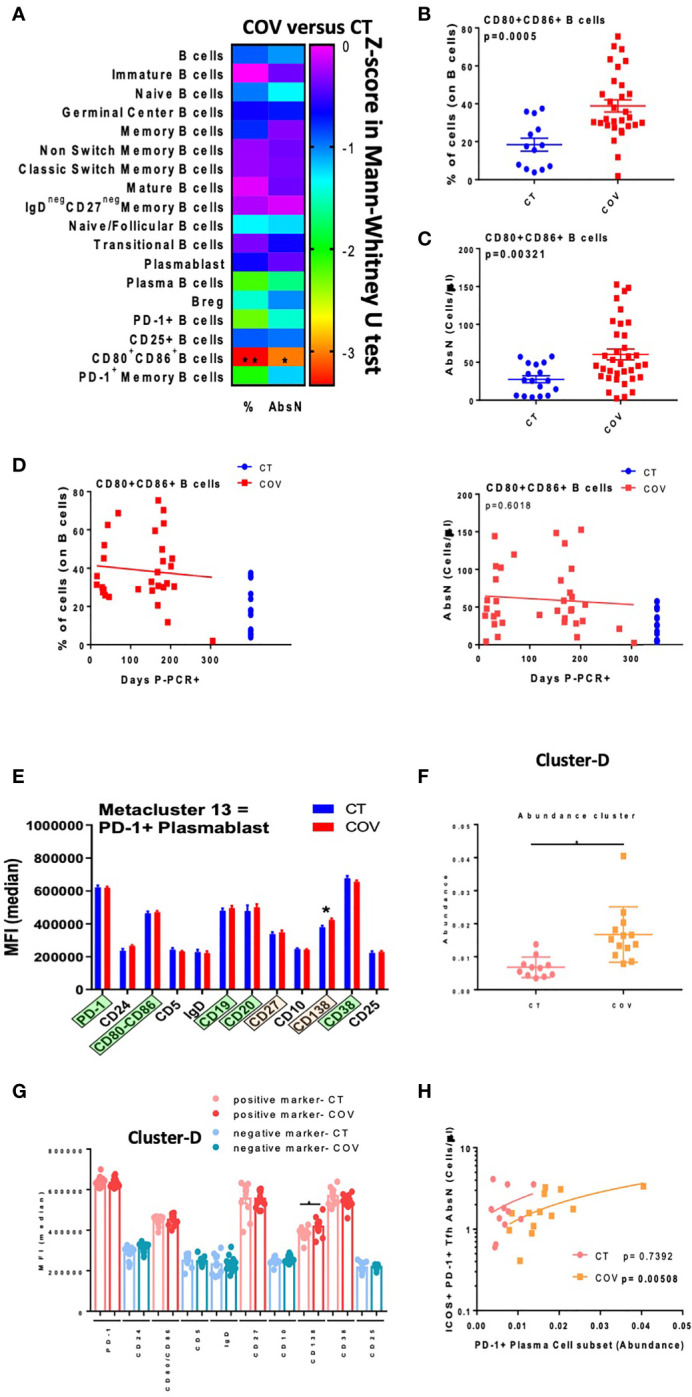
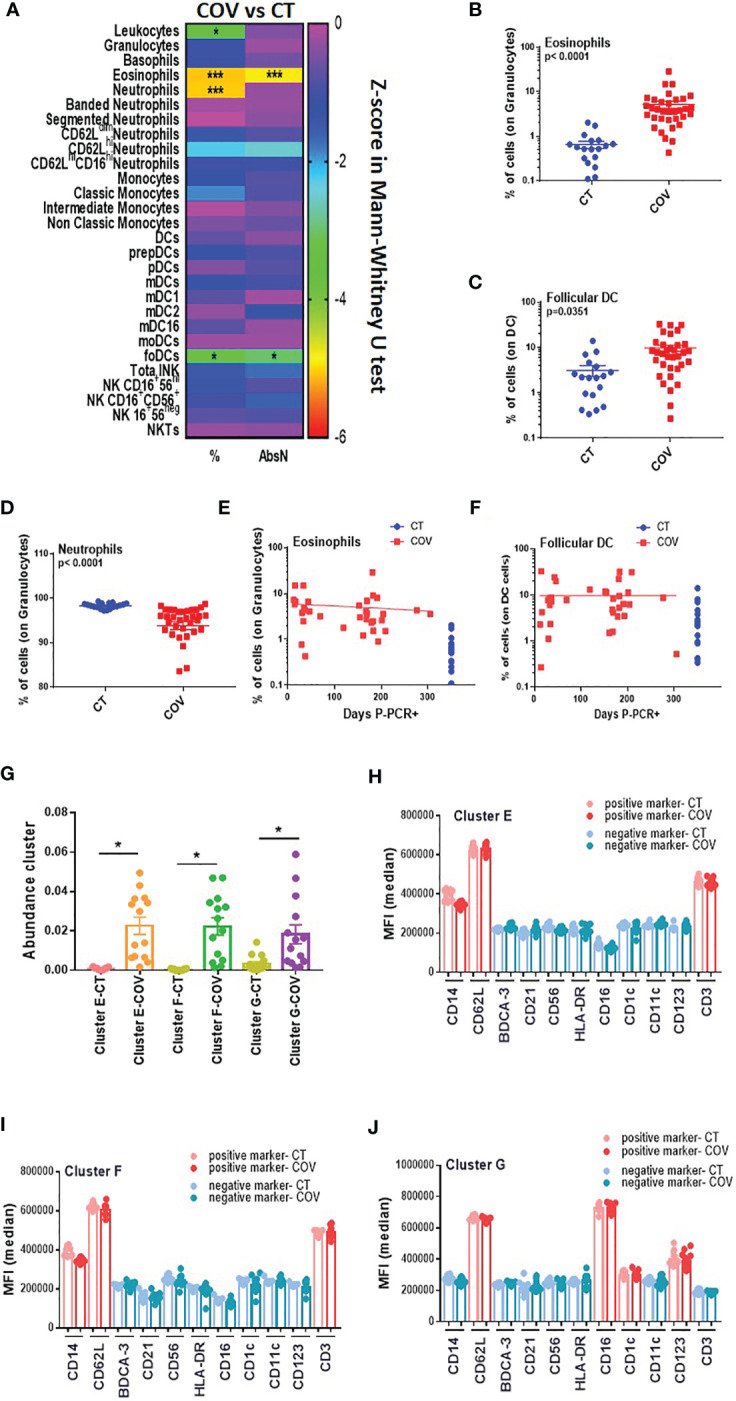
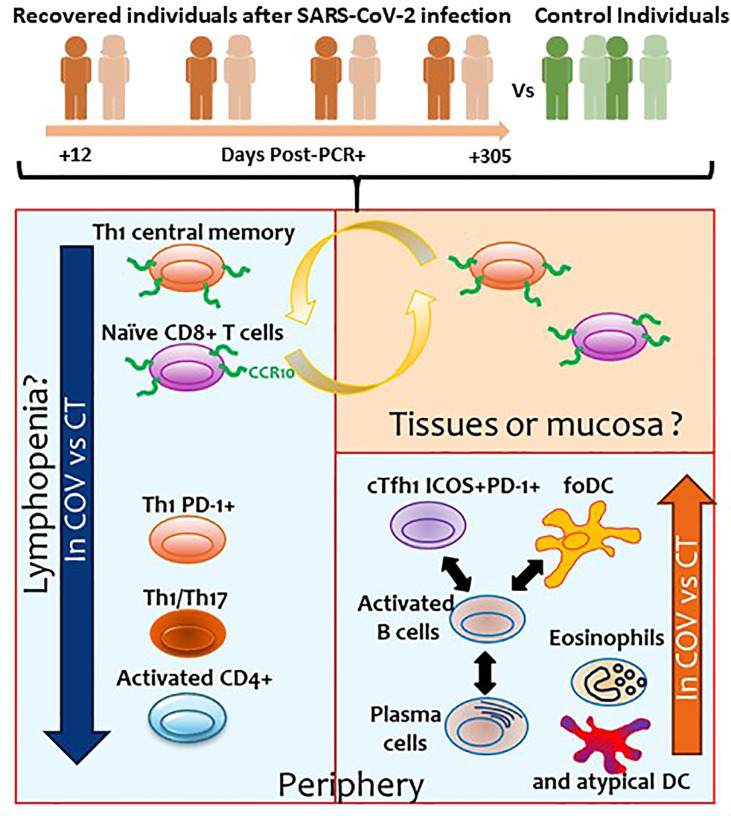
SARS-CoV-2 has infected more than 200 million people worldwide, with more than 4 million associated deaths. Although more than 80% of infected people develop asymptomatic or mild COVID-19, SARS-CoV-2 can induce a profound dysregulation of the immune system. Therefore, it is important to investigate whether clinically recovered individuals present immune sequelae. The potential presence of a long-term dysregulation of the immune system could constitute a risk factor for re-infection and the development of other pathologies. Here, we performed a deep analysis of the immune system in 35 COVID-19 recovered individuals previously infected with SARS-CoV-2 compared to 16 healthy donors, by flow cytometry. Samples from COVID-19 individuals were analysed from 12 days to 305 days post-infection. We observed that, 10 months post-infection, recovered COVID-19 patients presented alterations in the values of some T-cell, B-cell, and innate cell subsets compared to healthy controls. Moreover, we found in recovered COVID-19 individuals increased levels of circulating follicular helper type 1 (cTfh1), plasmablast/plasma cells, and follicular dendritic cells (foDC), which could indicate that the Tfh-B-foDC axis might be functional to produce specific immunoglobulins 10 months post-infection. The presence of this axis and the immune system alterations could constitute prognosis markers and could play an important role in potential re-infection or the presence of long-term symptoms in some individuals.

Keywords: COVID-19; flow cytometry; immune dysregulation; immune system; unsupervised algorithms.


Conflict of interest statement

The authors declare that the research was conducted in the absence of any commercial or financial relationships that could be construed as a potential conflict of interest.

Figures

Figure 1
Figure 1
Cytokine levels in recovered COVID-19 and healthy individuals. (A) Cytokine levels of IL-6 and IFN-γ in healthy (CT) and recovered individuals (COV). Mean ± SEM. Pairwise comparisons were performed by a Mann–Whitney U-test corrected using the Benjamini–Hochberg method for multiple testing. (B) Correlation between days P-PCR+ and IL-6 and IFN-γ levels. A linear regression curve is represented in each graph. Correlations were done using Spearman’s rank-order correlation test; r = Spearman’s rank correlation coefficient. P = p-value, adjusted by the Benjamini–Hochberg adjustment method for multiple testing. *p < 0.05. Each symbol corresponds to an individual.
Figure 2
Figure 2
Manual gating and high-dimensional flow cytometry unsupervised analysis in T-cell panel. (A) Heat map of the pairwise comparison between recovered COVID-19 (COV) and healthy control (CT) individuals of results obtained by classical manual flow cytometry gating. Statistical analysis was performed with the Mann–Whitney U test. The colour scale represents the Z-score on the right Y-axis. Immune population names are represented on the left Y-axis. The left column represents the z-score from the pairwise comparison for the cellular population’s percentage (%), and the right column represents the z-score from the pairwise comparison for the absolute numbers (cells/uL, AbsN). The p-value was corrected using the Benjamini–Hochberg method for multiple testing. (B) AbsN of CD4+ HLA-DR+ CD38+ in CT and COV individuals. Pairwise comparisons were performed using a Mann–Whitney U-test corrected using the Benjamini–Hochberg method for multiple testing; mean ± SEM. (C) Correlation between days P-PCR+ and CD4+ HLA-DR+ CD38+ AbsN. Spearman’s rank-order correlation test with Benjamini–Hochberg adjustment for multiple testing. (D) Correlation between days P-PCR+ and frequency of CD4+ effector memory (EM). Spearman’s rank-order correlation test with Benjamini–Hochberg adjustment for multiple testing. (E) The metaclusters’ abundance was obtained through FlowSOM analysis. Two-way ANOVA with Benjamini–Hochberg adjustment for multiple testing. Median ± SEM. (F) The median of fluorescence (MFI) of cluster 67 was obtained through a FlowSOM analysis. One-way ANOVA with Benjamini–Hochberg adjustment for multiple testing. Median ± SEM. (G) The clusters’ abundance was significantly different between COV and CT individuals obtained through CITRUS analysis. One-way ANOVA with Benjamini–Hochberg adjustment for multiple testing. Median ± SEM. (H) The median of fluorescence (MFI) of cluster A or cluster B (I) was obtained through CITRUS analysis. One-way ANOVA with Benjamini–Hochberg adjustment for multiple testing. Median ± SEM. *p < 0.05.
Figure 3
Figure 3
Manual gating and high-dimensional flow cytometry unsupervised analysis in Tfh–Tγδ cells panel. (A) Heat map of the pairwise comparison between recovered COVID-19 (COV) and healthy control (CT) individuals of cellular subsets obtained by classical manual flow cytometry gating. Analysis was performed with the Mann–Whitney U test. The colour scale represents Z-score on the right Y-axis. Immune population names are represented on the left Y-axis. The left column represents the z-score from the pairwise comparison for the cellular population’s percentage (%), and the right column represents the z-score from the pairwise comparison for the absolute numbers (cells/uL, AbsN). p-value was adjusted by the Benjamini–Hochberg adjustment method for multiple testing, *p < 0.05. (B) Frequency of Tfh1 ICOS+ PD-1+ in CT and COV individuals. Pairwise comparisons were performed using a Man–Whitney U-test with Benjamini–Hochberg adjustment for multiple testing. Mean ± SEM. (C) Correlation between days P-PCR+ and frequency of Tfh ICOS+ PD-1+. Spearman’s rank-order correlation test with Benjamini–Hochberg adjustment for multiple testing. (D) The abundance of the three metaclusters was obtained through FlowSOM analysis. One-way ANOVA with Benjamini–Hochberg adjustment for multiple testing. Median ± SEM. (E) Medians of fluorescence (MFI) of clusters 13, 31 (F), and 52 (G) were obtained through FlowSOM analysis. One-way ANOVA with Benjamini–Hochberg adjustment for multiple testing. Median ± SEM. (H) The abundance of the cluster was significantly different between CT and COV individuals, as obtained through CITRUS analysis. One-way ANOVA with Benjamini–Hochberg adjustment for multiple testing. Median ± SEM. (I) MFI of cluster C was obtained through CITRUS analysis. One-way ANOVA with Benjamini–Hochberg adjustment for multiple testing. Median ± SEM. *p < 0.05.
Figure 4
Figure 4
Manual gating and high-dimensional flow cytometry unsupervised analysis in B-cell panel. (A) Heat map of the pairwise comparison between recovered COVID-19 (COV) and healthy control (CT) individuals of cellular subsets obtained by classical flow cytometry analysis. Analysis was performed with the Mann–Whitney U test. The colour scale represents the Z-score on the right Y-axis. Immune population names are represented on the left Y-axis. The left column represents the z-score from the pairwise comparison of the cellular population’s percentage (%), and the right column represents the z-score from the pairwise comparison of the absolute numbers (cells/uL, AbsN). The p-value was adjusted by the Benjamini–Hochberg adjustment method for multiple testing. (B) Frequency or AbsN (C) of CD80/CD86+ B-cells in CT and COV individuals. Pairwise comparisons were performed using a Mann–Whitney U-test with Benjamini–Hochberg adjustment for multiple testing. Mean ± SEM. (D) Correlation between days P-PCR+ and frequency of CD80/CD86+ (left panel) and AbsN of CD80/CD86+ B cells (right panel). Spearman’s rank-order correlation test with Benjamini–Hochberg adjustment for multiple testing. (E) MFI of cluster 13 was obtained through FlowSOM analysis. One-way ANOVA with Benjamini–Hochberg adjustment for multiple testing. Median ± SEM. (F) The abundance of cluster D was significantly different between COV and CT individuals and was obtained through CITRUS analysis. One-way ANOVA with Benjamini–Hochberg adjustment for multiple testing. Median ± SEM. (G) MFI of cluster D obtained through CITRUS analysis. One-way ANOVA with Benjamini–Hochberg adjustment for multiple testing. Median ± SEM. (H) Correlation between AbsN of ICOS+ PD-1+ Tfh and the abundance of PD-1+ plasma cells. Spearman’s rank-order correlation test with Benjamini–Hochberg adjustment for multiple testing. *p < 0.05 and **p < 0.01.
Figure 5
Figure 5
Manual gating and high-dimensional flow cytometry unsupervised analysis in innate cells panel. (A) Heat map of the pairwise comparison between recovered COVID-19 (COV) and healthy control (CT) individuals of cellular subsets obtained by classical flow cytometry analysis. The analysis was performed with the Mann–Whitney U test. The colour scale represents the Z-score on the right Y-axis. Immune population names are represented on the left Y-axis. The left column represents the z-score from the pairwise comparison of the cellular population’s percentage (%), and the right column represents the z-score from the pairwise comparison of the absolute numbers (cells/uL, AbsN). The p-value was adjusted by the Benjamini–Hochberg adjustment method for multiple testing. *p < 0.05, and ***p < 0.001. (B) Frequency of eosinophils and (C) follicular DC in CT and COV individuals. Pairwise comparisons were performed by Mann–Whitney U-test with Benjamini–Hochberg adjustment for multiple testing. Mean ± SEM. (D) Frequency of neutrophils in CT and COV individuals. Pairwise comparisons were performed using Mann–Whitney U-test with Benjamini–Hochberg adjustment for multiple testing. Mean ± SEM. (E) Correlation between days P-PCR+ and frequency of eosinophils or (F) follicular DC. Spearman’s rank-order correlation test with Benjamini–Hochberg adjustment for multiple testing. (G) The abundance of clusters was significantly different between CT and COV individuals and was obtained through CITRUS analysis. One-way ANOVA with Benjamini–Hochberg adjustment for multiple testing. Median ± SEM. (H) MFI of cluster E, (I) cluster F, and (J) cluster G were obtained through CITRUS analysis. One-way ANOVA with Benjamini–Hochberg adjustment for multiple testing. Median ± SEM. *p < 0.05.
Figure 6
Figure 6
Summary of the results obtained in the present study. Orange and green individuals represent the recovered individuals after SARS-CoV-2 infection and controls, respectively. Numbers represents the days post-PCR+ when the samples of the former COVID-19 individuals were analysed. Blue squares represent the cellular subsets with altered levels observed in the periphery. Orange square represents the cellular subsets that could be potentially found in tissues or mucosa.

References

    1. Ioannidis JPA. Infection Fatality Rate of COVID-19 Inferred From Seroprevalence Data. Bull World Health Organ (2021) 99(1):19–33F. doi: 10.2471/BLT.20.265892 - DOI - PMC - PubMed
    1. Wang Y, Chen Y, Qin Q. Unique Epidemiological and Clinical Features of the Emerging 2019 Novel Coronavirus Pneumonia (COVID-19) Implicate Special Control Measures. J Med Virol (2020) 92(6):568–76. doi: 10.1002/jmv.25748 - DOI - PMC - PubMed
    1. Akbarialiabad H, Taghrir MH, Abdollahi A, Ghahramani N, Kumar M, Paydar S, et al. Long COVID, A Comprehensive Systematic Scoping Review. Infection (2021) 49(6):1163–86. doi: 10.1007/s15010-021-01666-x - DOI - PMC - PubMed
    1. Zheng HY, Zhang M, Yang CX, Zhang N, Wang XC, Yang XP, et al. Elevated Exhaustion Levels and Reduced Functional Diversity of T Cells in Peripheral Blood may Predict Severe Progression in COVID-19 Patients. Cell Mol Immunol (2020) 17(5):541–3. doi: 10.1038/s41423-020-0401-3 - DOI - PMC - PubMed
    1. Zheng M, Gao Y, Wang G, Song G, Liu S, Sun D, et al. Functional Exhaustion of Antiviral Lymphocytes in COVID-19 Patients. Cell Mol Immunol (2020) 17(5):533–5. doi: 10.1038/s41423-020-0402-2 - DOI - PMC - PubMed

Publication types

MeSH terms

Substances