. 2022 Jan 7:12:745379.
doi: 10.3389/fpls.2021.745379. eCollection 2021.

Genomic Selection for Wheat Blast in a Diversity Panel, Breeding Panel and Full-Sibs Panel

Affiliations

Genomic Selection for Wheat Blast in a Diversity Panel, Breeding Panel and Full-Sibs Panel

Philomin Juliana et al. Front Plant Sci. .

Abstract

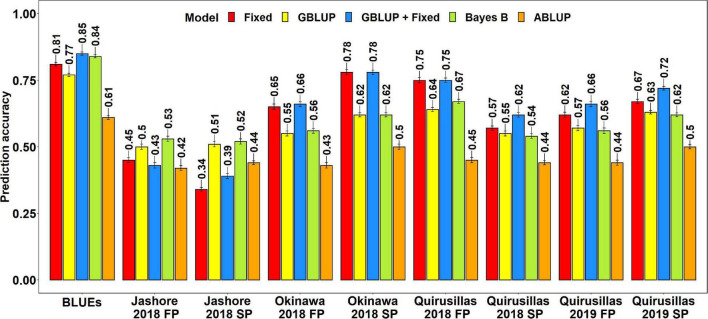
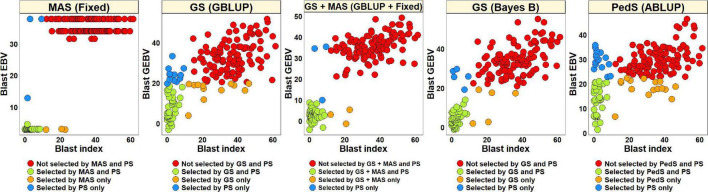
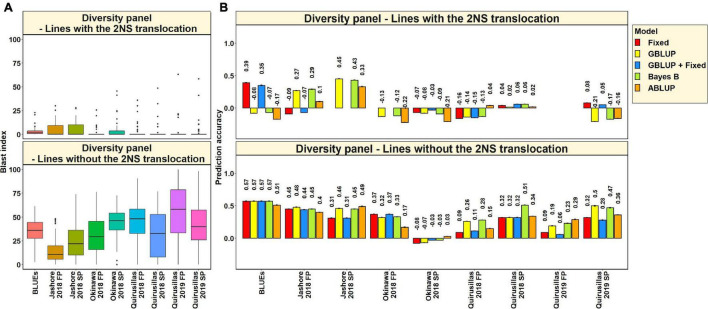
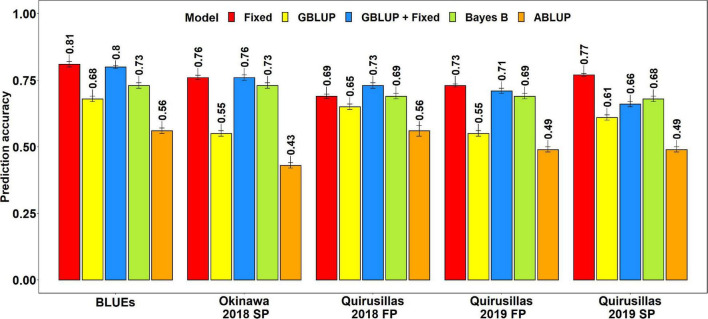
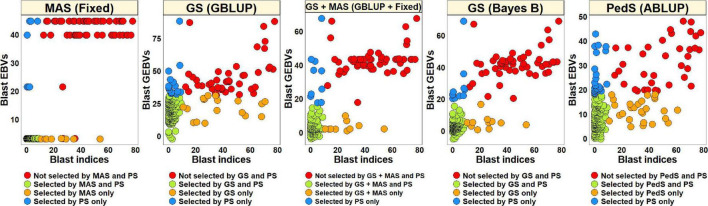
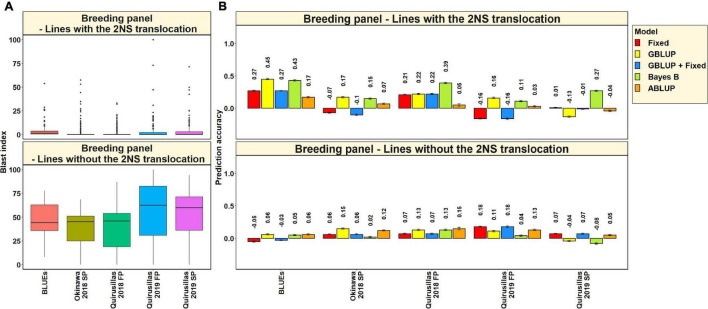
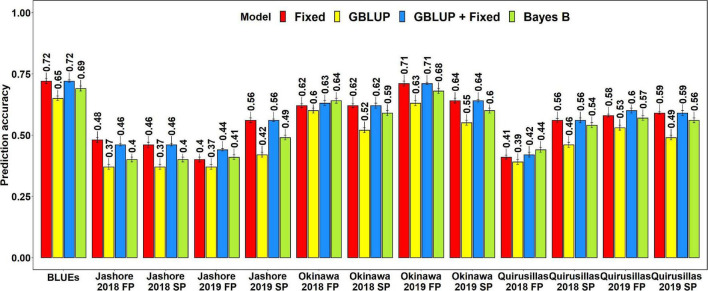
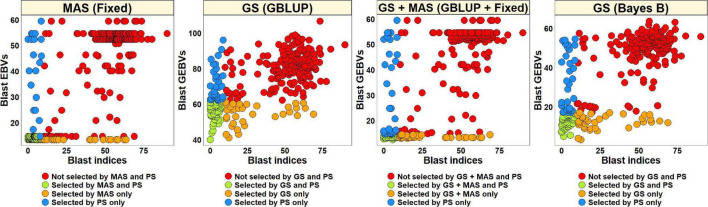
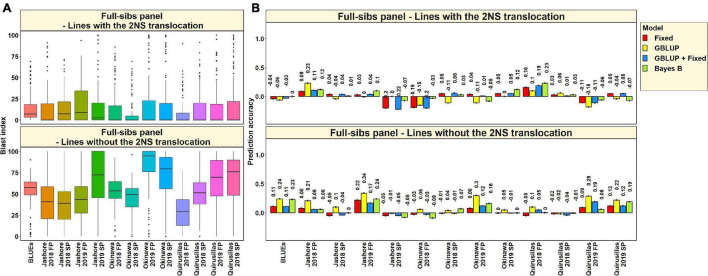
Wheat blast is an emerging threat to wheat production, due to its recent migration to South Asia and Sub-Saharan Africa. Because genomic selection (GS) has emerged as a promising breeding strategy, the key objective of this study was to evaluate it for wheat blast phenotyped at precision phenotyping platforms in Quirusillas (Bolivia), Okinawa (Bolivia) and Jashore (Bangladesh) using three panels: (i) a diversity panel comprising 172 diverse spring wheat genotypes, (ii) a breeding panel comprising 248 elite breeding lines, and (iii) a full-sibs panel comprising 298 full-sibs. We evaluated two genomic prediction models (the genomic best linear unbiased prediction or GBLUP model and the Bayes B model) and compared the genomic prediction accuracies with accuracies from a fixed effects model (with selected blast-associated markers as fixed effects), a GBLUP + fixed effects model and a pedigree relationships-based model (ABLUP). On average, across all the panels and environments analyzed, the GBLUP + fixed effects model (0.63 ± 0.13) and the fixed effects model (0.62 ± 0.13) gave the highest prediction accuracies, followed by the Bayes B (0.59 ± 0.11), GBLUP (0.55 ± 0.1), and ABLUP (0.48 ± 0.06) models. The high prediction accuracies from the fixed effects model resulted from the markers tagging the 2NS translocation that had a large effect on blast in all the panels. This implies that in environments where the 2NS translocation-based blast resistance is effective, genotyping one to few markers tagging the translocation is sufficient to predict the blast response and genome-wide markers may not be needed. We also observed that marker-assisted selection (MAS) based on a few blast-associated markers outperformed GS as it selected the highest mean percentage (88.5%) of lines also selected by phenotypic selection and discarded the highest mean percentage of lines (91.8%) also discarded by phenotypic selection, across all panels. In conclusion, while this study demonstrates that MAS might be a powerful strategy to select for the 2NS translocation-based blast resistance, we emphasize that further efforts to use genomic tools to identify non-2NS translocation-based blast resistance are critical.

Keywords: Magnaporthe oryzae; blast disease; genomic selection (GS); genotyping-by sequencing; marker-assisted selection; pedigree selection; wheat.


Conflict of interest statement

The authors declare that the research was conducted in the absence of any commercial or financial relationships that could be construed as a potential conflict of interest.

Figures

FIGURE 1
FIGURE 1
Twofold cross validation prediction accuracies for blast response in the diversity panel (172 lines) using the fixed effects (Fixed), genomic best linear unbiased prediction (GBLUP), GBLUP and fixed effects (GBLUP + Fixed), Bayes B, and pedigree best linear unbiased prediction (ABLUP) models. FP refers to the first planting, SP refers to the second planting and BLUEs refer to the best linear unbiased estimates of blast indices across the different environments.
FIGURE 2
FIGURE 2
Comparison of phenotypic selection (PS) of the best linear unbiased estimates of blast indices across environments with: (i) marker assisted selection (MAS) using the estimated breeding values (EBVs) obtained from the fixed effects model (Fixed) (ii) genomic selection (GS) using the genomic estimated breeding values (GEBVs) obtained from the genomic best-linear unbiased prediction (GBLUP) and Bayes B models (iii) GS + MAS using the GEBVs obtained from the GBLUP and fixed effects (GBLUP + Fixed) model and (iv) pedigree selection (PedS) using the EBVs obtained from the pedigree best linear unbiased prediction (ABLUP) model in the diversity panel comprising 172 lines.
FIGURE 3
FIGURE 3
(A) Boxplots showing the wheat blast indices in 53 lines with the 2NS translocation in the diversity panel and 119 lines without the 2NS translocation in the diversity panel. (B) Two-fold cross validation prediction accuracies for blast response in 53 lines with the 2NS translocation and 119 lines without the 2NS translocation in the diversity panel using the fixed effects (Fixed), genomic best linear unbiased prediction (GBLUP), GBLUP and fixed effects (GBLUP + Fixed), Bayes B, and pedigree best linear unbiased prediction (ABLUP) models. The prediction accuracies are missing for some environments and models in the subset of lines with the 2NS translocation, where several lines had a blast index of zero. In (A,B), FP refers to the first planting, SP refers to the second planting and BLUEs refer to the best linear unbiased estimates of blast indices across the different environments.
FIGURE 4
FIGURE 4
Twofold cross validation prediction accuracies for blast response in the breeding panel (248 lines) using the fixed effects (Fixed), genomic best linear unbiased prediction (GBLUP), GBLUP and fixed effects (GBLUP + Fixed), Bayes B, and pedigree best linear unbiased prediction (ABLUP) models. FP refers to the first planting, SP refers to the second planting and BLUEs refer to the best linear unbiased estimates of blast indices across the different environments.
FIGURE 5
FIGURE 5
Comparison of phenotypic selection (PS) of the best linear unbiased estimates of blast indices across environments with: (i) marker assisted selection (MAS) using the estimated breeding values (EBVs) obtained from the fixed effects model (fixed) (ii) genomic selection (GS) using the genomic estimated breeding values (GEBVs) obtained from the genomic best-linear unbiased prediction (GBLUP) and Bayes B models (iii) GS + MAS using the GEBVs obtained from the GBLUP and fixed effects (GBLUP + Fixed) model and (iv) pedigree selection (PedS) using the EBVs obtained from the pedigree best linear unbiased prediction (ABLUP) model in the breeding panel comprising 248 lines.
FIGURE 6
FIGURE 6
(A) Boxplots showing the wheat blast indices in 185 lines with the 2NS translocation in the breeding panel and 47 lines without the 2NS translocation in the breeding panel. (B) Two-fold cross validation prediction accuracies for blast response in 185 lines with the 2NS translocation and 47 lines without the 2NS translocation in the breeding panel using the fixed effects (Fixed), genomic best linear unbiased prediction (GBLUP), GBLUP and fixed effects (GBLUP + Fixed), Bayes B, and pedigree best linear unbiased prediction (ABLUP) models. In (A,B), FP refers to the first planting, SP refers to the second planting and BLUEs refer to the best linear unbiased estimates of blast indices across the different environments.
FIGURE 7
FIGURE 7
Twofold cross validation prediction accuracies for blast response in the full-sibs panel (298 lines) using the fixed effects (Fixed), genomic best linear unbiased prediction (GBLUP), GBLUP and fixed effects (GBLUP + Fixed) and Bayes B models. FP refers to the first planting, SP refers to the second planting and BLUEs refer to the best linear unbiased estimates of blast indices across the different environments.
FIGURE 8
FIGURE 8
Comparison of phenotypic selection (PS) of the best linear unbiased estimates of blast indices across environments with: (i) marker assisted selection (MAS) using the estimated breeding values (EBVs) obtained from the fixed effects model (fixed) (ii) genomic selection (GS) using the genomic estimated breeding values (GEBVs) obtained from the genomic best-linear unbiased prediction (GBLUP) and Bayes B models and (iii) GS + MAS using the GEBVs obtained from the GBLUP and fixed effects (GBLUP + Fixed) model in the Caninde#1 × Alondra full-sibs panel comprising 298 lines.
FIGURE 9
FIGURE 9
(A) Boxplots showing the wheat blast indices in 117 lines with the 2NS translocation in the full-sibs panel and 144 lines without the 2NS translocation in the full-sibs panel. (B) Twofold cross validation prediction accuracies for blast response in 117 lines with the 2NS translocation and 144 lines without the 2NS translocation in the full-sibs panel using the fixed effects (Fixed), genomic best linear unbiased prediction (GBLUP), GBLUP and fixed effects (GBLUP + Fixed) and Bayes B models. In (A,B), FP refers to the first planting, SP refers to the second planting and BLUEs refer to the best linear unbiased estimates of blast indices across the different environments.

References

    1. Anh V. L., Anh N. T., Tagle A. G., Vy T. T. P., Inoue Y., Takumi S., et al. (2015). Rmg8, a new gene for resistance to Triticum isolates of Pyricularia oryzae in hexaploid wheat. Phytopathology 105 1568–1572. 10.1094/PHYTO-02-15-0034-R - DOI - PubMed
    1. Anh V. L., Inoue Y., Asuke S., Vy T. T. P., Anh N. T., Wang S., et al. (2018). Rmg8 and Rmg7, wheat genes for resistance to the wheat blast fungus, recognize the same avirulence gene AVR-Rmg8. Mol. Plant Pathol. 19 1252–1256. 10.1111/mpp.12609 - DOI - PMC - PubMed
    1. Barea G., Toledo J. (1996). Identificación y Zonificación de Pyricularia o Brusone (Pyricularia oryzae) en el Cutivo De Trigo en el Departamento de Santa Cruz. Santa Cruz de la Sierra: Centro de Investigación Agrícola Tropical, 76–86.
    1. Bradbury P. J., Zhang Z., Kroon D. E., Casstevens T. M., Ramdoss Y., Buckler E. S. (2007). TASSEL: Software for association mapping of complex traits in diverse samples. Bioinformatics 23 2633–2635. 10.1093/bioinformatics/btm308 - DOI - PubMed
    1. Cabrera M., Gutiérrez S. (2007). Primer Registro de Pyricularia Grisea en Cultivos de Trigo del NE de Argentina. Buenos Aires: IFSC Press.