. 2019 Nov:9:852-857.
doi: 10.1038/s41558-019-0592-8. Epub 2019 Oct 21.

Large loss of CO2 in winter observed across the northern permafrost region

Susan M Natali  1 Jennifer D Watts  1 Brendan M Rogers  1 Stefano Potter  1 Sarah M Ludwig  1 Anne-Katrin Selbmann  2 Patrick F Sullivan  3 Benjamin W Abbott  4 Kyle A Arndt  5 Leah Birch  1 Mats P Björkman  6 A Anthony Bloom  7 Gerardo Celis  8 Torben R Christensen  9 Casper T Christiansen  10 Roisin Commane  11 Elisabeth J Cooper  12 Patrick Crill  13 Claudia Czimczik  14 Sergey Davydov  15 Jinyang Du  16 Jocelyn E Egan  17 Bo Elberling  18 Eugenie S Euskirchen  19 Thomas Friborg  20 Hélène Genet  19 Mathias Göckede  21 Jordan P Goodrich  5   22 Paul Grogan  23 Manuel Helbig  24   25 Elchin E Jafarov  26 Julie D Jastrow  27 Aram A M Kalhori  5 Yongwon Kim  28 John Kimball  16 Lars Kutzbach  29 Mark J Lara  30 Klaus S Larsen  20 Bang-Yong Lee  31 Zhihua Liu  32 Michael M Loranty  33 Magnus Lund  9 Massimo Lupascu  34 Nima Madani  7 Avni Malhotra  35 Roser Matamala  27 Jack McFarland  36 A David McGuire  19 Anders Michelsen  37 Christina Minions  1 Walter C Oechel  5   38 David Olefeldt  39 Frans-Jan W Parmentier  40   41 Norbert Pirk  40   41 Ben Poulter  42 William Quinton  43 Fereidoun Rezanezhad  44 David Risk  45 Torsten Sachs  46 Kevin Schaefer  47 Niels M Schmidt  48 Edward A G Schuur  8 Philipp R Semenchuk  49 Gaius Shaver  50 Oliver Sonnentag  25 Gregory Starr  51 Claire C Treat  52 Mark P Waldrop  36 Yihui Wang  5 Jeffrey Welker  53   54 Christian Wille  46 Xiaofeng Xu  5 Zhen Zhang  55 Qianlai Zhuang  56 Donatella Zona  5   57
Affiliations

Large loss of CO2 in winter observed across the northern permafrost region

Susan M Natali et al. Nat Clim Chang. 2019 Nov.

Abstract

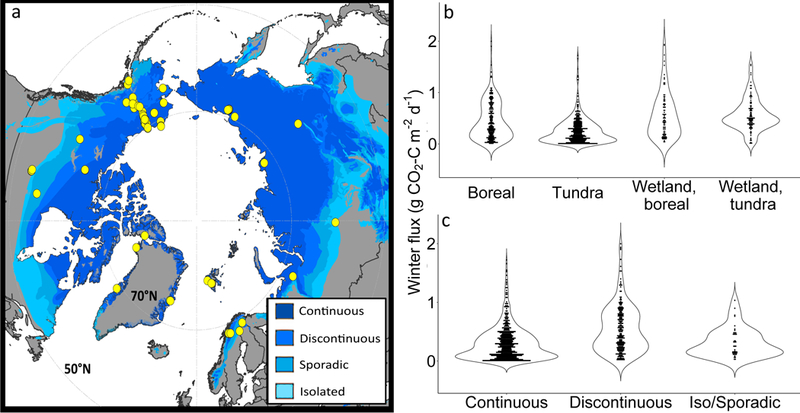
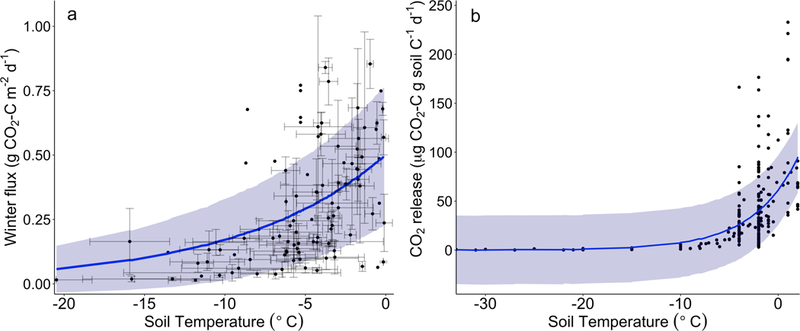
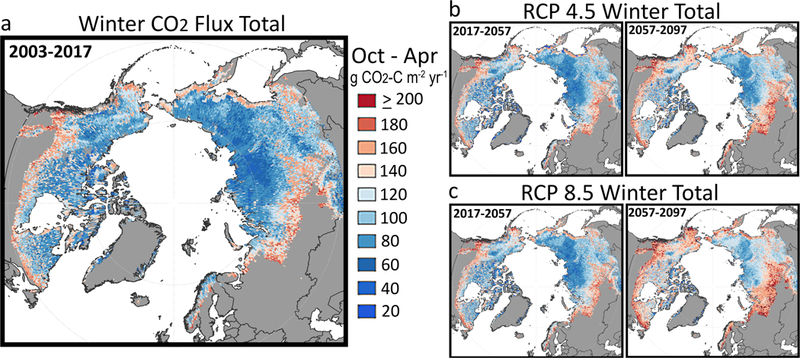
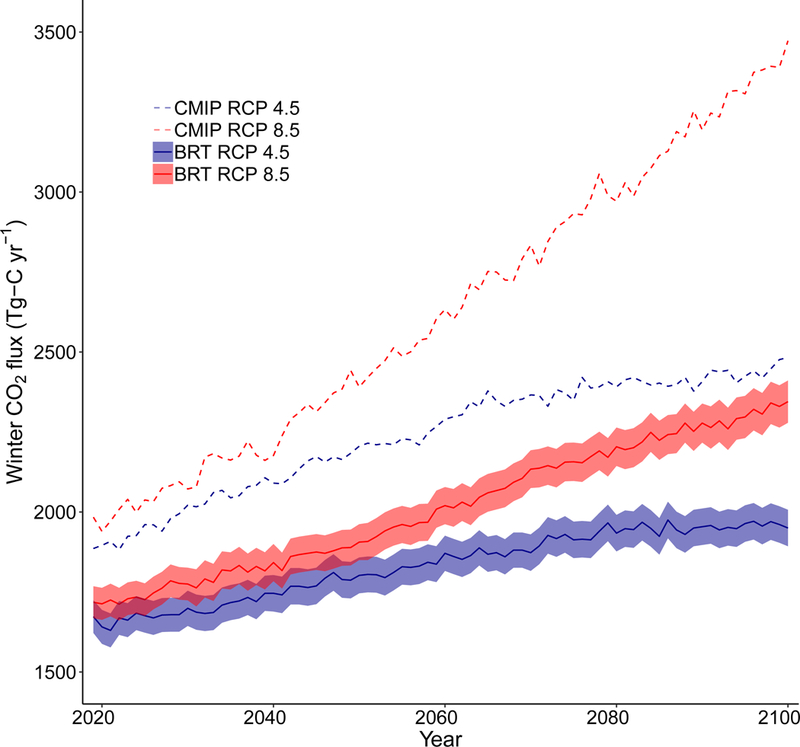
Recent warming in the Arctic, which has been amplified during the winter1-3, greatly enhances microbial decomposition of soil organic matter and subsequent release of carbon dioxide (CO2)4. However, the amount of CO2 released in winter is highly uncertain and has not been well represented by ecosystem models or by empirically-based estimates5,6. Here we synthesize regional in situ observations of CO2 flux from arctic and boreal soils to assess current and future winter carbon losses from the northern permafrost domain. We estimate a contemporary loss of 1662 Tg C yr-1 from the permafrost region during the winter season (October through April). This loss is greater than the average growing season carbon uptake for this region estimated from process models (-1032 Tg C yr-1). Extending model predictions to warmer conditions in 2100 indicates that winter CO2 emissions will increase 17% under a moderate mitigation scenario-Representative Concentration Pathway (RCP) 4.5-and 41% under business-as-usual emissions scenario-RCP 8.5. Our results provide a new baseline for winter CO2 emissions from northern terrestrial regions and indicate that enhanced soil CO2 loss due to winter warming may offset growing season carbon uptake under future climatic conditions.


Figures

Fig. 1.
Fig. 1.. Distribution of in situ data included in this winter CO2 flux synthesis.
(a) Locations of in situ winter CO2 flux data (yellow circles) in this synthesis include (b) upland and wetland sites in boreal and tundra biomes located (c) within the northern permafrost region. Violin plots (b,c) depict magnitude and distribution density (width; dots are monthly aggregated data) of in situ data used in our machine-learning model.
Fig. 2.
Fig. 2.. Effect of soil temperature on CO2 release from soils.
(a) Relationships between in situ soil temperature (~ 10 cm average depth) and CO2 fluxes and (b) temperature and CO2 released from lab incubations. Shading represents the standard deviation of an exponential model, which, for in situ fluxes, was fit to mean CO2 flux from each sample location (symbols shown with standard error). Note that the different soil temperature scales between panels reflect data ranges.
Fig. 3.
Fig. 3.. Pan-Arctic winter CO2 emissions under current and future climate scenarios.
(a) Average annual winter (October - April) CO2 emissions estimated for the permafrost region for the baseline years 2003–2017. Cumulative winter CO2 fluxes under (b) RCP 4.5 and (c) RCP 8.5 scenarios over an 80-year period (2017–2057 and 2057–2097). Fluxes are reported on an annual basis (g CO2-C m−2 yr−1).
Fig. 4.
Fig. 4.. Projected annual CO2 emissions during the winter for the northern permafrost region.
Solid lines represent BRT modeled results through 2100 under RCP 4.5 (blue solid line) and RCP 8.5 (red solid line), with bootstrapped 95% confidence intervals indicated by shading. For reference, CMIP5 ensemble respiration for RCP 4.5 and 8.5 are also shown (dashed lines).

References

    1. Huang J. Recently amplified arctic warming has contributed to a continual global warming trend. Nat. Clim. Change 7, 875–879 (2017).
    1. Koenigk T. et al. Arctic climate change in 21st century CMIP5 simulations with EC-Earth. Clim. Dyn 40, 2719–2743 (2013).
    1. Cohen J, Screen JA, Furtado JC, Barlow M, et al. Recent Arctic amplification and extreme mid-latitude weather. Nature Geosci. 7, 627–637 (2014).
    1. Schadel C, Bader MK-F, Schuur EAG, Biasi C, Bracho R. et al. Potential carbon emissions dominated by carbon dioxide from thawed permafrost soils. Nat. Clim. Change 6, 950–953 (2016).
    1. Fisher JB et al. Carbon cycle uncertainty in the Alaskan Arctic. Biogeosciences 11, 4271–4288 (2014).

Methods References

    1. Brown J, Ferrians O, Heginbottom J & Melnikov E. Circum-Arctic map of permafrost and ground-ice conditions, version 2 (2002).
    1. Brodzik MJ, Billingsley B, Haran T, Raup B & Savoie MH EASE-Grid 2.0: Incremental but significant improvements for Earth-gridded data sets. ISPRS Int. J. Geo-Information 1, 32–45 (2012).
    1. R Core Team R: A language and environment for statistical computing. (2016).
    1. Ridgeway G. Generalized Boosted Models: A guide to the gbm package. 1–12 (2007).
    1. Elith J, Leathwick JR & Hastie T. A working guide to boosted regression trees. J. Anim. Ecol, 802–813 (2008). - PubMed