

Dynamics of Donor-Derived Cell-Free DNA at the Early Phase After Pediatric Kidney Transplantation: A Prospective Cohort Study
- PMID: 35071284
- PMCID: PMC8777035
- DOI: 10.3389/fmed.2021.814517
Dynamics of Donor-Derived Cell-Free DNA at the Early Phase After Pediatric Kidney Transplantation: A Prospective Cohort Study
Abstract
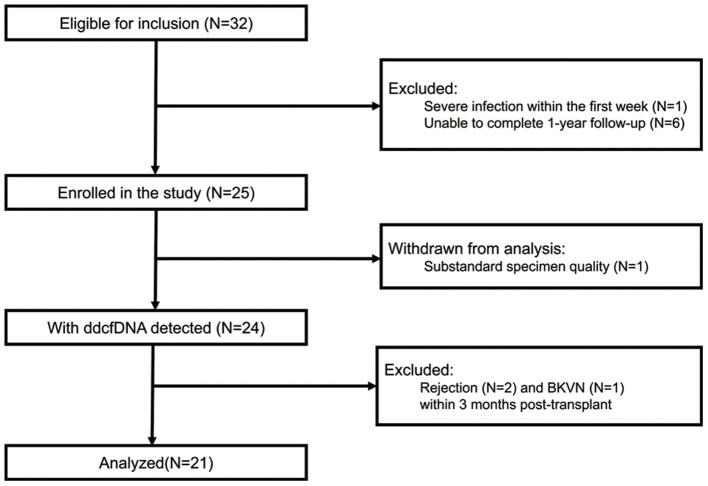
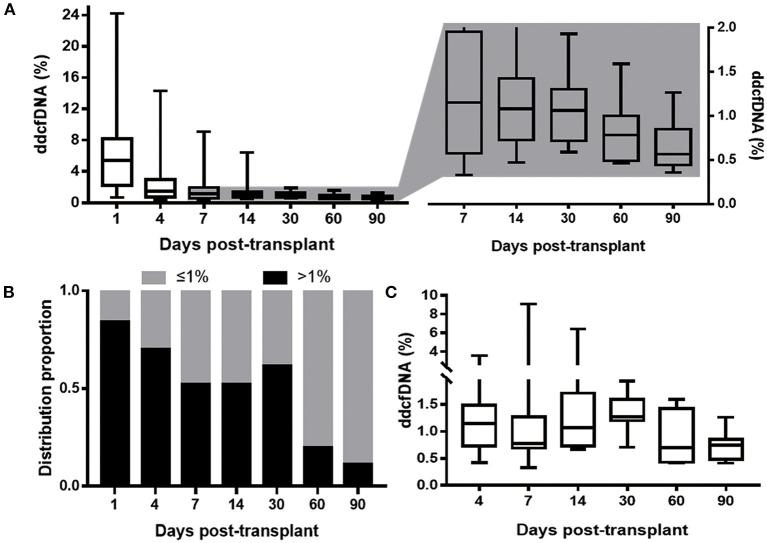
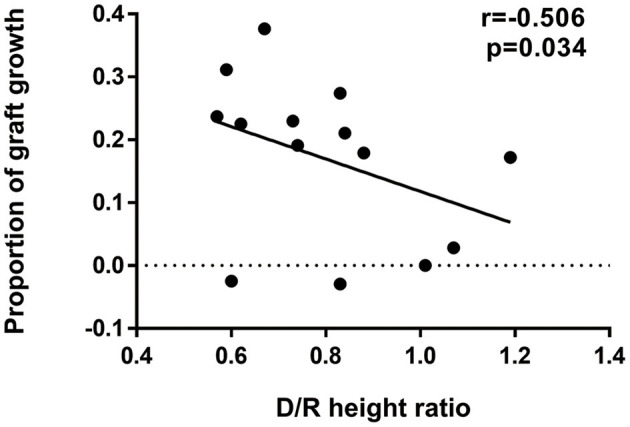
Background: Donor-derived cell-free DNA (ddcfDNA) has been suggested as an indicator of allograft injury in adult and pediatric kidney transplantation (KTx). However, the dynamics of ddcfDNA in pediatric KTx have not been investigated. In addition, it has not been demonstrated whether donor-recipient (D/R) size mismatch affect ddcfDNA level. Methods: Pediatric KTx recipients with a single donor kidney were enrolled and followed up for 1 year. ddcfDNA, calculated as a fraction (%) in the recipient plasma, was examined longitudinally within 3 months post-transplant. D/R size mismatch degree was described as D/R height ratio. The 33rd percentile of D/R height ratio (0.70) was used as the cut-off to divide the patients into low donor-recipient height ratio group (<0.70) and high donor-recipient height ratio group (≥0.70). The dynamics of ddcfDNA were analyzed and the impact factors were explored. Stable ddcfDNA was defined as the first lowest ddcfDNA. ddcfDNA flare-up was defined as a remarkable elevation by a proportion of >30% from stable value with a peak value >1% during elevation. Results: Twenty-one clinically stable recipients were enrolled. The median D/R height ratio was 0.83 (0.62-0.88). It took a median of 8 days for ddcfDNA to drop from day 1 and reach a stable value of 0.67% (0.46-0.73%). Nevertheless, 61.5% patients presented ddcfDNA>1% at day 30. Besides, 81.0% (17/21) of patients experienced elevated ddcfDNA and 47.6% (10/21) met the standard of ddcfDNA flare-up. Donor-recipient height ratio was an independent risk factor for ddcfDNA flare-up (odds ratio = 0.469 per 0.1, 95% CI 0.237-0.925, p = 0.029) and low donor-recipient height ratio (<0.70) was found to increase the risk of flare-up occurrence (odds ratio = 15.00, 95% CI 1.342-167.638, p = 0.028). Conclusions: ddcfDNA rebounds in many stable pediatric KTx recipients without rejection. This may be induced by significant D/R size mismatch and may affect its diagnostic performance at the early phase after pediatric KTx in children.
Keywords: donor-derived cell-free DNA; donor-recipient size mismatch; dynamics; pediatric donor; pediatric kidney transplantation.
Copyright © 2022 Nie, Su, Liu, Li, Fu, Li, Wu, Wang, Deng, Chen, Yang, Li, Zhang and Wang.
Conflict of interest statement
The authors declare that the research was conducted in the absence of any commercial or financial relationships that could be construed as a potential conflict of interest. The reviewer BN declared a past co-authorship with several of the authors XS, LL, JL, QF, CWu, RD, HZ, and CWa to the handling editor.
Figures
References
LinkOut - more resources
Full Text Sources
Miscellaneous