. 2022 Jan 5:8:698179.
doi: 10.3389/fsurg.2021.698179. eCollection 2021.

A Novel Three-Dimensional Computational Method to Assess Rod Contour Deformation and to Map Bony Fusion in a Lumbopelvic Reconstruction After En-Bloc Sacrectomy

Affiliations

A Novel Three-Dimensional Computational Method to Assess Rod Contour Deformation and to Map Bony Fusion in a Lumbopelvic Reconstruction After En-Bloc Sacrectomy

Peter Endre Eltes et al. Front Surg. .

Abstract

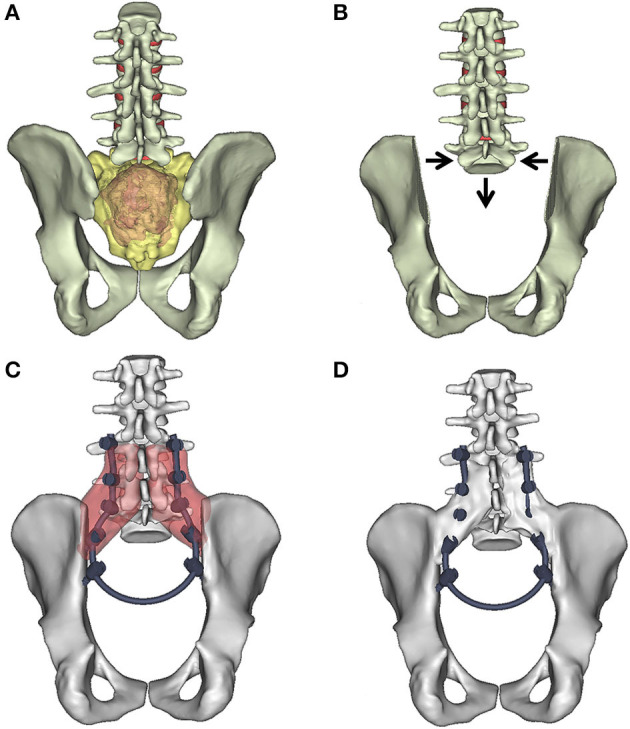
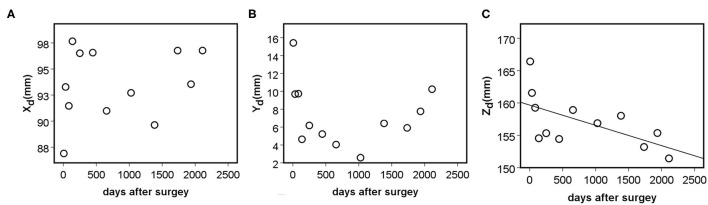
Introduction: En-bloc resection of a primary malignant sacral tumor with wide oncological margins impacts the biomechanics of the spinopelvic complex, deteriorating postoperative function. The closed-loop technique (CLT) for spinopelvic fixation (SPF) uses a single U-shaped rod to restore the spinopelvic biomechanical integrity. The CLT method was designed to provide a non-rigid fixation, however this hypothesis has not been previously tested. Here, we establish a computational method to measure the deformation of the implant and characterize the bony fusion process based on the 6-year follow-up (FU) data. Materials and Methods: Post-operative CT scans were collected of a male patient who underwent total sacrectomy at the age of 42 due to a chordoma. CLT was used to reconstruct the spinopelvic junction. We defined the 3D geometry of the implant construct. Using rigid registration algorithms, a common coordinate system was created for the CLT to measure and visualize the deformation of the construct during the FU. In order to demonstrate the cyclical loading of the construct, the patient underwent gait analysis at the 6th year FU. First, a region of interest (ROI) was selected at the proximal level of the construct, then the deformation was determined during the follow-up period. In order to investigate the fusion process, a single axial slice-based voxel finite element (FE) mesh was created. The Hounsfield values (HU) were determined, then using an empirical linear equation, bone mineral density (BMD) values were assigned for every mesh element, out of 10 color-coded categories (1st category = 0 g/cm3, 10th category 1.12 g/cm3). Results: Significant correlation was found between the number of days postoperatively and deformation in the sagittal plane, resulting in a forward bending tendency of the construct. Volume distributions were determined and visualized over time for the different BMD categories and it was found that the total volume of the elements in the highest BMD category in the first postoperative CT was 0.04 cm3, at the 2nd year, FU was 0.98 cm3, and after 6 years, it was 2.30 cm3. Conclusion: The CLT provides a non-rigid fixation. The quantification of implant deformation and bony fusion may help understate the complex lumbopelvic biomechanics after sacrectomy.

Keywords: biomechanics; bone mineral density; bony fusion; computational method; computed tomography; implant deformation; lumbopelvic reconstruction; sacrectomy.


Conflict of interest statement

The authors declare that the research was conducted in the absence of any commercial or financial relationships that could be construed as a potential conflict of interest.

Figures

Figure 1
Figure 1
“Closed-Loop” lumbosacral reconstruction technique after total en-bloc sacrectomy. (A) Extended tumor mass affects the whole sacrum. (B) Geometrical change in the 3D geometry of the spino-pelvic junction after en-bloc total sacrectomy. The iliac bone is cut by an oscillating saw bilaterally; the medial cortical surface of the iliac bone is left on the specimen. The lumbosacral facet joints with the intervertebral discs are removed. The dural sac (together with the cauda equina) is cut through immediately below L5. The distance between the L5 vertebra and the iliac bone is reduced (direction of the arrows). (C) In the L3–5 vertebral body and bilaterally into the iliac bones, screws are inserted and connected with a single 5.5 mm diameter “U” shaped rod according to the patient's reduced (C) local dimensions and attached to the screws. The red areas mark the place for the artificial bone substitute, mixed with autologous bone graft. (D) The re-established connection between the lumbar spine and the pelvis. At the side of the graft (D) after 2 years bony fusion is expected.
Figure 2
Figure 2
Pre- and postop imaging of a 42 years old male patient who underwent total en-block sacrectomy and received a Closed-Loop spino-pelvic reconstruction. (A,B) Preop T2, MRI images of a large sacral chordoma [(A) sagittal, (B) axial plane]. The extended tumor mass affected the whole sacrum with significant soft tissue extension to the retroperitoneum and cranially involving the paravertebral muscles. (C,D) Standing X-ray images of the patient at 6-month FU [(C) sagittal, (D) coronal plane]. (E,F) CT scan at 24-month FU period. Signs of bony fusion are visible between the L4 and L5 vertebrae and the iliac bone [(E) posterior view of the 3D rendered CT images; (F) coronal view at the fusion site].
Figure 3
Figure 3
Post-op CT scan-based geometry definition and alignment. (A) Thresholding based segmentation was performed on the postop CT scans in order to define the left pelvic bone and the implant construct. (B) Eight points corresponding to anatomical landmarks were used for the simultaneous registration of the pelvic bone and implant construct geometry. (C) Every postop pelvic bone + implant construct geometry was registered to the first postop geometry. (D) The Hausdorff Distance was used as a metric for the alignment accuracy evaluation. Geometrical reduction of the caudal and posterior parts of the registered pelvic bones was performed. (E) The trans-iliac screw bodies geometry overlapped after the pelvic bone registration. (F) The axes of the iliac screws were considered collinear and coincident.
Figure 4
Figure 4
Implant construct geometry simplification and deformation measurement. (A) The segmented geometry of the implant construct was considered a tubular structure, the centreline of the geometry was defined. (B–D) A fixed point (red dot) was selected in the centreline corresponding to the tip of the caudal trans iliac screw, and a mobile point (blue dot) corresponding to the L2 right pedicle screw tip. The distance between the points was determined (B) in the coronal plane (Xd), (C) sagittal plane (Zd), (D) axial plane (Yd).
Figure 5
Figure 5
Evaluation of the bony fusion process between the L5 vertebra and the two iliac bones. (A) From all the 12 CT scans the same region of interest (midplane between the right L4 and L5 pedicle screw) an axial slice was selected. (B) The bony elements were segmented in the selected slice. (C) A homogeneous mask was created corresponding to the segmented bony elements. (D) A voxel-based FE mesh was created based on the segmented mask. (E) A linear relationship was used to assign the bone mineral density values for the corresponding Hounsfield values. (F) In the voxel-based FE mesh, every voxel was coded with a color code corresponding to the BMD.
Figure 6
Figure 6
Geometric overlap of the body of the iliac screws after the alignment process. The 12 postop CT scan-based surface mesh representing the iliac screw bodies are color-coded corresponding to the scale bar (color = CT scan session + number of days after surgery). The surfaces mesh is visualized with 75% transparency.
Figure 7
Figure 7
Association between the distance of the mobile (L2 right pedicle screw tip) point from the fixed point (left, caudal trans iliac screw tip) in the anatomical planes, and the number of days after surgery (DAS). (A) Non-significant positive, moderate correlation was found between the Xd (frontal plane) and DAS (ρ = 0.336, p = 0.286). (B) Non-significant, negative, weak correlation was found between the Yd (axial plane) and DAS (ρ = −0.182, p = 0.572). (C) Significant, negative, and strong correlation was found between the Zd (sagittal plane) and the number of days after surgery (ρ = −0.664, p = 0.018).
Figure 8
Figure 8
Mapping of the fusion and remodeling process. (AL) Represents the region of interest for the 12 postop CT scans (from 7 to 2,112 days). The BMD values are represented in 10 color codes from 0 to 1.12 g/cm3 on an RGB scale. Red color represents the strongest bone tissue. The provided scale bar's length is 2 cm.
Figure 9
Figure 9
Distribution of bone volume in the 10 BMD category over the follow up period. The bone volume is defined using the FE mesh voxel dimensions. The BMD categories from 1 to 10 correspond to the color code from (8) (1st category = 0 g/cm3, 10th category 1.12 g/cm3).
Figure 10
Figure 10
Association between BMD categories' volumetric change and the days after surgery and the distance of the mobile (L2 right pedicle screw tip) point from the fixed point (left, caudal trans iliac screw tip) in the anatomical planes. (A) Significant positive, very strong correlation (ρ > 0.800, p < 0.050) was found between the highest 6 BMD categories (marked with “*”) and the days after surgery. (B) Significant positive, strong correlation was found between the Xd (frontal plane) and the third BMD category (ρ = 0.678, p = 0.015). (C) Significant negative, strong correlation (ρ > 0.600, p < 0.050) was found between 3 high value BMD categories (marked with “*”) and the Zd (sagittal plane) measurements.

Similar articles

Cited by

References

    1. Varga PP, Bors I, Lazary A. Sacral tumors and management. Orthop Clin North Am. (2009) 40:105–123. 10.1016/j.ocl.2008.09.010 - DOI - PubMed
    1. Disler DG, Miklic D. Imaging findings in tumors of the sacrum. AJR Am J Roentgenol. (1999) 173:1699–706. 10.2214/ajr.173.6.10584822 - DOI - PubMed
    1. Jo VY, Fletcher CDM. WHO classification of soft tissue tumours: an update based on the 2013 (4th) edition. Pathology. (2014) 46:95–104. 10.1097/PAT.0000000000000050 - DOI - PubMed
    1. Fourney DR, Rhines LD, Hentschel SJ, Skibber JM, Wolinsky J-P, Weber KL, et al. . En bloc resection of primary sacral tumors: classification of surgical approaches and outcome. J Neurosurg Spine. (2005) 3:111–22. 10.3171/spi.2005.3.2.0111 - DOI - PubMed
    1. Zoccali C, Skoch J, Patel AS, Walter CM, Maykowski P, Baaj AA. Residual neurological function after sacral root resection during en-bloc sacrectomy: a systematic review. Eur Spine J. (2016) 25:3925–31. 10.1007/s00586-016-4450-3 - DOI - PubMed