Identification of key genes associated with esophageal adenocarcinoma based on bioinformatics analysis
- PMID: 35071405
- PMCID: PMC8743722
- DOI: 10.21037/atm-21-4015
Identification of key genes associated with esophageal adenocarcinoma based on bioinformatics analysis
Abstract
Background: Esophageal adenocarcinoma (EAC) is an aggressive malignancy and accounts for the majority of cancer-related death worldwide. It is often diagnosed at an advanced stage and entails a poor prognosis for those afflicted. The mechanisms of its pathogenesis and progress remain unclear and require urgent elucidation. This study aimed to identify specific genes and potential pathways associated with the progression and prognosis of EAC using bioinformatics analyses.
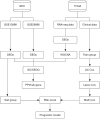
Methods: EAC microarray datasets from the Gene Expression Omnibus (GEO) and The Cancer Genome Atlas (TCGA) databases were analyzed to identify differentially expressed genes (DEGs) using bioinformatics analysis. The DEGs in TCGA were then analyzed to construct a co-expression network by weighted correlation network analysis (WGCNA), and module-clinical trait relationships were analyzed to explore the genes that associated with clinicopathological parameters of EAC. Gene ontology (GO) terms and Kyoto Encyclopedia of Genes and Genomes (KEGG) pathways analyses were performed for the cancer-related genes, and a DEG-based protein-protein interaction (PPI) network was used to extract hub genes through Cytoscape plugins. The consensus survival analysis for EAC (OSeac) was performed to identify the prognosis-related genes. The immune infiltration was evaluated by tumor immune estimation resource (TIMER) algorithms, and a risk score prognostic model was established using univariate, multivariate Cox proportional hazards regression, and lasso regression analysis.
Results: Ultimately, 190 cancer-related DEGs were identified, 6 of which were found to play vital roles in the progression of EAC, including ACTA2, BGN, CALD1, COL1A1, COL4A1, and DCN. The risk score prognostic model consisted of 6 other genes that had an important impact on the prognosis of EAC, including CLDN3, EPB41L4A, ESM1, MT1X, PAQR5, and PLAU. The area under the curve of the prognostic model for predicting the survival of patients at 1, 2, and 3 years was 0.707, 0.702, and 0.726, respectively.
Conclusions: This study identified several genes with the potential to become useful targets for the diagnosis and treatment of EAC. The 6-gene-related risk score prognostic model and nomogram based on these genes may be a reliable tool for predicting the prognosis of patients with EAC.
Keywords: Esophageal adenocarcinoma (EAC); bioinformatics analysis; protein-protein interaction (PPI); risk score prognosis model; weighted gene co-expression network analysis (WGCNA).
2021 Annals of Translational Medicine. All rights reserved.
Conflict of interest statement
Conflicts of Interest: All authors have completed the ICMJE uniform disclosure form (available at https://dx.doi.org/10.21037/atm-21-4015). The authors have no conflicts of interest to declare.
Figures


Similar articles
-
Integrated PPI- and WGCNA-Retrieval of Hub Gene Signatures Shared Between Barrett's Esophagus and Esophageal Adenocarcinoma.Front Pharmacol. 2020 Jul 31;11:881. doi: 10.3389/fphar.2020.00881. eCollection 2020. Front Pharmacol. 2020. PMID: 32903837 Free PMC article.
-
Biomarker identification and trans-regulatory network analyses in esophageal adenocarcinoma and Barrett's esophagus.World J Gastroenterol. 2019 Jan 14;25(2):233-244. doi: 10.3748/wjg.v25.i2.233. World J Gastroenterol. 2019. PMID: 30670912 Free PMC article.
-
Development and Validation of a Prognostic Model for Esophageal Adenocarcinoma Based on Necroptosis-Related Genes.Genes (Basel). 2022 Nov 29;13(12):2243. doi: 10.3390/genes13122243. Genes (Basel). 2022. PMID: 36553511 Free PMC article.
-
Development and validation of a survival model for esophageal adenocarcinoma based on autophagy-associated genes.Bioengineered. 2021 Dec;12(1):3434-3454. doi: 10.1080/21655979.2021.1946235. Bioengineered. 2021. PMID: 34252349 Free PMC article.
-
Towards Personalized Treatment Strategies for Esophageal Adenocarcinoma; A Review on the Molecular Characterization of Esophageal Adenocarcinoma and Current Research Efforts on Individualized Curative Treatment Regimens.Cancers (Basel). 2021 Sep 29;13(19):4881. doi: 10.3390/cancers13194881. Cancers (Basel). 2021. PMID: 34638363 Free PMC article. Review.
Cited by
-
PAQR5 drives the malignant progression and shapes the immunosuppressive microenvironment of hepatocellular carcinoma by activating the NF-κB signaling.Biomark Res. 2025 May 7;13(1):70. doi: 10.1186/s40364-025-00785-z. Biomark Res. 2025. PMID: 40336138 Free PMC article.
-
Integrative bioinformatics analysis of high-throughput sequencing and in vitro functional analysis leads to uncovering key hub genes in esophageal squamous cell carcinoma.Hereditas. 2025 Mar 14;162(1):38. doi: 10.1186/s41065-025-00398-4. Hereditas. 2025. PMID: 40087784 Free PMC article.
-
Nomograms for prognosis prediction in esophageal adenocarcinoma: realities and challenges.Clin Transl Oncol. 2025 Feb;27(2):449-457. doi: 10.1007/s12094-024-03589-z. Epub 2024 Jul 31. Clin Transl Oncol. 2025. PMID: 39083141 Review.
-
Network and pathway-based analysis of candidate genes associated with esophageal adenocarcinoma.J Gastrointest Oncol. 2023 Feb 28;14(1):40-53. doi: 10.21037/jgo-22-1286. Epub 2023 Feb 15. J Gastrointest Oncol. 2023. PMID: 36915458 Free PMC article.
-
EsoDetect: computational validation and algorithm development of a novel diagnostic and prognostic tool for dysplasia in Barrett's esophagus.PeerJ. 2025 Jul 3;13:e19613. doi: 10.7717/peerj.19613. eCollection 2025. PeerJ. 2025. PMID: 40620772 Free PMC article.
References
LinkOut - more resources
Full Text Sources
Miscellaneous
