. 2021 Dec 31;25(1):103718.
doi: 10.1016/j.isci.2021.103718. eCollection 2022 Jan 21.

Ultra-high-throughput Ca2+ assay in platelets to distinguish ITAM-linked and G-protein-coupled receptor activation

Affiliations

Ultra-high-throughput Ca2+ assay in platelets to distinguish ITAM-linked and G-protein-coupled receptor activation

Delia I Fernández et al. iScience. .

Abstract

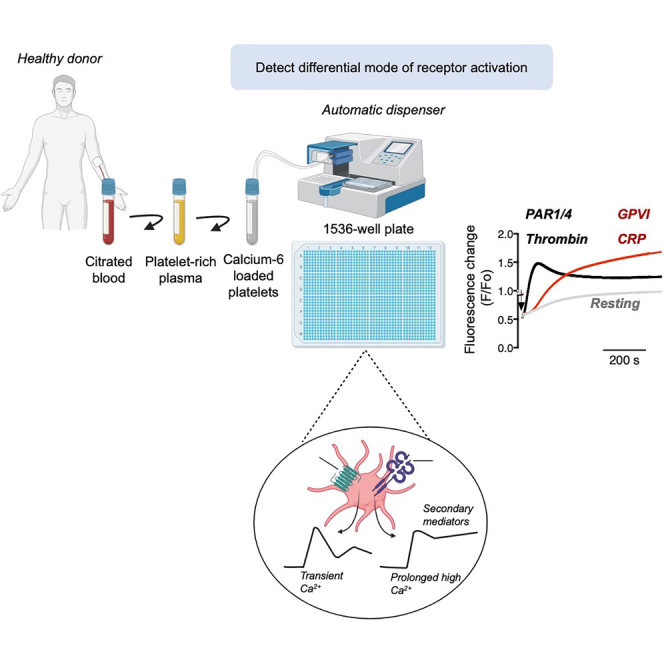
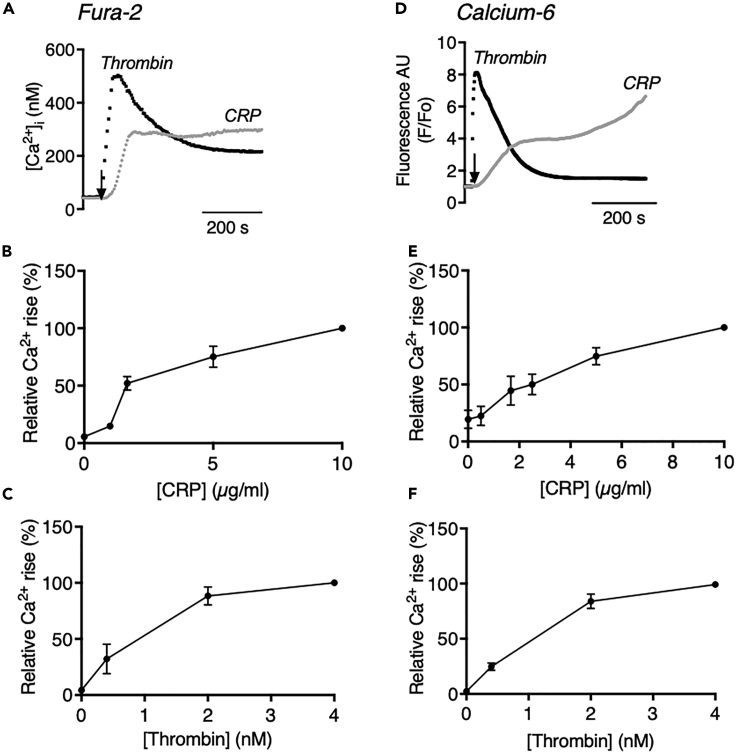
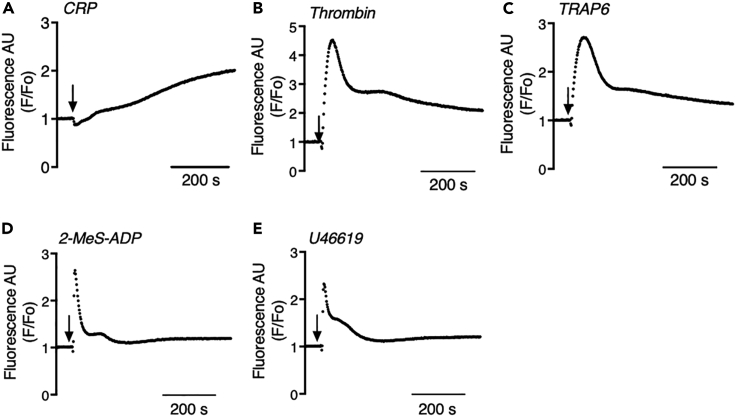
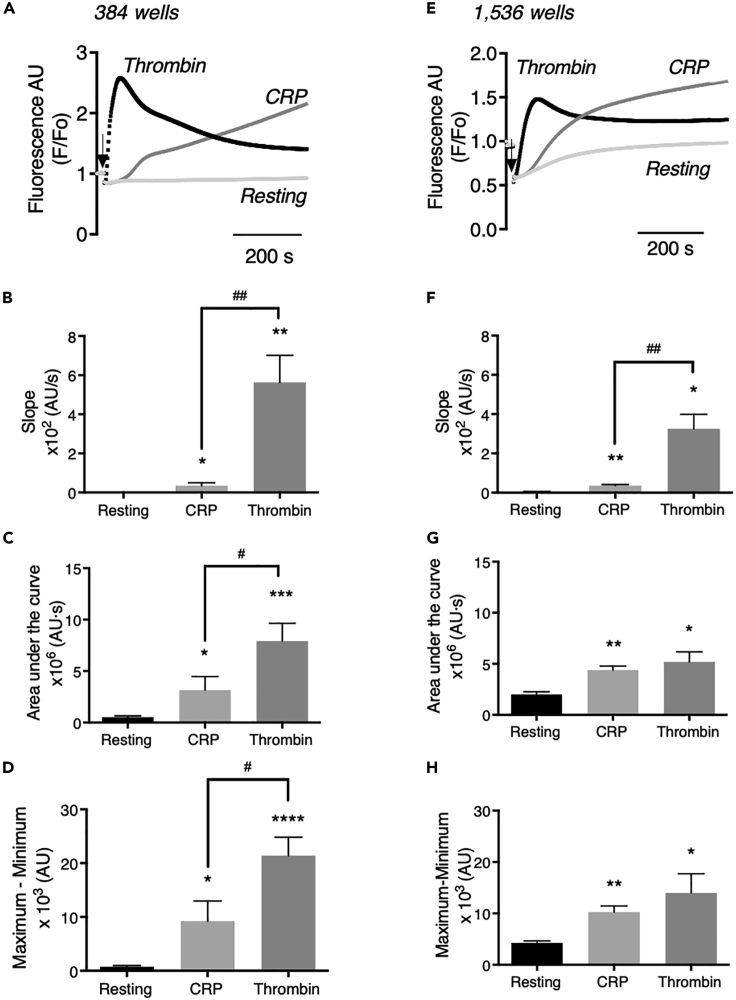
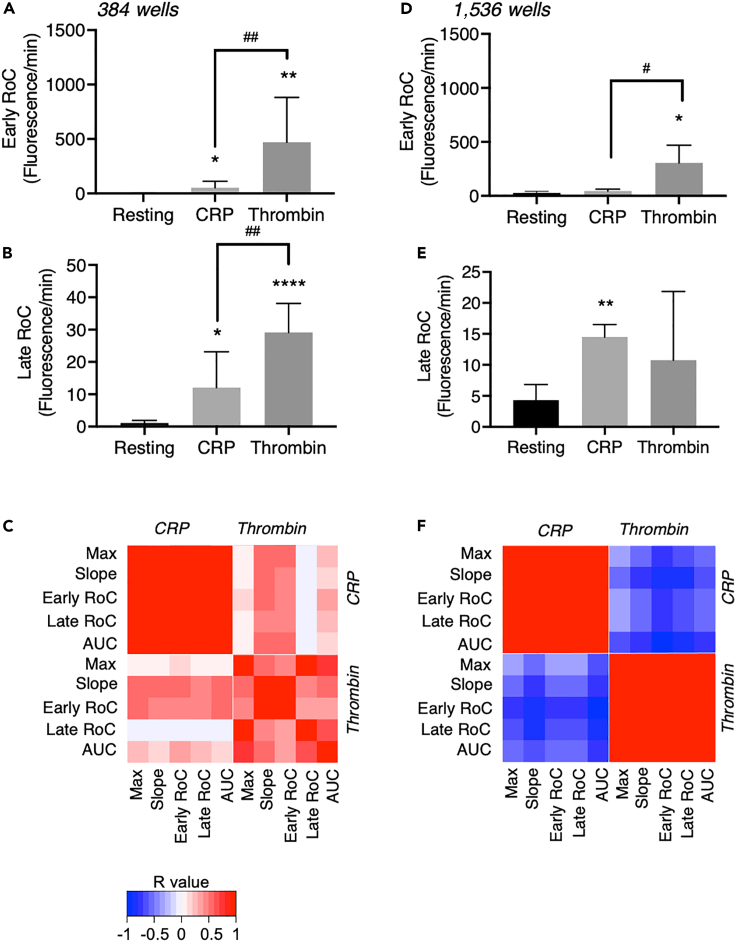
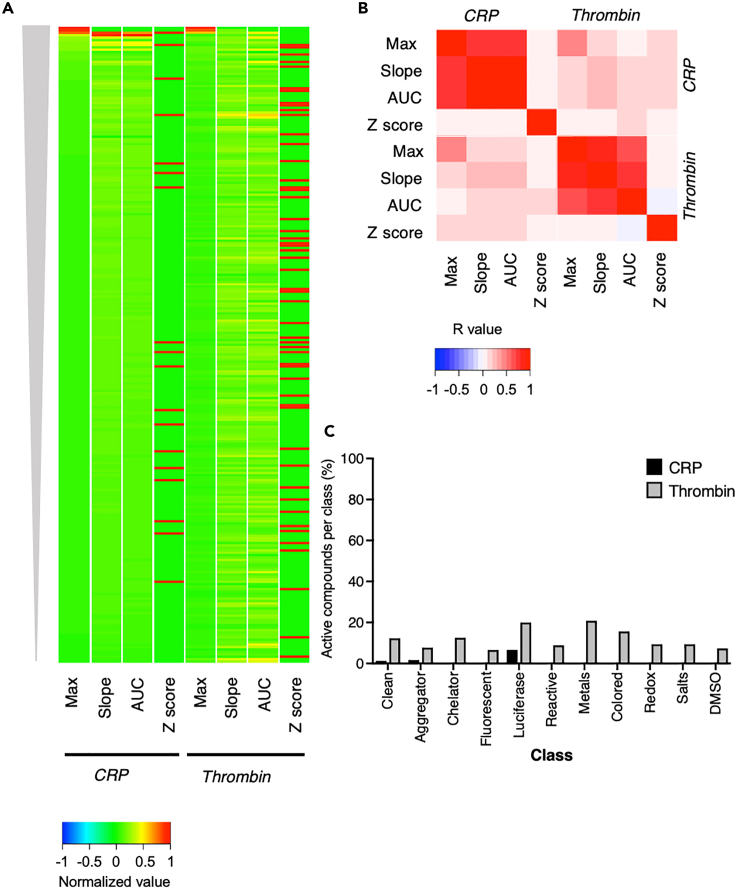
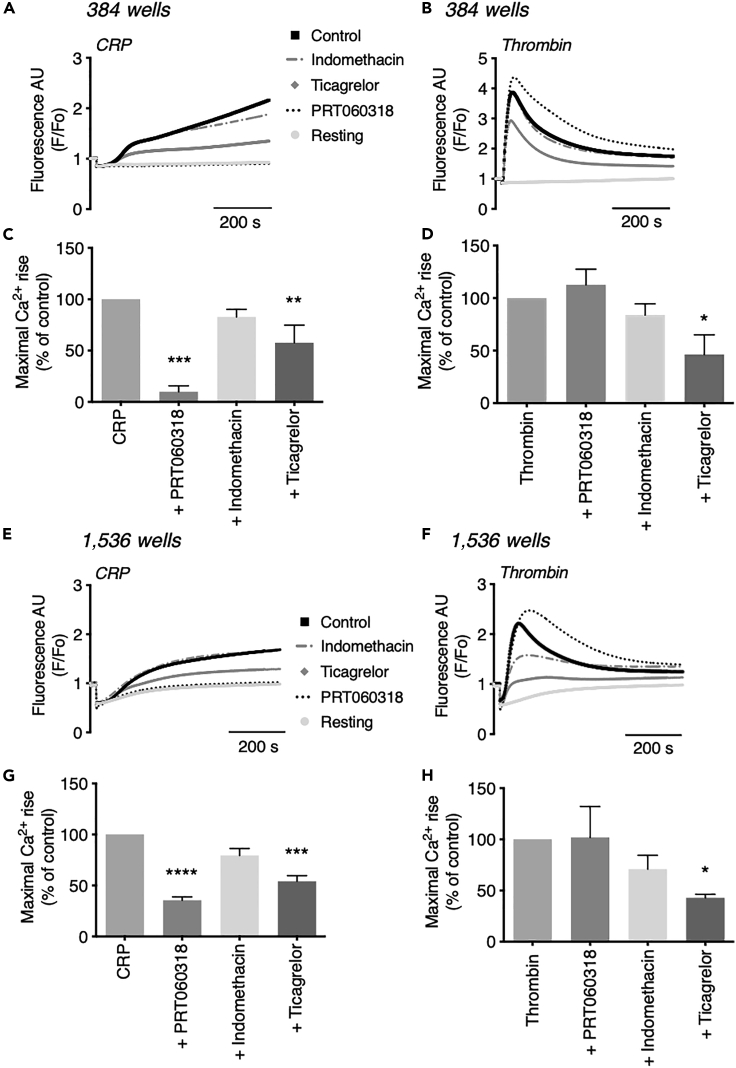
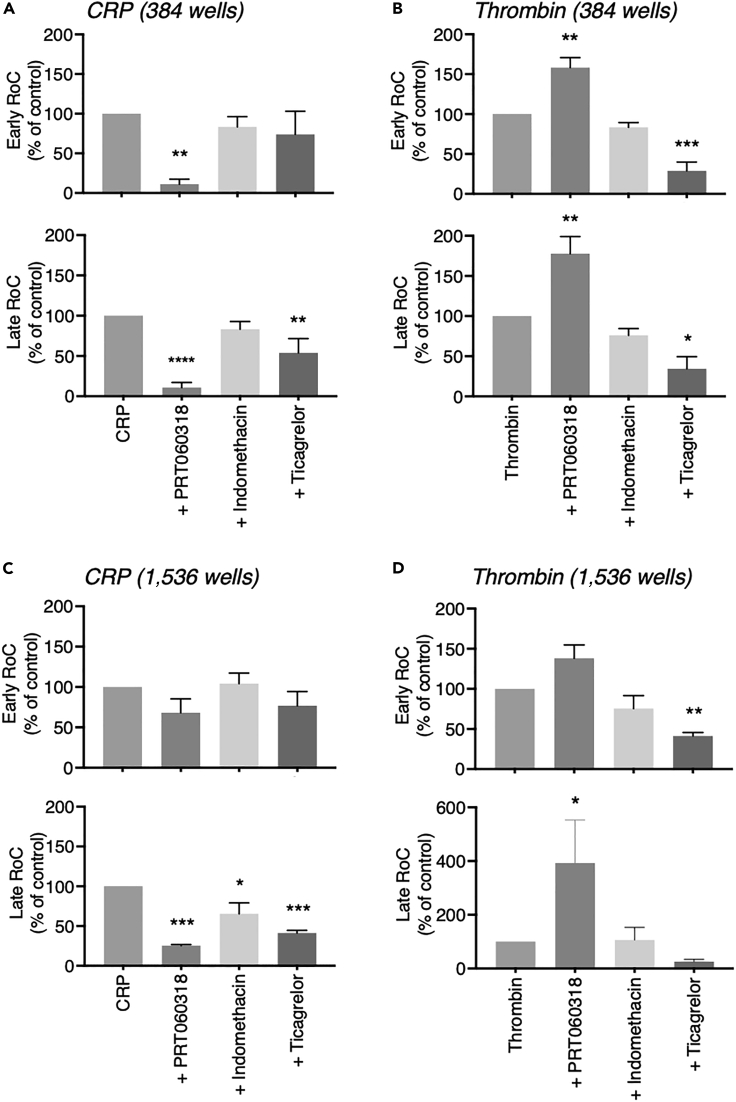
Antiplatelet drugs targeting G-protein-coupled receptors (GPCRs), used for the secondary prevention of arterial thrombosis, coincide with an increased bleeding risk. Targeting ITAM-linked receptors, such as the collagen receptor glycoprotein VI (GPVI), is expected to provide a better antithrombotic-hemostatic profile. Here, we developed and characterized an ultra-high-throughput (UHT) method based on intracellular [Ca2+]i increases to differentiate GPVI and GPCR effects on platelets. In 96-, 384-, or 1,536-well formats, Calcium-6-loaded human platelets displayed a slow-prolonged or fast-transient [Ca2+]i increase when stimulated with the GPVI agonist collagen-related peptide or with thrombin and other GPCR agonists, respectively. Semi-automated curve fitting revealed five parameters describing the Ca2+ responses. Verification of the UHT assay was done with a robustness compound library and clinically relevant platelet inhibitors. Taken together, these results present proof of principle of distinct receptor-type-dependent Ca2+ signaling curves in platelets, which allow identification of new inhibitors in a UHT way.

Keywords: Cell biology; Functional aspects of cell biology; Methodology in biological sciences.


Conflict of interest statement

J.W.M.H. is a cofounder and shareholder of FlowChamber B.V. The other authors declare no relevant conflicts of interest.

Figures

None
Graphical abstract
Figure 1
Figure 1
Comparison of agonist-induced [Ca2+]i increases of platelets loaded with Fura-2 or Calcium-6 in 96-well format (A–F) Washed human platelets (200 × 109 platelets/L) were loaded with Fura-2 (A–C) or Calcium-6 (D–F). Aliquots in 96-well plates were evaluated for changes in fluorescence upon stimulation with maximally effective CRP (10 μg/mL) or thrombin (4 nM) by automated pipetting in a FlexStation 3 robot. (A) Calibrated nanomolar increases in [Ca2+]i with Fura-2 by 340/380 nm ratio fluorometry. (D) Pseudo-ratioed F/Fo increases with Calcium-6 obtained by single wavelength recording. Shown are representative traces. (B and E) Dose-response curves of [Ca2+]i increase with CRP (0.5–10 μg/mL), expressed as % of maximal increase. (C and F) Dose-response curves of [Ca2+]i increase with thrombin (0.4–4 nM), expressed as % of maximal increase. Means ± SEM, n = 3–6 donors.
Figure 2
Figure 2
Increases in [Ca2+]i in Calcium-6-loaded platelets by range of agonists in 384-well format (A–E) Calcium-6-loaded platelets (200 × 109 platelets/L) were injection stimulated with physiologically relevant receptor agonists CRP 10 μg/mL (A), thrombin 4 nM (B), TRAP6 10 μM (C), Me-S-ADP 10 μM (D), or U46619 10 μM (E) in 384-well plates. Arrows indicate addition of agonists. Pseudo-ratioed increases in F/Fo were measured using a FLIPR-Tetra robot over 600 s. Representative traces of at least three experiments.
Figure 3
Figure 3
Comparative thrombin- and CRP-induced [Ca2+]i increases of platelets in 384- and 1,536-well formats Using 384- or 1,526-well plates, Calcium-6-loaded platelets were stimulated with CRP (10 μg/mL, final concentration), thrombin (4 nM, final concentration), or vehicle medium (resting). Agonist injection volume and rate were optimized per well-plate format to obtain highest fluorescence increases with the FLIPR-Tetra machine. Time-dependent traces per well were constructed of pseudo-ratio fluorescence (F/Fo), indicative of changes in [Ca2+]i. (A–D) Results from 384-well plates with 50 μL platelets (200 × 109/L) and 5 μL agonist solution injected. Data are means ± SEM (n = 6). (E-H) Results from 1,536-well plates with 6 μL platelets (400 × 109/L) and 2 μL agonist solution injected. Means ± SEM (n = 3). (A and E) Representative [Ca2+]i traces of resting and CRP- or thrombin-stimulated platelets. (B and F) Measured slopes of pseudo-ratioed increases in fluorescence. (C and G) Maximum–minimum increases with CRP (over 600 s) or thrombin (peak level). Minimal fluorescence levels were determined after injection to exclude dilution effects. (D and H) Area under the curve of response over 600 s. One-tailed Student's t test, ∗p < 0.05, ∗∗p < 0.01, ∗∗∗p < 0.001, ∗∗∗∗p < 0.0001 versus resting; #p < 0.05, ##p < 0.01 CRP versus thrombin.
Figure 4
Figure 4
Comparative analysis of [Ca2+]i curve parameters of thrombin- and CRP-induced platelet responses in 384- and 1,536-well formats (A–F) Calcium-6-loaded platelets in 384-well (A–C) or 1,536-well (D–F) plates were stimulated with CRP or thrombin or left unstimulated, as in Figure 3. Fluorescence changes measured for 600 s were regressed to smoothed curves for the calculation of early (A and D) and late (B and E) rates of change (RoC) of the [Ca2+]i increases per agonist. (C and F) Pearson correlation analyses were performed for all curve parameters used for Ca2+ response quantification: maximum - minimum rise (Max), slope of increase (slope), early and late RoC, and area under the curve (AUC). (C and F). Shown are heatmapped Pearson correlation matrices of R values of the various curve parameters, with blue/red colors indicating negative or positive correlations for 384- and 1,536-well plates, respectively. Means ± SEM (n = 3–6). Non-parametric Mann-Whitney test (A and D) or one tailed Student's t test (B and E), ∗p < 0.05, ∗∗p < 0.005, ∗∗∗∗p < 0.0001 versus resting. (A–E) One-tailed Student's t test, #p < 0.05, ##p < 0.01 CRP versus thrombin.
Figure 5
Figure 5
Robustness assessment of CRP- and thrombin-induced measurements of Calcium-6-loaded platelets in 1,536-well plates Increases in [Ca2+]i of Calcium-6-loaded platelet concentrates in response to CRP (10 μg/mL) or thrombin (4 nM) were measured in 1,536-well plates. Multiplicate wells (n = 4) were preincubated with one of 263 compounds from a robustness set compound library (all 10 μM). Compounds were classified according to their potential assay interference: clean compounds (non-interfering), aggregating, metal ion chelating, fluorescent, luciferase quenching, chemically reactive, metal, colored or visible light absorbing, redox active, salt compounds, and DMSO controls. (A) Univariate scaled heatmap (−1 to 1) of mean interference of all 263 compounds in [Ca2+]i increases induced by CRP or thrombin. Effects are represented on maximal increase (Max), initial slope (slope), area under the curve (AUC), and Z score. Compounds were clustered according to decreasing size effects on maximal increase. (B) Spearman correlation analysis of the four curve parameters for CRP and thrombin. Color bar represents calculated R values. (C) Percentages of active, assay-interfering compounds per class (Z score >4 or < -4), calculated as means of three parameters for CRP- (black) and thrombin- (gray) stimulated platelets. For further details, see Figure S1.
Figure 6
Figure 6
Drug-dependent inhibitory profiles on platelet Ca2+ responses in 384- and 1,536-well formats Calcium-6-loaded platelets were pretreated for 10 min with indicated compounds or vehicle (control) and injected with CRP (10 μg/mL) or thrombin (4 nM) or remained unstimulated (resting) using a FLIPR-Tetra robot and 384- or 1,536-well plates, as described for Figure 3. Changes in pseudo-ratio fluorescence (F/Fo) per well were determined for 600 s. (A–D) Platelet responses in 384-well plates; means ± SEM (n = 6). (E–H) Platelet responses in 1,536-well plates; means ± SEM (n = 3). For 384-well (A and B) and 1,536-well (E and F) formats are given representative [Ca2+]i traces of resting (gray), CRP- or thrombin-stimulated platelets. Drugs used were (final concentrations): PRT060318 (5 μM, black dotted), indomethacin (10 μM, gray dotted) or ticagrelor (10 μM, gray diamonds). Drug effects on maximum [Ca2+]i increases in 384 wells (C and D) or 1,536 wells (G and H); values are expressed as percentages relative to corresponding control. One-way ANOVA, ∗p < 0.05, ∗∗p < 0.005, ∗∗∗p < 0.001, ∗∗∗∗p < 0.0001 versus agonist.
Figure 7
Figure 7
Drug-dependent effects on early and late slopes of platelet Ca2+ responses in 384- and 1,536-well formats Calcium-6-loaded platelets were pretreated for 10 min with PRT0606318, indomethacin, or ticagrelor and activated with CRP or thrombin in 384- wells or 1,536-well plates, as described for Figure 6. Pseudo-ratioed fluorescence traces over 600 s were regressed to smoothed curves for the calculation of early and late rates of change (RoC). (A–D) Shown are data of early RoC (upper panels) and late RoC (lower panels) for platelets stimulated with CRP (A and C) or thrombin (B and D) in 384- or 1,536-well formats. Values are expressed as percentages relative to controls. Means ± SEM (n = 3). One-way ANOVA, ∗p < 0.05, ∗∗p < 0.005, ∗∗∗p < 0.001, ∗∗∗∗p < 0.0001 versus agonist.

Similar articles

Cited by

References

    1. Anderson J.L., Morrow D.A. Acute myocardial infarction. N. Engl. J. Med. 2017;376:2053–2064. - PubMed
    1. Andre P., Morooka T., Sim D., Abe K., Lowell C., Nanda N., Delaney S., Siu G., Yan Y., Hollenbach S., et al. Critical role for Syk in responses to vascular injury. Blood. 2011;118:5000–5010. - PMC - PubMed
    1. Arkin M.R., Tang Y., Wells J.A. Small-molecule inhibitors of protein-protein interactions: progressing toward the reality. Chem. Biol. 2014;21:1102–1114. - PMC - PubMed
    1. Baaten C.C., Meacham S., De Witt S.M., Feijge M.A., Adams D.J., Akkerman J.N., Cosemans J.M., Grassi L., Jupe S., Kostadima M., et al. A synthesis approach of mouse studies to identify genes and proteins in arterial thrombosis and bleeding. Blood. 2018;132:e35–e46. - PMC - PubMed
    1. Bhambure R., Kumar K., Rathore A.S. High-throughput process development for biopharmaceutical drug substances. Trends Biotechnol. 2011;29:127–135. - PubMed

LinkOut - more resources