. 2022 Apr;9(10):e2103745.
doi: 10.1002/advs.202103745. Epub 2022 Jan 24.

Monitoring EPR Effect Dynamics during Nanotaxane Treatment with Theranostic Polymeric Micelles

Affiliations

Monitoring EPR Effect Dynamics during Nanotaxane Treatment with Theranostic Polymeric Micelles

Ilaria Biancacci et al. Adv Sci (Weinh). 2022 Apr.

Abstract

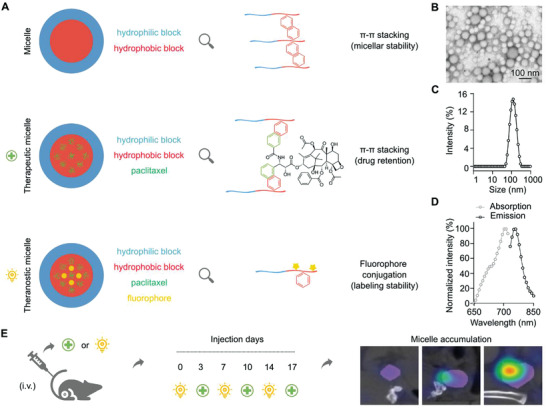
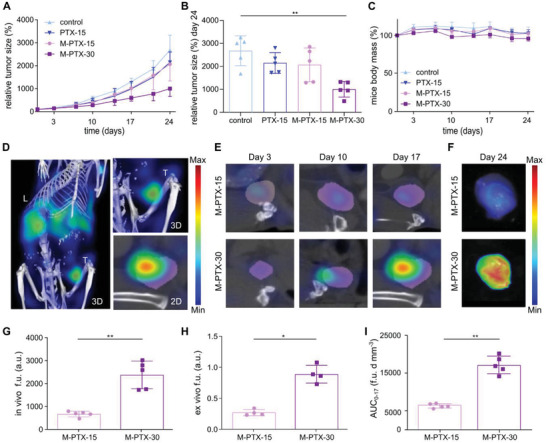
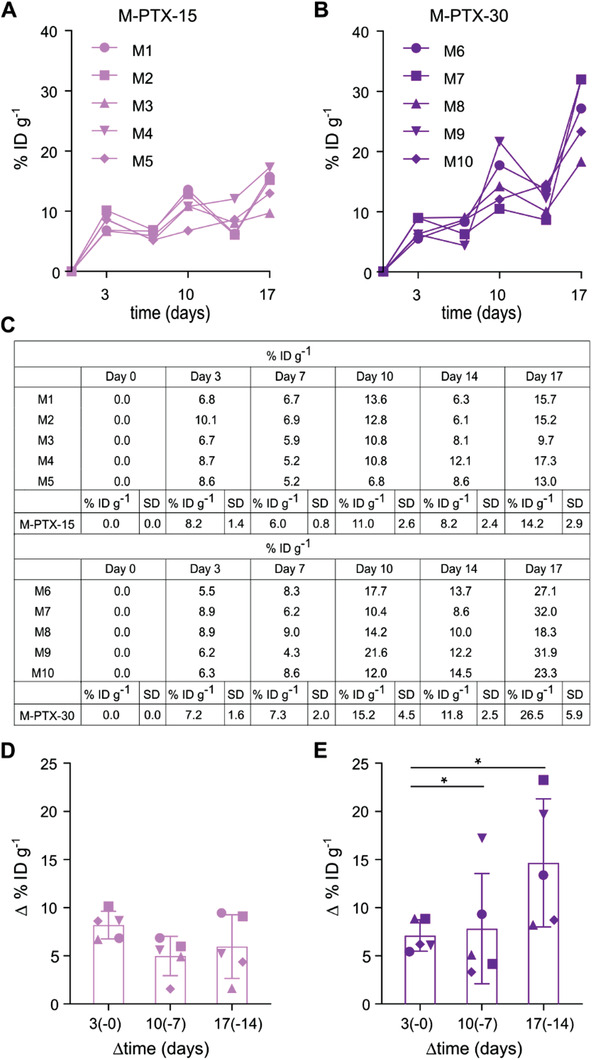
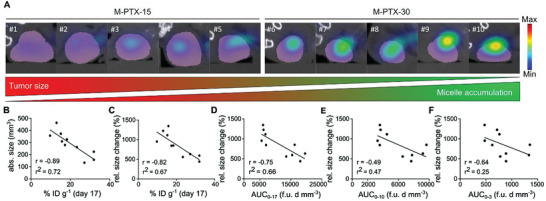
Cancer nanomedicines rely on the enhanced permeability and retention (EPR) effect for efficient target site accumulation. The EPR effect, however, is highly heterogeneous among different tumor types and cancer patients and its extent is expected to dynamically change during the course of nanochemotherapy. Here the authors set out to longitudinally study the dynamics of the EPR effect upon single- and double-dose nanotherapy with fluorophore-labeled and paclitaxel-loaded polymeric micelles. Using computed tomography-fluorescence molecular tomography imaging, it is shown that the extent of nanomedicine tumor accumulation is predictive for therapy outcome. It is also shown that the interindividual heterogeneity in EPR-based tumor accumulation significantly increases during treatment, especially for more efficient double-dose nanotaxane therapy. Furthermore, for double-dose micelle therapy, tumor accumulation significantly increased over time, from 7% injected dose per gram (ID g-1 ) upon the first administration to 15% ID g-1 upon the fifth administration, contributing to more efficient inhibition of tumor growth. These findings shed light on the dynamics of the EPR effect during nanomedicine treatment and they exemplify the importance of using imaging in nanomedicine treatment prediction and clinical translation.

Keywords: EPR effect; cancer nanomedicine; polymeric micelles; theranostics; tumor targeting.


Conflict of interest statement

The authors declare no conflict of interest.

Figures

Figure 1
Figure 1
Micelle formulation and study setup. A) Polymeric micelles were physically stabilized by Π‐Π stacking and paclitaxel (PTX) was entrapped in the hydrophobic core with the assistance of Π‐Π stacking to form therapeutic micelles. Cy7 was covalently conjugated in the hydrophobic core of the micelles to provide theranostic micelles. B–D) Characterization of theranostic micelles using transmission electron microscopy (TEM) and fluorometer for their size and absorbance and emission spectra. E) Treatment and imaging protocol: 4T1 tumor‐bearing mice were injected i.v. twice weekly for 3 weeks, alternating therapeutic, and theranostic micelles. Mice were longitudinally monitored via hybrid CT‐FMT imaging on days 0, 3, 7, 10, 14, and 17 to evaluate the dynamics of the EPR effect during the course of nanotaxane therapy.
Figure 2
Figure 2
Treatment efficacy and tumor accumulation monitoring of paclitaxel‐loaded polymeric micelles. A,B) At the end of the study, the relative tumor size was significantly decreased for the M‐PTX‐30 group as compared to PBS and free or encapsulated PTX dosed at 15 mg kg–1 groups. % values are calculated based on each individual tumor absolute size at day 0. C) Mouse body mass remained constant during treatment, demonstrating the tolerability of the interventions. % values are calculated based on the body mass of each mouse at day 0. D,E) Representative in vivo CT‐FMT images of the tumor localization of theranostic micelles exemplify the stable accumulation pattern for micelles dosed at 15 mg kg–1 PTX‐equivalent and the increasing accumulation pattern for micelles dosed at 30 mg kg–1 PTX‐equivalent. T = Tumor. L = Liver. F) Ex vivo FRI images of the tumor accumulation of Cy7‐labeled PTX‐micelles at the end of the study, demonstrated higher tumor accumulation for the double‐dosed micelles. G,H) Quantification of the in vivo (CT‐FMT; on day 17) and ex vivo (FRI; on day 24) fluorescence units (f.u.) of Cy7‐labeled PTX‐micelles in tumors showed disproportionally higher accumulation of the double‐dosed micelles after the last micelles injection. I) The cumulative concentrations (AUC; area under the curve in fluorescence units*days*mm–3 (f.u. d mm–3) of Cy7‐labeled PTX‐micelles in tumors, measured between day 0 and day 17, confirmed the disproportionally higher tumor accumulation for the 30 mg kg–1‐dosed micelles versus the 15 mg kg–1‐dosed micelles. Values represent average ± SD. * p < 0.05, ** p < 0.01. Panel B: n = 5 per group; unpaired, nonparametric one‐way ANOVA and Dunn's multiple comparison test. Panels G,I: n = 5 per group; unpaired, nonparametric, two‐tailed t‐test. Panel H: n = 4 per group; unpaired, nonparametric, two‐tailed t‐test.
Figure 3
Figure 3
Quantitative assessment of individual EPR effect dynamics during treatment. A,B) Theranostic micelles were administered on days 0, 7, and 14, and therapeutic micelles on days 3, 10, and 17. Comparable % ID g–1 of micelles were found in 4T1 tumors after the 1st injection for the 15 and the 30 mg kg–1 groups, while cumulative accumulation patterns upon subsequent injections indicated a disproportionally large increase in EPR‐mediated tumor accumulation for the 30 mg kg–1 group. C) The table summarizes the % ID g–1 values for the 15 and 30 mg kg–1 groups on days 0, 3, 7, 10, 14 and 17. D,E) The evolution of and variability in EPR‐mediated micelle accumulation in tumors was quantified via determining the difference (i.e., ∆ % ID g–1) between the % ID g–1 of Cy7‐PTX‐micelles accumulated 3 d after i.v. injection and the % ID g–1 of Cy7‐PTX‐micelles present in tumors just before that respective i.v. injection. The ∆ % ID g–1 values slightly decreased on average over time for the 15 mg kg–1 group and slightly increased for the 30 mg kg–1 group. Inter‐individual variability in EPR‐mediated tumor accumulation increased for both groups. Values represent average ± SD (n = 5 per group). F‐tests on unpaired, parametric, two‐tailed t tests with Welch's correction were performed to compare variance between the different time points. In addition, paired, parametric, two‐tailed t‐tests were performed to compare ∆ % ID g–1 values between each injection for both groups. Unpaired, parametric, two‐tailed t‐tests were performed to assess differences in micelle accumulation (∆ % ID g–1) between M‐PTX‐15 and M‐PTX‐30 at the different time points. * < 0.05.
Figure 4
Figure 4
Nanomedicine tumor accumulation correlates with antitumor response. A) 2D CT‐FMT images on the transverse plane taken on day 17 show that tumors which strongly accumulate PTX‐micelles have smaller sizes than tumors which accumulate micelles less efficiently. Tumor accumulation is shown as blue‐to‐red fluorescence clouds. CT‐segmentations of tumors are presented in purple. B–F) Correlation of static and dynamic polymeric micelle tumor accumulation with therapy outcome. Static assessment of polymeric micelle accumulation at day 17 (i.e., after three theranostic and three therapeutic doses) shows a very good correlation with antitumor response for both B) absolute and C) relative tumor growth kinetics. Dynamic assessment of cumulative micelle accumulation over time (i.e., the area under the curve; AUC) also correlated well with therapy outcome. The relative size change in tumor growth (in %) between day 3 and 24 was correlated with micelle AUC (fluorescence units*days*mm–3 (f.u. d mm–3)) upon D) all three, E) the first two, and F) only the first injection, showing that prolonged monitoring produces more favorable results. Spearman´s correlation coefficient (r) and goodness‐of‐fit for linear regression (r 2) using alpha threshold of 0.05 were calculated using GraphPadPrism 9.

References

    1. a) Maeda H., Matsumura Y., Cancer Res. 1986, 46, 6387; - PubMed
    2. b) Maeda H., Sawa T., Konno T., J. Controlled Release 2001, 74, 47; - PubMed
    3. c) Golombek S. K., May J. N., Theek B., Appold L., Drude N., Kiessling F., Lammers T., Adv. Drug Delivery Rev. 2018, 130, 17. - PMC - PubMed
    1. a) Kim B. Y. S., Rukta J. T., Chan W. C. W., N. Engl. J. Med. 2010, 363, 2434; - PubMed
    2. b) Van Der Meel R., Sulheim E., Shi Y., Kiessling F., Mulder W. J. M., Lammers T., Nat. Nanotechnol. 2019, 14, 1007; - PMC - PubMed
    3. c) Zhao Z., Ukidve A., Kim J., Mitragotri S., Cell 2020, 181, 151. - PubMed
    1. a) Lammers T., Kiessling F., Hennink W. E., Storm G., J. Controlled Release 2012, 161, 175; - PubMed
    2. b) Chauhan V. P., Jain R. K., Nat. Mater. 2013, 12, 958; - PMC - PubMed
    3. c) Shi J., Kantoff P. W., Wooster R., Farokhzad O. C., Nat. Rev. Cancer 2017, 17, 20. - PMC - PubMed
    1. a) Oh P., Testa J. E., Borgstrom P., Witkiewicz H., Li Y., Schnitzer J. E., Nat. Med. 2014, 20, 1062; - PubMed
    2. b) Sindhwani S., Syed A. M., Ngai J., Kingston B. R., Maiorino L., Rothschild J., Macmillan P., Zhang Y., Rajesh N. U., Hoang T., Wu J. L. Y., Wilhelm S., Zilman A., Gadde S., Sulaiman A., Ouyang B., Lin Z., Wang L., Egeblad M., Chan W. C. W., Nat. Mater. 2020, 19, 566. - PubMed
    1. a) Miller M. A., Zheng Y., Gadde S., Pfirschke C., Zope H., Engblom C., Kohler R. H., Iwamoto Y., Yang K. S., Askevold B., Kolishetti N., Pittet M., Lippard S. J., Farokhzad O. C., Weissleder R., Nat. Commun. 2015, 6, 8692; - PMC - PubMed
    2. b) Miller M. A., Engblom C., Gadde S., Sprachman M. M., Pittet M. J., Weissleder R., Laughney A. M., Kamaly N., Farokhzad O. C., Wojtkiewicz G., Kohler R. H., Yang K. S., Bhonagiri S., Pfirschke C., Sci. Transl. Med. 2015, 7, 314ra183. - PMC - PubMed

Publication types

LinkOut - more resources