. 2022 Jan 3;63(1):30.
doi: 10.1167/iovs.63.1.30.

Hyperglycemia Induces Meibomian Gland Dysfunction

Affiliations

Hyperglycemia Induces Meibomian Gland Dysfunction

Yuli Guo et al. Invest Ophthalmol Vis Sci. .

Abstract

Purpose: Patients diagnosed with diabetes are inclined to have abnormalities on stability of tear film and disorder of meibomian gland (MG). This study aims to explore the pathological change of MG induced by diabetes in a rat model.

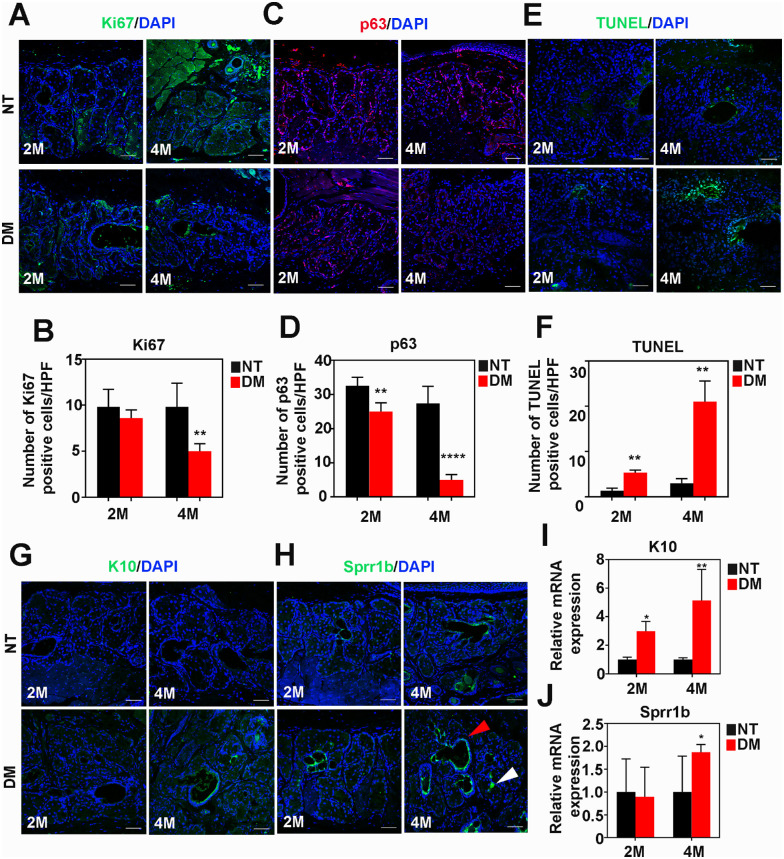
Methods: Sprague-Dawley (SD) rats were intraperitoneally injected with streptozotocin (STZ) to establish a diabetic animal model. Lipid accumulation in MG was detected by Oil Red O staining and LipidTox staining. Cell proliferation status was determined by Ki67 and P63 immunostaining, whereas cell apoptosis was confirmed by TUNEL assay. Gene expression of inflammatory cytokines and adhesion molecules IL-1α, IL-1β, ELAM1, ICAM1, and VCAM1 were detected by RT-PCR. Activation of ERK, NF-κB, and AMPK signaling pathways was determined by Western Blot analysis. Oxidative stress-related factors NOX4, 4HNE, Nrf2, HO-1, and SOD2 were detected by immunostaining or Western Blot analysis. Tom20 and Tim23 immunostaining and transmission electron microscopy were performed to evaluate the mitochondria functional and structure change.

Results: Four months after STZ injection, there was acini dropout in MG of diabetic rats. Evident infiltration of inflammatory cells, increased expression of inflammatory factors, and adhesion molecules, as well as activated ERK and NF-κB signaling pathways were identified. Oxidative stress of MG was evident in 4-month diabetic rats. Phospho-AMPK was downregulated in MG of 2-month diabetic rats and more prominent in 4-month rats. After metformin treatment, phospho-AMPK was upregulated and the morphology of MG was well maintained. Moreover, inflammation and oxidative stress of MG were alleviated after metformin intervention.

Conclusions: Long-term diabetes may lead to Meibomian gland dysfunction (MGD). AMPK may be a therapeutic target of MGD induced by diabetes.


Conflict of interest statement

Disclosure: Y. Guo, None; H. Zhang, None; Z. Zhao, None; X. Luo, None; M. Zhang, None; J. Bu, None; M. Liang, None; H. Wu, None; J. Yu, None; H. He, None; R. Zong, None; Y. Chen, None; Z. Liu, None; W. Li, None

Figures

Figure 1.
Figure 1.
The manifestation of eyelid and ocular surface of DM rats. (A) The body weight of the DM group shows an obvious decrease compared with NT group from 2 weeks after modeling (n = 6). (B) The blood glucose level of DM group shows significant increase than the NT group at each time points (n = 6). (C) The slit lamp images of ocular surface and eyelid at 2 weeks, 2 months, and 4 months after STZ injection. The black arrow shows abnormal lipid secretion in the meibomian gland orifice. (D) The stereoscopic images of the meibomian gland shows the obvert MG dropout in the 4-month DM group (black arrow heads). (E) H&E staining shows disarranged MG acini (black arrowhead) at 4 months after STZ injection. (F) The quantification of length of major axis and minor axis of acini shows decreased size of acini at 4 months after STZ injection (n = 6). ***P < 0.001. Scale bars represent 200µm. (G) The immunofluorescent staining of collagen IV in the MG of each group. White arrowheads show the destroyed acini basement membrane in the MG of 4-month DM rat. Scale bars represent 100 µm.
Figure 2.
Figure 2.
Lipid metabolism disorder of MG in 4-month DM rats. (A) The ORO staining of the MG shows condensed positive staining in 4-month DM rats. (B) The LipidTOX staining of the MG manifests an obvious lipid accumulation in 4-month DM rats. (C) The mean fluorescent intensity of LipidTOX (n = 4). (D–G) The relative mRNA expression of lipid metabolism related enzymes Elovl3, SOAT1, DHCR24, and HMGCR (n = 6). (H) The qRT-PCR shows reduced PPAR-γ mRNA expression at the MG of 4-month DM rats (n = 6). (I) The immunofluorescent staining shows reduced nuclear and cytoplasmic PPAR-γ expression at 4-month DM rats (n = 3). (J) The Western blot analysis of PPAR-γ in 4-month NT rats and DM rats. (K) The gray-scale analysis of Western blot shows a decrease of PPAR-γ expression at the MG of 4-month DM rats (n = 3). *P < 0.05, **P < 0.01, ***P < 0.001. Scale bars represent 200 µm in A and 100 µm in B, and I.
Figure 3.
Figure 3.
Abnormal differentiation and increased apoptosis of MG cells in 4-month DM rats. (A) Immunofluorescent staining of Ki67 shows positive staining in the acini of the MG. (B) Ki67 positive cell counting shows a significant decrease in the 4-month DM group (n = 5). (C) Immunofluorescent staining of p63 shows positive staining in the acini of the MG. (D) Quantification of p63 positive cells shows decrease in the 2-month DM group and the 4-month DM group (n = 5). (E) TUNEL staining demonstrates apoptotic cells in the MG. (F) Quantification of TUNEL positive cells shows an increase in the 2-month DM group and the 4-month DM group (n = 3). (G) Immunofluorescent staining of K10 shows keratinization of epithelial cells in the MG. (H) Immunofluorescent staining of Sprr1b in the MG of each group. (I) The relative mRNA expression shows an obvious increase of K10 in the 4-month DM group (n = 6). (J) The relative mRNA expression shows an obvious increase of Sprr1b in the 4-month DM group (n = 4). *P < 0.05, **P < 0.01, ***P < 0.001. Scale bars represent 100 µm in A, C, E, G, and H.
Figure 4.
Figure 4.
Inflammation of the MG in DM rats. (A) Immunofluorescent staining shows CD45 positive cells in the MG. (B) Immunofluorescent staining shows PMNs in the MG. (C) CD45 positive cell counting shows a significant increase in the 4-month DM group (n = 3). (D) Quantification of PMN positive cells shows an obvious increase in the 4-month DM group (n = 3). (E–I) The relative mRNA expression of inflammatory cytokines and adhesion molecules IL-1α, IL-1β, ELAM1, ICAM1, and VCAM1 (n = 4). (J) The protein expression of pERK1/2, ERK1/2, pNFκB p65, and NFκB p65 in the MG. (K) The gray-scale analysis of relative phosphorylation of ERK1/2 and NFκB p65 shows upregulated phosphorylation of ERK1/2 and NFκB p65 in the MG of 4-month DM rats (n = 3). *P < 0.05, **P < 0.01, ***P < 0.001. Scale bars represent 100 µm in A and B.
Figure 5.
Figure 5.
Oxidative stress and mitochondria deterioration of MG in 4-month DM rats. (A) Immunofluorescent staining of DHE in the MG. (B) The mean fluorescence intensity of DHE in the MG shows upregulation of DHE in the MG of DM rats (n = 4). (C) Immunohistochemical staining of NOX4 in the MG shows an obvious increase in the 4-month DM group. (D) Immunohistochemical staining shows an obvious increase of 4HNE in the MG in the 4-month DM group. (E) Western blot analysis of Nrf2, HO-1, and SOD2 in the MG of each group. (F–H) The gray-scale analysis of Nrf2, HO-1, and SOD2 protein expression in the MG (n = 3). (I) Immunofluorescent staining of Tom20 in the MG shows an evident decrease in the 4-month DM group. (J) Immunofluorescent staining of Tim23 in the MG shows an evident decrease in the 4-month DM group. (K) The protein expression of Tom20 and Tim23 in MG. (L, M) The gray-scale analysis of Tom20 and Tim23 in the MG of each group (n = 3). (N) The transmission electron microscopic images of acinar cells of each group. *P < 0.05, **P < 0.01, ***P < 0.001. Scale bars represent 100 µm in A, I, and J, and 50 µm in C and D, and 5.0 µm in N.
Figure 6.
Figure 6.
AMPK agonist treatment protects MG from pathological exacerbation in 4-month DM rats. (A) Immunohistochemical staining of phospho-AMPKα in the MG shows obvious decrease in the 2-month DM group and the 4-month DM group. (B) Western blot analysis results of phospho-AMPKα and AMPKα in the MG. (C) The gray-scale analysis of relative phosphorylation of AMPKα shows reduced phospho-AMPKα in the MG of DM rats (n = 3). (D) Dose response of phospho-AMPKα and AMPKα expression on metformin treatment in the MG. (E) Slit lamp images of the ocular surface and the MG after metformin treatment. (F) The stereoscopic images of the MG after metformin treatment (black arrowhead shows the MG acini dropout in DM rats). (G) H&E staining of the MG after metformin treatment. (H) ORO staining of the MG after metformin treatment. (I) Protein expression level of phospho-AMPKα, AMPKα, Nrf2, HO-1, and SOD2 after metformin treatment. (J) The gray-scale analysis of phospho-AMPKα, Nrf2, HO-1, and SOD2 after metformin treatment (n = 3). (K) The relative mRNA expression of inflammatory cytokines and adhesion molecules IL-1α, IL-1β, ELAM1, ICAM1, and VCAM1 after metformin treatment (n = 3). *P < 0.05, **P < 0.01, ***P < 0.001. Scale bars represent 100 µm in A and 200 µm in G and H.

References

    1. Jester JV, Nicolaides N, Smith RE.. Meibomian gland studies: histologic and ultrastructural investigations. Invest Ophthalmol Vis Sci. 1981; 20: 537–547. - PubMed
    1. Willcox MDP, Argüeso P, Georgiev GA, et al. .. TFOS DEWS II Tear Film Report. Ocular Surface. 2017; 15: 366–403. - PMC - PubMed
    1. Butovich IA. Meibomian glands, meibum, and meibogenesis. Exp Eye Res. 2017; 163: 2–16. - PMC - PubMed
    1. Nelson JD, Shimazaki J, Benitez-del-Castillo JM, et al. .. The international workshop on meibomian gland dysfunction: report of the definition and classification subcommittee. Invest Ophthalmol Vis Sci. 2011; 52: 1930–1937. - PMC - PubMed
    1. Chhadva P, Goldhardt R, Galor A.. Meibomian Gland Disease: The Role of Gland Dysfunction in Dry Eye Disease. Ophthalmology. 2017; 124: S20–S26. - PMC - PubMed

Publication types